

Abstract
Many modern human genomes retain DNA inherited from interbreeding with archaic hominins, such as Neanderthals, yet the influence of this admixture on human traits is largely unknown. We analyzed the contribution of common Neanderthal variants to over 1,000 electronic health record (EHR)-derived phenotypes in ~28,000 adults of European ancestry. We discovered and replicated associations of Neanderthal alleles with neurological, psychiatric, immunological, and dermatological phenotypes. Neanderthal alleles together explain a significant fraction of the variation in risk for depression and skin lesions resulting from sun exposure (actinic keratosis), and individual Neanderthal alleles are significantly associated with specific human phenotypes, including hypercoagulation and tobacco use. Our results establish that archaic admixture influences disease risk in modern humans, provide hypotheses about the effects of hundreds of Neanderthal haplotypes and demonstrate the utility of EHR data in evolutionary analyses.
Keywords: Neanderthal admixture, human evolution, phenome-wide association study, electronic health record
As anatomically modern human (AMH) groups left Africa and began to spread across Europe and Asia ~60,000 years ago, they encountered other archaic hominins. The fossil record suggests that AMHs and several archaic hominins overlapped in space and time (1), and genomic analyses of modern and ancient humans, and extinct Neandertals and Denisovans have revealed interbreeding between these groups (2, 3). As a result, the genomes of modern Eurasians contain a small fraction (~1.5–4%) of DNA inherited from interbreeding with Neanderthals around 50,000 years ago (4–6).
The patterns of surviving Neanderthal DNA across modern Eurasian genomes indicate that introgressed Neanderthal DNA experienced strong selective pressures. Surviving Neanderthal lineages are significantly depleted in several genomic regions—e.g., on the X chromosome and the q-arm of chromosome 7—suggesting deleterious consequences of Neanderthal DNA at many loci (5, 6). However, some Neanderthal alleles are found at higher than expected frequencies and thus may have provided an evolutionary advantage to AMH populations (5–7). Consistent with this hypothesis, Neanderthals are believed to have lived out of Africa long enough to adapt to the unique climatic, dietary, and pathogenic landscapes found at higher latitudes.
Indeed, isolated introgressed loci have been identified with potential roles in human adaptation (7, 8). Furthermore, recent studies of genomic regions enriched in Neanderthal alleles have suggested potential effects on skin and hair phenotypes, lipid metabolism, depression and other traits (5, 6, 9). However, whether introgressed Neanderthal alleles have a significant functional effect on these traits in human populations has not been established, because of the difficulty of confidently identifying Neanderthal-derived DNA and the expense of performing tests for trait association between individuals with and without Neanderthal ancestry at specific sites.
We addressed these challenges by integrating the phenotype data present in electronic health records (EHRs) with high-resolution maps of Neanderthal haplotypes across individual human genomes (Fig. 1A). We performed a large-scale assessment of the functional effects of DNA inherited from Neanderthals on health-related traits in modern European ancestry populations. In particular, we analyzed genotype and phenotype data from the Electronic Medical Records and Genomics (eMERGE) Network, a consortium that unites EHR systems linked to patient genetic data from nine sites across the United States (10). EHRs contain quantitative and qualitative data on individuals’ traits; however, algorithms are required to derive consistent phenotypes appropriate for use in genetic association testing from these records. For the majority of our analyses, we used a set of 1,689 hierarchically related phenotypes (including 1,087 leaf phenotypes) defined from the use of International Classification of Diseases (ICD-9) billing codes in the EHRs (11). We analyzed a set of 28,416 adults of European ancestry from across the eMERGE sites who had been genotyped on genome-wide arrays and had sufficient EHR data to define phenotypes. These individuals naturally fell into separate discovery and replication cohorts on the basis of their inclusion in the eMERGE Network Phase 1 (E1; N=13,686) or Phase 2 (E2; N=14,730) data releases (12).
Fig. 1. Analysis of electronic health records reveals clinical effects of Neanderthal alleles in modern humans.
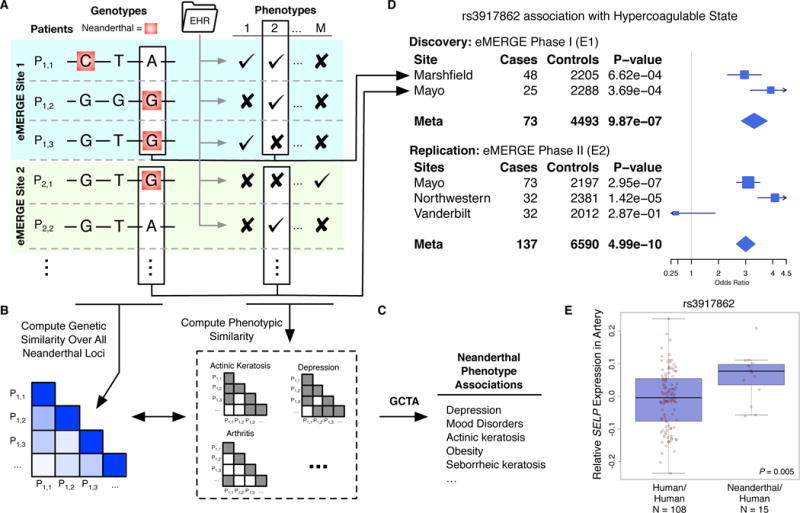
(A) Thousands of Neanderthal alleles were identified in ~28,000 individuals of European ancestry across the eMERGE Network. We derived phenotypes for each individual from data in their electronic health records (EHRs). (B) To test Neanderthal alleles in aggregate for phenotype associations, we computed the genetic similarity of all pairs of individuals over 1,495 genotyped Neanderthal loci and their phenotypic similarity over 46 EHR-derived traits. (C) We estimated the overall variance in risk explained by Neanderthal alleles using mixed linear models in GCTA (15) and found that Neanderthal alleles explain significant variance in several traits (Table 1). (D) To test individual Neanderthal alleles for trait associations, we performed a discovery meta-analysis across eMERGE phase 1 (E1) sites with sufficient data. We then ran a replication meta-analysis over the independent eMERGE phase 2 (E2) cohort. This approach identified and replicated several associations (Table 2). The example forest plot illustrates the association of Neanderthal SNP rs3917862 with hypercoagulable state in each site with >= 20 cases for the separate discovery and replication analyses. (E) rs3917862 is located in an intron of P-selectin (SELP), a gene that mediates leukocyte action at injuries in the early stages of inflammation. The Neanderthal allele is significantly associated (linear regression, P = 0.005) with increased expression of SELP in tibial artery data from GTEx.
To identify Neanderthal alleles in the genotyping data available from eMERGE, we used a recent genome-wide map of ~6,000 Neanderthal haplotypes inferred by computing the S* statistic (13) and refining putative introgressed haplotypes by comparing sequenced individuals from the 1,000 Genomes (1KG) Project (14) with the Altai Neanderthal genome (3, 6). We defined ~135,000 high-confidence “Neanderthal SNPs” among the introgressed haplotypes by filtering out SNPs whose frequency significantly differed from the overall Neanderthal haplotype frequency and removing haplotypes with fewer than four likely Neanderthal-derived SNPs (11). This filtering was necessary to remove variants unlikely to derive from Neanderthal admixture.
Neanderthal variants have been hypothesized to influence many phenotypes in AMHs, including lipid metabolism, immunity, depression, digestion, and hair/skin, on the basis of the enrichment of Neanderthal variants in regions of the genome relevant to these traits (3, 5, 6, 9). Accordingly, we first tested these hypotheses using genome-wide complex trait analysis (GCTA) to estimate the phenotypic risk explained by 1,495 genotyped common (MAF >1%) Neanderthal SNPs for a set of 46 high-prevalence phenotypes from the hypothesized categories, using age, sex, and eMERGE site as covariates (Fig. 1B,C) (15). Neanderthal SNPs explained a significant (likelihood ratio test; FDR < 0.05 over all phenotype tests) percent of the risk in three traits in the E1 discovery cohort (Table 1): depression (2.03%, P = 0.0036), myocardial infarction (1.39%, P = 0.0026), and corns and callosities (1.26%, P = 0.01). Neanderthal SNPs also explained a nominally significant (P < 0.1) percent of risk for nine additional traits, including actinic and seborrheic keratosis, coronary atherosclerosis, and obesity (Table 1).
Table 1. Neanderthal alleles explain risk for human clinical traits.
The eight traits for which Neanderthal alleles explained a nominally significant proportion of variance in risk in both the E1 discovery and E2 replication analyses are listed (GCTA, P < 0.1). The depression association remained significant after controlling the false discovery rate at 5%. The Neanderthal associations with actinic keratosis, mood disorders, and depression were also maintained in a two GRM model that considered the risk explained by non-Neanderthal variants. Phenotypes are sorted by their E2 P-value.
| Phenotype | Discovery (E1) | Replication (E2) | Replication (E2; two GRM) | |||
|---|---|---|---|---|---|---|
| Risk Explained | P | Risk Explained | P | Risk Explained | P | |
| Actinic keratosis | 0.64% | 0.066 | 3.37% | 0.0059 | 2.49% | 0.036 |
| Mood disorders | 1.11% | 0.0091 | 0.75% | 0.018 | 0.68% | 0.029 |
| Depression | 2.03% | 0.0023 | 1.15% | 0.020 | 1.06% | 0.031 |
| Obesity | 0.59% | 0.048 | 1.23% | 0.030 | 0.39% | 0.27 |
| Seborrheic keratosis | 0.77% | 0.038 | 0.61% | 0.045 | 0.41% | 0.13 |
| Overweight | 0.60% | 0.037 | 0.53% | 0.052 | 0.23% | 0.24 |
| Acute upper respiratory infections | 0.70% | 0.043 | 0.56% | 0.062 | 0.34% | 0.18 |
| Coronary atherosclerosis | 0.68% | 0.04 | 0.42% | 0.098 | 0.34% | 0.15 |
Of the 12 nominally significant associations, eight replicated in the independent E2 dataset, including actinic keratosis (P = 0.0059), mood disorders (P = 0.018), depression (P = 0.020), obesity (P = 0.030), and seborrheic keratosis (P = 0.045) at P <0.1 (Table 1; likelihood ratio test). We also tested whether the percent of phenotypic variance explained by Neanderthal SNPs remained significant in the context of non-Neanderthal SNPs by including an additional genetic relationship matrix (GRM) computed from non-Neanderthal SNPs across the rest of the human genome in the mixed linear model (11). Depression (P = 0.031), mood disorders (P = 0.029), and actinic keratosis (P = 0.036) replicated with these stricter criteria in the independent E2 cohort.
These analyses establish the influence of Neanderthal SNPs in concert on the variance in these traits. We estimated individual effects for each SNP by the best linear unbiased predictions (BLUPs); this indicated that a similar number of Neanderthal SNPs increase and decrease risk for each associated phenotype (Table S1) (11). To gain insight into the loci driving these associations, we analyzed the genomic distribution of the 10% of SNPs with the highest and lowest BLUPs for actinic keratosis and depression. We found enrichment (FDR < 0.05; hypergeometric test) for many functional annotations: most notably, keratinocyte differentiation and several immune functions for actinic keratosis and regions involved in neurological diseases, cell migration, and circadian clock genes for depression (Fig. S1; Table S2) (11).
The significant replicated association of Neanderthal SNPs with mood disorders, in particular depression, is intriguing since Neanderthal alleles are enriched near genes associated with long-term depression (5), and human–Neanderthal DNA and methylation differences have been hypothesized to influence neurological and psychiatric phenotypes (16, 17). Depression risk in modern human populations is influenced by sunlight exposure (18), which differs between high and low latitudes, and we found enrichment of circadian clock genes near the Neanderthal alleles that contribute most to this association (11). The replicated nominal association of Neanderthal SNPs with actinic keratosis (precancerous scaly skin lesions) further links introgressed alleles in AMHs to a phenotype directly related to sun exposure. It also suggests that the signatures of adaptive introgression and strong enrichment of Neanderthal alleles near genes associated with keratin filament formation (5) and keratinocytes (6) reflect the influence of Neanderthal alleles on a modern human phenotype. However, further genetic analyses are necessary to resolve the differences in the strength of this association between E1 and E2. These results establish the impact of Neanderthal DNA on diseases in AMHs that involve traits potentially influenced by environmental differences experienced by non-African populations.
GCTA quantifies the overall influence of Neanderthal SNPs together on traits in AMHs. To identify individual Neanderthal loci associated with AMH phenotypes and potentially discover additional biological systems influenced by Neanderthal admixture, we performed a phenome-wide association study (PheWAS) of these 1,495 Neanderthal SNPs with 1,152 EHR-derived phenotypes with at least 20 cases in at least one site (Fig. 1D). PheWAS allows for large-scale characterization of the effects of variants of interest (19). We carried out two meta-analyses across the eMERGE Network sites—one over the discovery cohort and one over the replication cohort. We focus on the meta-analyses here (Tables 2; S3), but a pooled analysis using eMERGE site as a covariate produced largely consistent results (Table S4).
Table 2. Individual Neanderthal SNPs with significant replicating phenotype associations.
Four locus-wise Bonferroni significant Neanderthal SNP-phenotype associations replicated (with a fixed effect P < 0.05 and consistent direction of effect). Nominally significant replicating results can be found in Table S3 and in the PheWAS Catalog (https://phewas.mc.vanderbilt.edu/neanderthal).
| Discovery | Replication | ||||||
|---|---|---|---|---|---|---|---|
| Phenotype | Chr: Position (hg19) | SNP | Flanking Gene(s) | Odds Ratio | P | Odds Ratio | P |
| Hypercoagulable state | 1:169593113 | rs3917862 | SELP | 3.32 | 9.9E–7 | 3.00 | 5.0E–10 |
|
| |||||||
| Protein-calorie malnutrition | 1:234099819 | rs12049593 | SLC35F3 | 1.77 | 2.0E–6 | 1.63 | 5.5E–5 |
|
| |||||||
| Symptoms involving urinary system | 11:3867350 | rs11030043 | RHOG, STIM1 | 1.76 | 7.4E–6 | 1.65 | 4.3E–2 |
|
| |||||||
| Tobacco use disorder | 3:10962315 | rs901033 | SLC6A11 | 2.19 | 1.7E–5 | 1.75 | 7.9E–4 |
Four Neanderthal SNP–phenotype associations passed a locus-wise Bonferroni corrected significance threshold (P = 3.3E-5) in the E1 meta-analysis and replicated (P <0.05) with the same direction of effect in the independent E2 meta-analysis (Table 2). The strongest signal was a Neanderthal SNP (rs3917862, 6.5% EUR 1KG frequency) in an intron of P-selectin (SELP) that was significantly associated with hypercoagulable state in both E1 and E2 (Table 2; Fig. 1D). This haplotype contains several genes directly involved in blood coagulation and inflammation, most notably SELP, which encodes a cell adhesion protein expressed on the surface of endothelial cells and platelets that recruits leukocytes to injuries during inflammation. Factor V (F5), a coagulation cofactor associated with several coagulation defects, is located ~37 kilobases (kb) downstream. The Neanderthal haplotype overlaps histone modifications suggestive of gene regulatory activity in blood cells and vein epithelial cells (Fig. S2). Using data from the Genotype-Tissue Expression (GTEx) Project (20), we found indications that the Neanderthal allele at rs3917862 significantly increased the expression of SELP (P = 0.005) and F5 (P = 0.05) in arteries (Figs. 1E; S2). The association may be influenced by the F5 Leiden (F5L) mutation associated with hypercoagulable state; however, the Neanderthal allele appears to have an additional influence on risk (11). The Neanderthal SNP is in low linkage disequilibrium with F5L (LD, r2=0.07, D’=0.42), and increases risk for venous thromboembolism (VTE), beyond the risk associated with F5L (21). Furthermore, manual review of the EHRs for 16 hypercoagulable state cases revealed a diverse set of causes, and only four out of the 11 individuals tested for F5L had the mutation. Due to the direct interaction of coagulation factors with pathogens, these genes have been common targets of positive selection across vertebrate evolution, and F5 has experienced positive selection in primates (22). Thus, it is possible that this Neanderthal haplotype and the associated hypercoagulability provided an advantage in early AMHs outside of Africa.
The second replicating association was a SNP (rs12049593, 5.0% EUR frequency) in an intron of SLC35F3, a putative thiamine transporter that associates with protein-calorie malnutrition. Thiamine is crucial to carbohydrate metabolism for all cells, particularly those with increased energy requirements (23). Variants in high LD with this SNP (r2>0.8, D’=1) are found in regions bearing enhancer histone marks in the gastrointestinal (GI) tract, brain, and other tissues. Decreased expression of this transporter in the brain or GI could exacerbate malnutrition or its symptoms. It is possible that new dietary pressures may have caused changes in carbohydrate metabolism to be beneficial in early human migrants out of Africa; indeed, there is evidence suggesting that Neanderthal introgression likely influenced lipid catabolism in Europeans (9). More recently, the reduction of thiamine present in foods from the grain refining process as well as increased intake of simple carbohydrates, make this a potentially harmful allele, as it could reduce thiamine availability while modern diets increase demand.
Another Neanderthal SNP (rs11030043, 9.0% EUR frequency) is upstream of stromal interaction molecule 1 (STIM1) and is associated with a phenotype encompassing incontinence, bladder pain, and urinary tract disorders (Fig. S4A). STIM1 is a ubiquitously expressed gene involved in intracellular calcium signaling. Variants in high LD with the Neanderthal SNP are found in regions bearing enhancer histone marks and DNase I hypersensitive sites in the brain. Because of this, we examined whether this SNP was associated with gene expression levels in brain tissues in GTEx. The Neanderthal allele is associated with significantly decreased expression of STIM1 in the caudate basal ganglia (P = 0.02; Fig. S4B), a region of the brain connected to bladder dysfunction, particularly in those with neurological conditions such as Parkinson’s (24).
The last replicated association was between rs901033 (0.5% EUR frequency) and tobacco use disorder. This SNP is in an intron of SLC6A11, a solute carrier family neurotransmitter transporter that is responsible for reuptake of the neurotransmitter GABA. Nicotine addiction disrupts GABAergic signaling in the brain and reduces expression of SLC6A11 (25). This is the second Neanderthal SNP to be associated with smoking risk (5).
To test whether Neanderthal SNPs were enriched for association with specific classes of phenotypes, we compared the distribution of replicating phenotype associations for a set of 1,056 LD-pruned (r2 < 0.5) Neanderthal SNPs (Table S5) with the associations found in five allele frequency matched non-Neanderthal SNP sets (consisting of a total of 5,280 SNPs) at a relaxed PheWAS discovery threshold (P < 0.001) (11). Overall, the Neanderthal SNPs appear to influence significantly different classes of phenotypes (chi squared test, P = 0.017; Fig. 2). In particular, Neanderthal SNPs were consistently associated with more neurological and psychiatric phenotypes and fewer digestive phenotypes (Fig. 2) (11).
Fig. 2. Neanderthal SNPs associate with different phenotypes than matched non-Neanderthal SNPs.
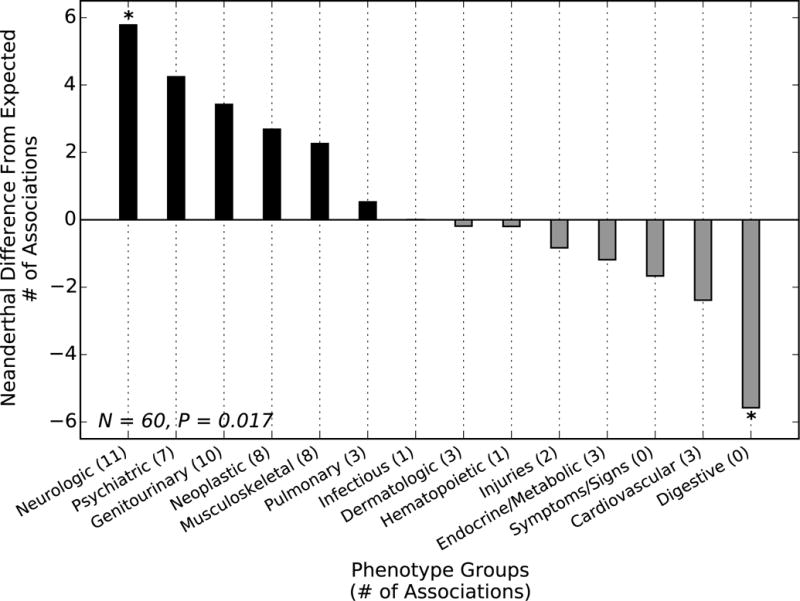
Each bar gives the difference between the number of replicated Neanderthal SNP associations with a phenotype group (at a relaxed discovery threshold of P < 0.001) and the number expected from a PheWAS over five sets of non-Neanderthal sites matched to the allele frequency of tested Neanderthal SNPs. The phenotype distributions were significantly different (chi squared test, P = 0.017), with more Neanderthal SNPs associated with neurological and psychiatric phenotypes than expected and fewer digestive phenotypes. The enrichment and depletion were consistent across all five matched non-Neanderthal sets (* indicates P < 0.05 for all five comparisons; binomial test) (11).
Given the enrichment for associations with psychiatric and neurological phenotypes, we tested whether Neanderthal SNPs were significantly associated with changes in gene expression in previous expression quantitative trait loci (eQTL) analyses of the cerebellum and temporal cortex. Twenty-nine Neanderthal SNPs were significant brain cis-eQTL in the cerebellum or temporal cortex (FDR < 0.05) (11). This represents significant enrichment for brain eQTL among Neanderthal SNPs compared to the non-Neanderthal control SNPs (one-tailed binomial test; P = 1.68E–4 for cerebellum and P = 3.49E–5 for temporal cortex) (11). Taken together, the influence of Neanderthal SNPs on depression risk (Table 1), the association of individual Neanderthal SNPs with diseases with a neurological basis (Table 2), the enrichment for nominal associations with psychiatric and neurological phenotypes (Fig. 2), and the enrichment for brain eQTL in Neanderthal SNPs suggest that Neanderthal introgression influenced AMH brain phenotypes.
Our approach establishes a new paradigm for understanding the phenotypic legacy of admixture between AMHs and archaic hominins. Using a large clinical cohort, we discovered functional associations between Neanderthal alleles and AMH traits, influencing the skin, immune system, depression, addiction, and metabolism. Furthermore, several lines of evidence suggest enrichment for associations between Neanderthal alleles and neurological and psychiatric phenotypes, as well as the importance of differences in sun exposure between high and low latitudes. It is possible that some Neanderthal alleles provided a benefit in early AMH populations as they moved out of Africa, but have become detrimental in modern Western environments.
EHR data, paired with DNA sequencing, hold promise for characterizing the phenotypic impact of regions identified through evolutionary analyses. However, there are currently limitations to this approach. It is difficult to extract non-clinical phenotypes from EHRs, and we were not able to analyze all Neanderthal haplotypes due to the limited coverage of the available genotyping data. Nonetheless, as EHRs are increasingly linked to whole genome sequence data and more sophisticated methods are developed for extracting phenotypes from the rich data stored in EHRs, we anticipate further insights into the functional effects of archaic introgression.
Supplementary Material
Acknowledgments
The data reported in this paper are available in the Supplementary Material and in the Neanderthal PheWAS Catalog (https://phewas.mc.vanderbilt.edu/neanderthal). We thank A. Fish, J. Hall, D. Mortlock, D. Samuels, M. Sivley and P. Wu for helpful discussions. C.N.S. was supported by NIH grant 5T32EY021453 to Vanderbilt University and a pilot project award from the Vanderbilt Center for Quantitative Sciences. The eMERGE Network was initiated and funded by the NHGRI through the following grants: U01HG004438 to Johns Hopkins University; U01HG004610 and U01HG006375 to Group Health Cooperative and University of Washington, Seattle; U01HG004608 and 1K22LM011938 to Marshfield Clinic; U01HG006389 to Essentia Institute of Rural Health; U01HG04599 and U01HG006379 to Mayo Clinic; U01HG004609 and U01HG006388 to Northwestern University; U01HG04603 and U01HG006378 to Vanderbilt University; U01HG006385 to the Coordinating Center; U01HG006382 to Geisinger Clinic; U01HG006380 to Mount Sinai School of Medicine. PheWAS method development was supported by R01LM010685. The authors report no conflicts of interest.
Footnotes
Supplementary Materials:
Materials and Methods
References and Notes
- 1.Higham T, et al. The timing and spatiotemporal patterning of Neanderthal disappearance. Nature. 2014;512:306–309. doi: 10.1038/nature13621. [DOI] [PubMed] [Google Scholar]
- 2.Green RE, et al. A Draft Sequence of the Neandertal Genome. Science. 2010;328:710–722. doi: 10.1126/science.1188021. [DOI] [PMC free article] [PubMed] [Google Scholar]
- 3.Prufer K, et al. The complete genome sequence of a Neanderthal from the Altai Mountains. Nature. 2014;505:43–49. doi: 10.1038/nature12886. [DOI] [PMC free article] [PubMed] [Google Scholar]
- 4.Wall JD, et al. Higher levels of Neanderthal ancestry in East Asians than in Europeans. Genetics. 2013;194:199–209. doi: 10.1534/genetics.112.148213. [DOI] [PMC free article] [PubMed] [Google Scholar]
- 5.Sankararaman S, et al. The genomic landscape of Neanderthal ancestry in present-day humans. Nature. 2014;507:354–357. doi: 10.1038/nature12961. [DOI] [PMC free article] [PubMed] [Google Scholar]
- 6.Vernot B, Akey JM. Resurrecting Surviving Neandertal Lineages from Modern Human Genomes. Science. 2014;343:1017–1021. doi: 10.1126/science.1245938. [DOI] [PubMed] [Google Scholar]
- 7.Abi-Rached L, et al. The Shaping of Modern Human Immune Systems by Multiregional Admixture with Archaic Humans. Science. 2011;334:89–94. doi: 10.1126/science.1209202. [DOI] [PMC free article] [PubMed] [Google Scholar]
- 8.Huerta-Sanchez E, et al. Altitude adaptation in Tibetans caused by introgression of Denisovan-like DNA. Nature. 2014;512:194–197. doi: 10.1038/nature13408. [DOI] [PMC free article] [PubMed] [Google Scholar]
- 9.Khrameeva EE, et al. Neanderthal ancestry drives evolution of lipid catabolism in contemporary Europeans. Nature communications. 2014;5 doi: 10.1038/ncomms4584. [DOI] [PMC free article] [PubMed] [Google Scholar]
- 10.Kho AN, et al. Electronic medical records for genetic research: results of the eMERGE consortium. Science translational medicine. 2011;3:79re71. doi: 10.1126/scitranslmed.3001807. [DOI] [PMC free article] [PubMed] [Google Scholar]
- 11.Please see Supplemental Materials
- 12.Gottesman O, et al. The Electronic Medical Records and Genomics (eMERGE) Network: past, present, and future. Genet Med. 2013;15:761–771. doi: 10.1038/gim.2013.72. [DOI] [PMC free article] [PubMed] [Google Scholar]
- 13.Plagnol V, Wall JD. Possible ancestral structure in human populations. PLoS Genet. 2006;2:e105. doi: 10.1371/journal.pgen.0020105. [DOI] [PMC free article] [PubMed] [Google Scholar]
- 14.Consortium TGP. An integrated map of genetic variation from 1,092 human genomes. Nature. 2012;491:56–65. doi: 10.1038/nature11632. [DOI] [PMC free article] [PubMed] [Google Scholar]
- 15.Yang J, Lee SH, Goddard ME, Visscher PM. GCTA: a tool for genome-wide complex trait analysis. American journal of human genetics. 2011;88:76–82. doi: 10.1016/j.ajhg.2010.11.011. [DOI] [PMC free article] [PubMed] [Google Scholar]
- 16.Gokhman D, et al. Reconstructing the DNA methylation maps of the Neandertal and the Denisovan. Science. 2014;344:523–527. doi: 10.1126/science.1250368. [DOI] [PubMed] [Google Scholar]
- 17.Oksenberg N, Stevison L, Wall JD, Ahituv N. Function and Regulation of <italic>AUTS2</italic>, a Gene Implicated in Autism and Human Evolution. PLoS Genet. 2013;9:e1003221. doi: 10.1371/journal.pgen.1003221. [DOI] [PMC free article] [PubMed] [Google Scholar]
- 18.Golden RN, et al. The Efficacy of Light Therapy in the Treatment of Mood Disorders: A Review and Meta-Analysis of the Evidence. American Journal of Psychiatry. 2005;162:656–662. doi: 10.1176/appi.ajp.162.4.656. [DOI] [PubMed] [Google Scholar]
- 19.Denny JC, et al. Systematic comparison of phenome-wide association study of electronic medical record data and genome-wide association study data. Nature biotechnology. 2013;31:1102–1110. doi: 10.1038/nbt.2749. [DOI] [PMC free article] [PubMed] [Google Scholar]
- 20.Consortium TG. The Genotype-Tissue Expression (GTEx) pilot analysis: Multitissue gene regulation in humans. Science. 2015;348:648–660. doi: 10.1126/science.1262110. [DOI] [PMC free article] [PubMed] [Google Scholar]
- 21.Heit JA, et al. A genome-wide association study of venous thromboembolism identifies risk variants in chromosomes 1q24. 2 and 9q. Journal of Thrombosis and Haemostasis. 2012;10:1521–1531. doi: 10.1111/j.1538-7836.2012.04810.x. [DOI] [PMC free article] [PubMed] [Google Scholar]
- 22.Rallapalli PM, Orengo CA, Studer RA, Perkins SJ. Positive selection during the evolution of the blood coagulation factors in the context of their disease-causing mutations. Molecular biology and evolution. 2014:msu248. doi: 10.1093/molbev/msu248. [DOI] [PMC free article] [PubMed] [Google Scholar]
- 23.Martin PR, Singleton CK, Hiller-Sturmhofel S. The role of thiamine deficiency in alcoholic brain disease. Alcohol Research and Health. 2003;27:134–142. [PMC free article] [PubMed] [Google Scholar]
- 24.Pazo JH, Belforte JE. Basal ganglia and functions of the autonomic nervous system. Cellular and molecular neurobiology. 2002;22:645–654. doi: 10.1023/A:1021844605250. [DOI] [PMC free article] [PubMed] [Google Scholar]
- 25.Pickering C, Bergenheim V, Schiöth HB, Ericson M. Sensitization to nicotine significantly decreases expression of GABA transporter GAT-1 in the medial prefrontal cortex. Progress in Neuro-Psychopharmacology and Biological Psychiatry. 2008;32:1521–1526. doi: 10.1016/j.pnpbp.2008.05.011. [DOI] [PubMed] [Google Scholar]
- 26.O’Connell J, et al. A General Approach for Haplotype Phasing across the Full Spectrum of Relatedness. PLoS Genet. 2014;10:e1004234. doi: 10.1371/journal.pgen.1004234. [DOI] [PMC free article] [PubMed] [Google Scholar]
- 27.Howie BN, Donnelly P, Marchini J. A flexible and accurate genotype imputation method for the next generation of genome-wide association studies. PLoS Genet. 2009;5:e1000529. doi: 10.1371/journal.pgen.1000529. [DOI] [PMC free article] [PubMed] [Google Scholar]
- 28.Price AL, et al. Principal components analysis corrects for stratification in genome-wide association studies. Nat Genet. 2006;38:904–909. doi: 10.1038/ng1847. [DOI] [PubMed] [Google Scholar]
- 29.Crosslin DR, et al. Controlling for population structure and genotyping platform bias in the eMERGE multi-institutional biobank linked to Electronic Health Records. Frontiers in genetics. 2014;5 doi: 10.3389/fgene.2014.00352. [DOI] [PMC free article] [PubMed] [Google Scholar]
- 30.Verma SS, et al. Imputation and quality control steps for combining multiple genome-wide datasets. Frontiers in genetics. 2014;5 doi: 10.3389/fgene.2014.00370. [DOI] [PMC free article] [PubMed] [Google Scholar]
- 31.Carroll RJ, Bastarache L, Denny JC. R PheWAS: data analysis and plotting tools for phenome-wide association studies in the R environment. Bioinformatics. 2014;30:2375–2376. doi: 10.1093/bioinformatics/btu197. [DOI] [PMC free article] [PubMed] [Google Scholar]
- 32.Denny JC, et al. PheWAS: demonstrating the feasibility of a phenome-wide scan to discover gene-disease associations. Bioinformatics. 2010;26:1205–1210. doi: 10.1093/bioinformatics/btq126. [DOI] [PMC free article] [PubMed] [Google Scholar]
- 33.Hebbring SJ, et al. A PheWAS approach in studying HLA-DRB1[ast]1501. Genes Immun. 2013;14:187–191. doi: 10.1038/gene.2013.2. [DOI] [PMC free article] [PubMed] [Google Scholar]
- 34.Ritchie MD, et al. Genome-and phenome-wide analysis of cardiac conduction identifies markers of arrhythmia risk. Circulation. 2013 doi: 10.1161/CIRCULATIONAHA.112.000604. CIRCULATIONAHA. 112.000604. [DOI] [PMC free article] [PubMed] [Google Scholar]
- 35.Yang J, et al. Genome partitioning of genetic variation for complex traits using common SNPs. Nature genetics. 2011;43:519–525. doi: 10.1038/ng.823. [DOI] [PMC free article] [PubMed] [Google Scholar]
- 36.Pratt LA, Brody DJ, Gu Q, National Center for Health Statistics (U.S.) NCHS data brief. U.S. Dept. of Health and Human Services, Centers for Disease Control and Prevention, National Center for Health Statistics; Hyattsville, MD: 2011. Antidepressant use in persons aged 12 and over: United States, 2005–2008; p. 7, 1. [Google Scholar]
- 37.Flohil SC, et al. Prevalence of actinic keratosis and its risk factors in the general population: the Rotterdam Study. The Journal of investigative dermatology. 2013;133:1971–1978. doi: 10.1038/jid.2013.134. [DOI] [PubMed] [Google Scholar]
- 38.Ogden CL, Lamb MM, Carroll MD, Flegal KM. Obesity and socioeconomic status in adults: United States, 2005–2008. NCHS Data Brief. 2010:1–8. [PubMed] [Google Scholar]
- 39.Fryar CD, Hirsch R, Eberhardt MS, Yoon SS, Wright JD. Hypertension, high serum total cholesterol, and diabetes: racial and ethnic prevalence differences in U.S. adults, 1999–2006. NCHS Data Brief. 2010:1–8. [PubMed] [Google Scholar]
- 40.Kessler RC, Chiu WT, Demler O, Merikangas KR, Walters EE. Prevalence, severity, and comorbidity of 12-month DSM-IV disorders in the National Comorbidity Survey Replication. Arch Gen Psychiatry. 2005;62:617–627. doi: 10.1001/archpsyc.62.6.617. [DOI] [PMC free article] [PubMed] [Google Scholar]
- 41.McLean CY, et al. GREAT improves functional interpretation of cis-regulatory regions. Nature biotechnology. 2010;28:495–501. doi: 10.1038/nbt.1630. [DOI] [PMC free article] [PubMed] [Google Scholar]
- 42.Heller R, Bogomolov M, Benjamini Y. Deciding whether follow-up studies have replicated findings in a preliminary large-scale omics study. Proceedings of the National Academy of Sciences. 2014;111:16262–16267. doi: 10.1073/pnas.1314814111. [DOI] [PMC free article] [PubMed] [Google Scholar]
- 43.Hadley G, Derry S, Moore RA. Imiquimod for Actinic Keratosis: Systematic Review and Meta-Analysis. J Invest Dermatol. 2006;126:1251–1255. doi: 10.1038/sj.jid.5700264. [DOI] [PubMed] [Google Scholar]
- 44.Zou F, et al. Brain expression genome-wide association study (eGWAS) identifies human disease-associated variants. doi: 10.1371/journal.pgen.1002707. [DOI] [PMC free article] [PubMed] [Google Scholar]
- 45.Gamazon ER, et al. SCAN: SNP and copy number annotation. Bioinformatics. 2010;26:259–262. doi: 10.1093/bioinformatics/btp644. [DOI] [PMC free article] [PubMed] [Google Scholar]
- 46.Storey JD, Tibshirani R. Statistical significance for genomewide studies. Proceedings of the National Academy of Sciences. 2003;100:9440–9445. doi: 10.1073/pnas.1530509100. [DOI] [PMC free article] [PubMed] [Google Scholar]
- 47.Chen C, et al. Two gene co-expression modules differentiate psychotics and controls. Molecular psychiatry. 2013;18:1308–1314. doi: 10.1038/mp.2012.146. [DOI] [PMC free article] [PubMed] [Google Scholar]
- 48.Gachet C. Regulation of platelet functions by P2 receptors. Annu Rev Pharmacol Toxicol. 2006;46:277–300. doi: 10.1146/annurev.pharmtox.46.120604.141207. [DOI] [PubMed] [Google Scholar]
- 49.Kujovich JL. Factor V Leiden thrombophilia. Genet Med. 2011;13:1–16. doi: 10.1097/GIM.0b013e3181faa0f2. [DOI] [PubMed] [Google Scholar]
- 50.Heit JA, et al. Genetic variation within the anticoagulant, procoagulant, fibrinolytic and innate immunity pathways as risk factors for venous thromboembolism. Journal of thrombosis and haemostasis. 2011;9:1133–1142. doi: 10.1111/j.1538-7836.2011.04272.x. [DOI] [PMC free article] [PubMed] [Google Scholar]
- 51.Purcell S, Cherny SS, Sham PC. Genetic Power Calculator: design of linkage and association genetic mapping studies of complex traits. Bioinformatics. 2003;19:149–150. doi: 10.1093/bioinformatics/19.1.149. [DOI] [PubMed] [Google Scholar]
Associated Data
This section collects any data citations, data availability statements, or supplementary materials included in this article.