Abstract
Background/Aims
Previous studies have revealed that mast cells (MCs) may activate the protease-activated receptors and release of neuropeptides involved in the pathogenesis of irritable bowel syndrome (IBS). The levels of protease-activated receptor 2 (PAR-2) and tryptase can contribute to understanding the pathogenesis of IBS.
Methods
Colonoscopic biopsies were performed of 38 subjects (20 with IBS-diarrhea [IBS-D], eight with IBS-constipation [IBS-C], and 10 healthy volunteers). The mRNA and protein levels of tryptase and PAR-2 were assessed by real-time PCR and Western blot. The levels of vasoactive intestinal peptide (VIP), substance P (SP), and calcitonin gene-related peptide (CGRP) were measured by immunohistochemistry, and MCs were counted by toluidine blue staining.
Results
Significant increases in the mRNA expression of tryptase (p<0.05, IBS-D, IBS-C vs control) and PAR-2 (p<0.05, IBS-D, IBS-C vs control) and in the tryptase protein level (p<0.05, IBS-D, IBS-C vs control) were detected in IBS. Elevations of MCs, CGRP, VIP and SP (p<0.05, IBS-D vs control) were observed for IBS-D only.
Conclusions
Tryptase levels may upregulate the function of PAR-2, resulting in the release of neuropeptide and they were correlated with clinical symptoms associated with IBS.
Keywords: Irritable bowel syndrome, Inflammation, PAR-2, Tryptases
INTRODUCTION
Irritable bowel syndrome (IBS) is a multifactorial disease and the mechanisms associated with the onset and progression of IBS still remain unclear. It is generally considered that altered motility of gastrointestinal cells, neural immune endocrine balance, inflammatory response and visceral hypersensitivity are involved in pathophysiology of IBS.
Elevation of mast cell has been observed in IBS patients as well as animal models of the disease.1 Vivinus-Nébot et al.2 have reported an elevation of mast cells in the mucosa of IBS patients and have found a correlation of increased mast cells with altered mucosal permeability. Degranulation of mast cells releases tryptase,3 which is suggested to generate low grade inflammation, visceral hypersensitivity and high permeability4 in IBS. Mast cell tryptase is proposed to activate proinflammatory pathways and influences neuronal signaling by activation of protease-activated receptor 2 (PAR-2).5
PAR-2 belongs to a family of four G protein-coupled receptors which are activated by trypsin, mast cell tryptase, coagulation factors VIIa and Xa, and so forth.6 Previous studies have shown that PAR-2 is linked to visceral pain in the colon and results in an increased recruitment of inflammatory cells.7 Some studies have reported that tryptase can result in hypersensitivity symptoms via activation of PAR-2,8 present on epithelial cells, immune cells, and the terminal afferent nerves.9 However, Fiorucci et al.10 have reported that the activation of PAR-2 has a protective effect against the development of colitis. Activation of PAR-2 produces an inflammatory response and hypersensitivity reaction11 by a neurogenic mechanism involving afferent neurons and release of the calcitonin gene-related peptide (CGRP) and substance P (SP).12 CGRP, SP and vasoactive intestinal peptide (VIP) are neuropeptides present in the central nervous system and the gastrointestinal system and play an important role in the regulation of visceral sensation and gastrointestinal motility. Numerous reports now indicate alterations of neuropeptide in the IBS. However, most investigations demonstrating an association between PAR-2 and IBS are limited to investigations in animal models.8,13,14
Few studies have reported the correlation between tryptase, PAR-2, neuropeptides and clinical symptoms; while several studies on the expression levels of tryptase and PAR-2 report contradictory results. Moreover, there are more studies focusing on IBS-diarrhea (IBS-D) subtype when compared to the IBS-constipation (IBS-C) subtype.
In this study, we investigate the mRNA and protein level expression of mast cell tryptase, PAR-2 and neuropeptides in the colon of IBS patients and their correlation with clinical symptoms of IBS patients.
MATERIALS AND METHODS
1. Subjects
Biopsy specimens of the ascending colon were drawn from colonoscopies of 20 patients with IBS-D, eight patients with IBS-C, and 10 healthy controls at the Guangxi Zhuang Autonomous Region People’s Hospital from May 1, 2012 to November 29, 2012. All the IBS patients exhibited symptoms that meet the Rome-III criteria (Table 1). Subjects in the control group had no gastrointestinal symptoms, and no history of chronic medical disease. None of the IBS patients had asthma and other allergic diseases, history of abdominal surgery, inflammatory bowel disease, or postinfectious IBS. Informed consent was signed by all patients, and this study was approved by the hospital’s local ethics committee.
Table 1.
Clinical Characteristic of Irritable Bowel Syndrome Patients and Control Subjects
| Characteristic | Control (n=10) | IBS-D (n=20) | IBS-C (n=8) |
|---|---|---|---|
| Age, mean (range), yr | 45.9 (30–63) | 41.8 (24–64) | 34.1 (24–54) |
| Sex, female/male | 5/5 | 13/7 | 6/2 |
| Abdominal discomfort | 0 | 4.15±0.76 | 4.38±0.64 |
| Bloating | 0 | 3.15±1.71 | 4.19±1.53 |
| Altering diarrhea/constipation | 0 | 0 | 0 |
| History of infection | 0 | 0 | 0 |
IBS-D, irritable bowel syndrome-diarrhea; IBS-C, irritable bowel syndrome-constipation.
2. Reagents
Trizol and cDNA reverse transcription kit was from Roche (Roche, Mannheim, Germany). Polymerase chain reaction (PCR) primers were synthesized by Sangon Biotechnology (Shanghai, China). SuperReal PreMix Plus was purchased from Tiangen Biotechnology (Beijing, China). Rabbit anti-GAPDH and anti-PAR-2 polyclonal antibody for Western blot were from Cell Signaling Technology (Danvers, MA, USA). Antitryptase polyclonal antibody for Western blot was purchased from Santa Cruz Biotechnology (Santa Cruz, CA, USA). All horseradish peroxidase-conjugated secondary antibodies were from Beyond Time (Beijing, China). Anti-SP, anti-CGRP, and anti-VIP antibody for immunohistochemistry was from Bioss Biotechnology (Beijing, China). SP-9000/9001/9002Histostain-Plus Kits was from ZSGB Biotechnology (Beijing, China). Toluidine blue dye was purchased from Solarbio Biotechnology (Beijing, China).
3. Staining process of H&E and toluidine blue method
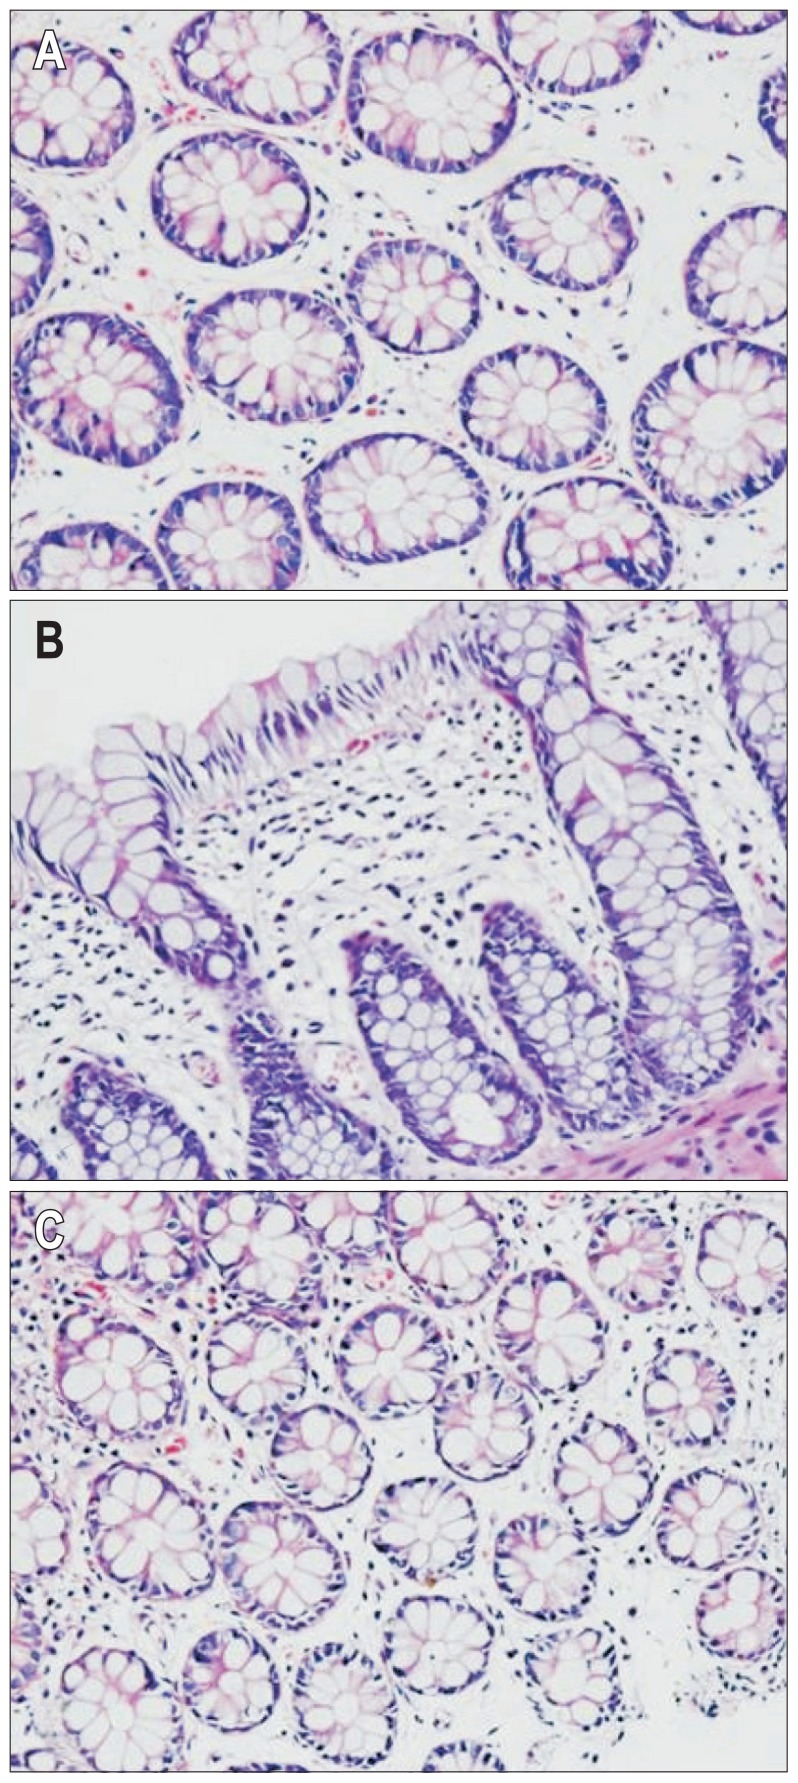
Tissues were treated with a series of fixation, dehydration, embedding, and staining. Samples were deparaffinized in xylene, hematoxylin and eosin staining, dehydrated in 95%, 90%, 80% ethanol, cleared in xylene, checked under microscope to observe morphological change of human colonic membrane (Fig. 1). Sample was selected in the descending colon and cleaned with normal saline, fixed with 10% in formalin, dehydrated, paraffin embedded, continuously slided, toluidine blue method stained, deparaffinized and rehydrated, dipped in toluidine blue for 30 minutes, 2 to 3 drops of glacial acetic acid, until the nucleus and granulation were pretty clear, dried with cold air, cleared in xylene mounted in checked under microscope, randomly selected three high-power fields (×200) and counted the number of cells, expressing mast cell counts.
Fig. 1.
H&E staining showed a normal structure of the intestinal mucosa; inflammatory cells were observed in the irritable bowel syndrome-diarrhea (IBS-D), irritable bowel syndrome-constipation (IBS-C), and normal groups. (A) Control subjects (×200); (B) IBS-D patients (×200); (C) IBS-C patients (×200).
4. Real-time polymerase chain reaction
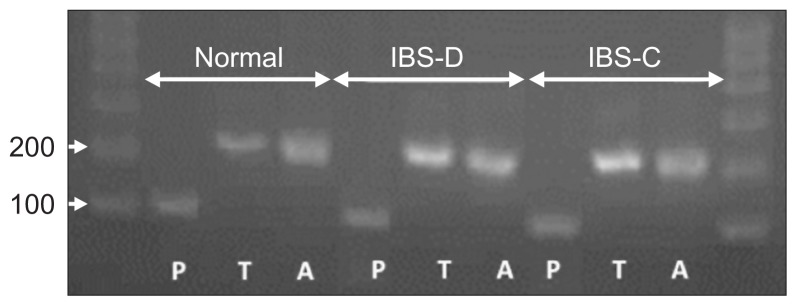
Tissue expression of tryptase and PAR-2 mRNA was assessed by quantitative real-time PCR (RT-PCR). After thawing, tissue was homogenized in Trizol (800 μL added to 5 mg tissue). Total RNA was extracted, and reversed by using reverse transcription kit after measuring concentration of total RNA with Nano drop. Total RNA is quantitatived to 1 μg. The information of primers of tryptase, PAR-2 and actin is listed as Table 2. The PCR reactions were set up in a volume of 20 μL, containing 2 μL of the cDNA diluted 1:5 with PCR grade water, 10.4 μL of SYBR Green Supermix, and 300 nmol/L of the forward and reverse primer each. The PCR conditions consisted of preliminary denaturation at 95°C for 15 minutes, followed by 50 cycles of 95°C for 10 seconds, 60°C for 32 seconds. Melting curve analysis was performed to confirm the specificity as well as the integrity of the PCR products by the presence of a single peak. Products were subjected to agarose gel electrophoresis (Fig. 2). Expression levels of the mRNA were quantified by calculating threshold cycle values compare with the β-actin endogenous control using 2-DDCt.
Table 2.
Primers for Real-Time Polymerase Chain Reaction
| Gene | Forward primer/reverse primer | PCR product, bp | Gene bank no. |
|---|---|---|---|
| Actin | TgACgTggACATCCgCAAAg/CTggAAggTggACAgCgAgg | 205 | NM_001101.3 |
| Tryptase | ATCgTgCACCCACAgTTCTAC/CTTCACCTgCTTCAgAggAAAT | 216 | NM_024164.5 |
| PAR-2 | CCCTgAACATCACgACCTg/AggCTgggAACAgAAAgACC | 108 | NM_005242.4 |
PCR, polymerase chain reaction; PAR-2, protease-activated receptor 2.
Fig. 2.
Polymerase chain reaction (PCR) products were subjected to agarose gel electrophoresis. All the real-time-PCR products from the three groups migrated as expected (A: actin, 206 bp; T: tryptase, 216 bp; P: protease-activated receptor 2, 108 bp).
IBS-D, irritable bowel syndrome-diarrhea; IBS-C, irritable bowel syndrome-constipation.
5. Western blot
Total protein was extracted from colon musocal tissues and lysed in RIPA lysate (50 mM Tris [pH 7.4], 150 mM NaCl, 5 mM EDTA, 1% Triton X-100 [v/v], 1× protease inhibitor cocktail, 1 mM sodium vanadate, and 10 mM NaF). Equal amount of total protein were separated by SDS-PAGE with 12% resolving layer and 4% stacking layer and then transferred to PVDF membranes with 200 mmA for 1 hour. After blocked in 5% notfat milk diluted with TBS-T for 1 hour in room temperature with shaking, membranes were incubated with primary antibodies (working dilution tryptase 1:3,000; PAR-2 1:100) with gentle shaking overnight at 4°C, washed with Tris-buffered saline and then incubated with species-appropriate secondary antibodies for 90 minutes at 37°C. After washing in TBS-T, membranes were incubated with ECL Developer Kit in dark room. The efficiency of protein loading and transfer was assessed by reprobing membranes with an anti-GAPDH antibody. Density of each band was analysis using Image J (http://rsb.info.nih.gov/ij/). Expression of the target protein band was compared with the corresponding control band and the overall trend in protein expression.
6. Immunohistochemistry
Colonoscopy was done using a standard bowel preparation and all colonic biopsy samples from 28 IBS patients and five control subjects were taken from the descending colon. One tissue sample (3 to 5 mg) from each patient and control subject was immediately fixed in buffered 10% formalin and processed for immunohistochemistry. For immunohistochemistry, paraffin-embedded specimens were cut with a microtome at 4 μm. The process ran as follows. Briefly, sections antigen retrieval were performed by boiling in sodium citrate buffer solution for 2 minutes and 30 seconds, and nonspecific antigens were blocked for 15 minutes with normal goat serum fluid. Slides were incubated overnight at 4°C with primary antibodies (working dilution anti-SP, 1:300; anti-CGRP, 1:300; anti-VIP, 1:400). Then the peroxidase-conjugated secondary antibodies was added to slides for 30 minutes at 37°C after washing in PBS and then staining with the DAB kits. The negative control was incubated with blocking buffer alone without primary antibody. Photographs were taken on an Olympus microscope at 200× magnification. The difference in the protein expression was evaluated by the Image-pro Plus 6.0 image analysis software (http://www.mediacy.com/index.aspx?page=IPP).
7. Statistical analysis
Experimental data is represented as mean±standard deviation. One-way analysis of variance was used for analysis. Nonparametric test (Kruskal-Wallis H test) was used for the analysis of nonnormal distribution data. Spearman analysis was used for correlation analysis. A p<0.05 was considered statistically significant. SPSS version 17.0 (SPSS Inc., Chicago, IL, USA) was used for data analysis.
RESULTS
1. Elevated mRNA levels of tryptase and PAR-2
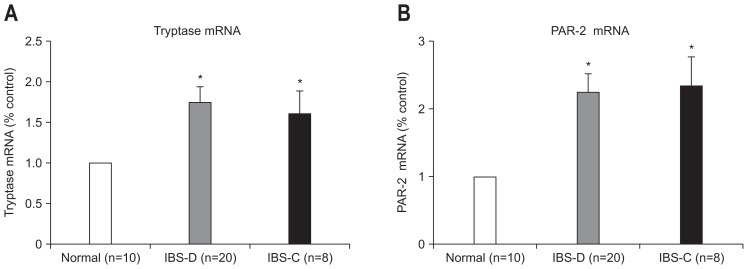
mRNA levels of tryptase (p=0.002, IBS-D vs control; p=0.000, IBS-C vs control) and PAR-2 (p=0.007, IBS-D vs control; p=0.000, IBS-C vs control) were higher in IBS patient group in comparison to the healthy controls (Fig. 3). However, no significant difference was observed between IBS-D and IBS-C patients.
Fig. 3.
Quantification of tryptase and protease-activated receptor 2 (PAR-2) mRNA after normalization to the housekeeping gene β-actin. (A) Tryptase mRNA; (B) PAR-2 mRNA. Significant elevation of tryptase and PAR-2 expression was observed in irritable bowel syndrome patients compared with the control group, but no difference was observed in subtypes. The fold change in mRNA expression was calculated relative to the endogenous β-actin control using 2−ΔΔCt. The data are expressed as the mean±SEM.
IBS-D, irritable bowel syndrome-diarrhea; IBS-C, irritable bowel syndrome-constipation. *p<0.05 compared with control subjects.
2. Different expression of tryptase and PAR-2
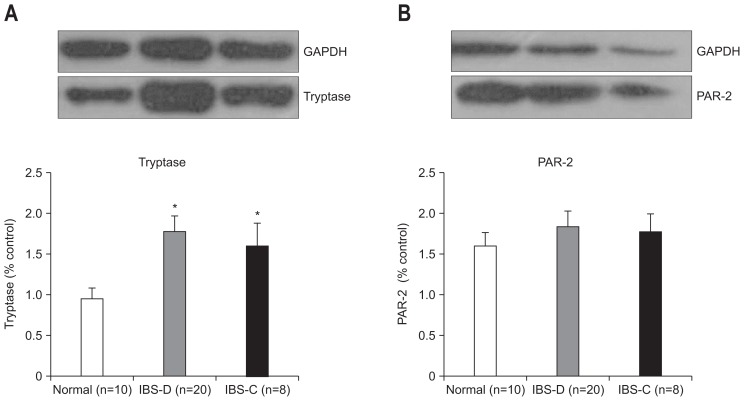
Elevated expression of tryptase was found in IBS group (p=0.002, IBS-D vs control; p=0.041, IBS-C vs control) (Fig. 4). There was no significant difference in the protein levels of PAR-2 between IBS and controls. No difference was detected in IBS-D when compared to the levels in IBS-C group.
Fig. 4.
The expression of tryptase and protease-activated receptor 2 (PAR-2) in the colon mucosa. The expression results were compared with healthy controls. The density of each individual band was compared with the corresponding control band and normalized to the GAPDH gene. (A) The level of tryptase increased in the irritable bowel syndrome (IBS) group, but no significant difference was observed in subtypes of IBS. (B) There was no difference in the expression levels of PAR-2 between IBS patients and the control group.
IBS-D, irritable bowel syndrome-diarrhea; IBS-C, irritable bowel syndrome-constipation. *p<0.05 compared with control group.
3. Elevation of mast cells, CGRP, VIP, and SP in IBS-D
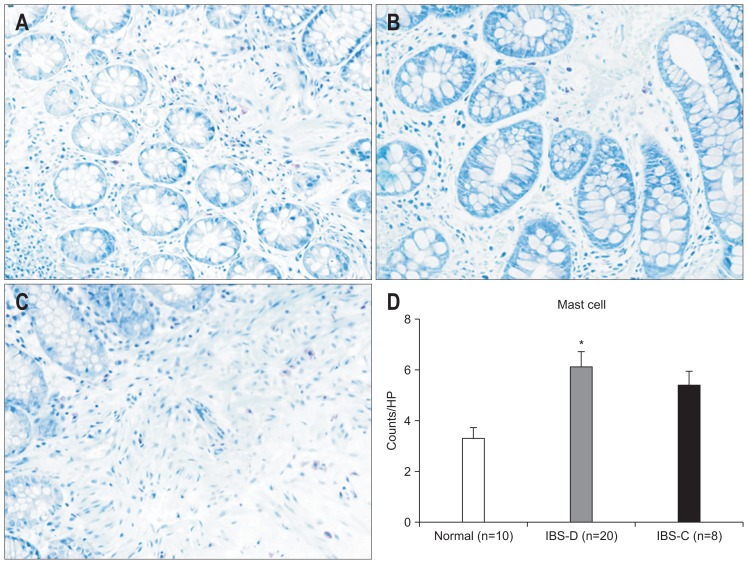
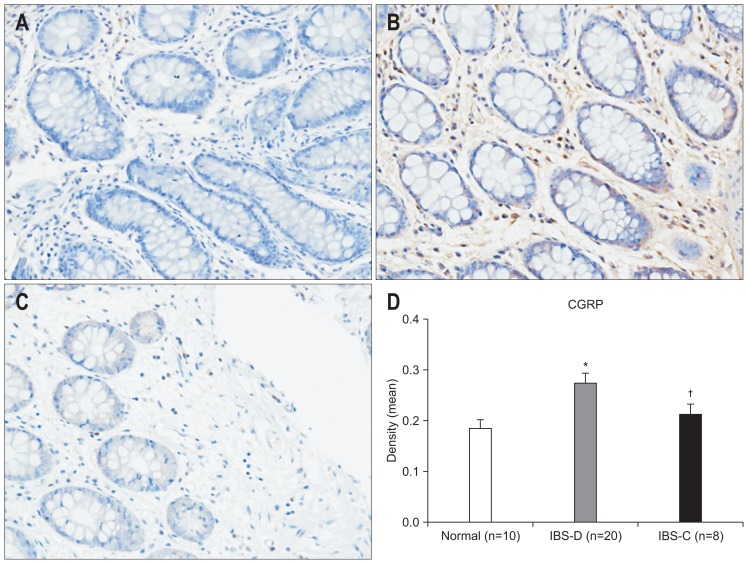
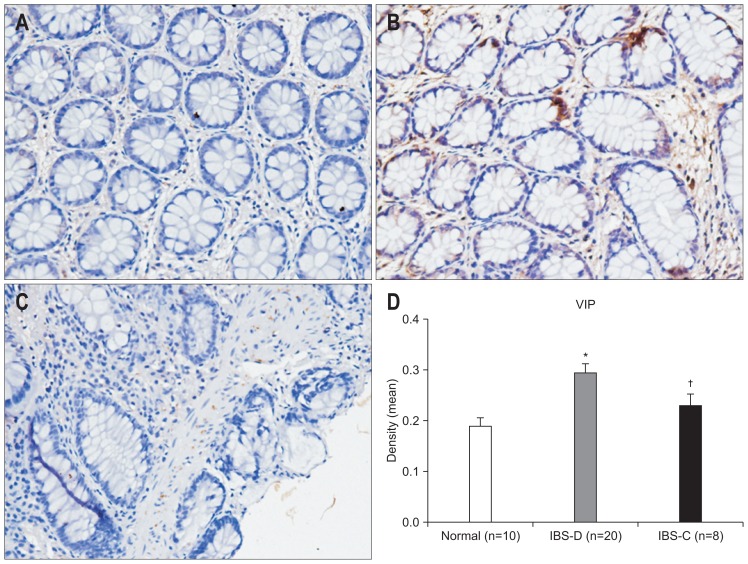
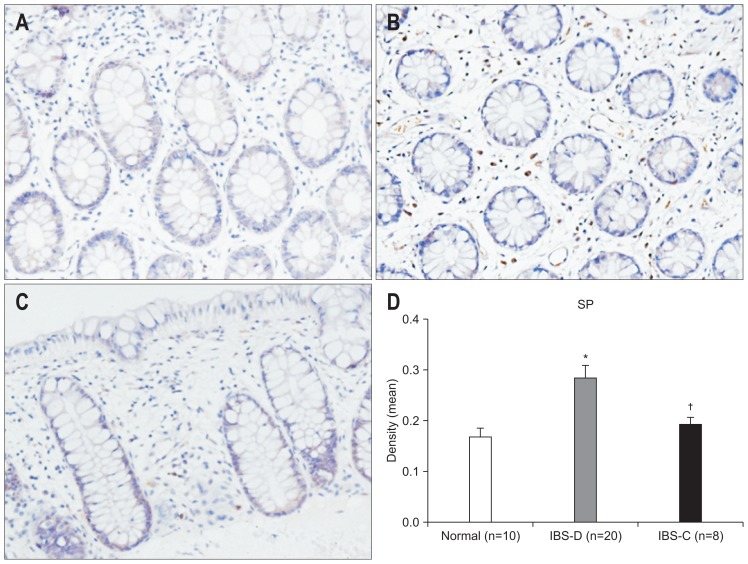
We found markedly different levels of neuropeptide between subgroups of IBS patients. Elevation of mast cells, CGRP, VIP, and SP were observed in IBS-D only (p=0.014, p=0.021, p=0.005, p=0.021 vs control) (Figs 5–8).
Fig. 5.
The number of mast cells in the colon was detected by the toluidine blue method (×200). (A) Control subjects; (B) irritable bowel syndrome-diarrhea (IBS-D) patients; (C) irritable bowel syndrome-constipation (IBS-C) patients. (D) Evaluation of the density (mean) showed an elevation of mast cell numbers in IBS-D patients compared to control patients, and IBS-D patients showed an increased level of tryptase compared to IBS-C patients. *p<0.05 compared with control subjects.
Fig. 6.
The expression of calcitonin gene-related peptide (CGRP) in the colon as evaluated by immunohistochemistry (×200). (A) Control subjects; (B) irritable bowel syndrome-diarrhea (IBS-D) patients; (C) irritable bowel syndrome-constipation (IBS-C) patients. (D) An increase of CGRP was observed in the IBS-D group compared to the control group, and there was a significant difference between the IBS-D and IBS-C groups. *p<0.05 compared with control subjects; †p<0.05 compared with IBS-C subjects.
Fig. 7.
The expression of vasoactive intestinal peptide (VIP) in the colon as evaluated by immunohistochemistry (×200). (A) Control subjects; (B) irritable bowel syndrome-diarrhea (IBS-D) patients; (C) irritable bowel syndrome-constipation (IBS-C) patients. (D) An increase in VIP was found in IBS-D patients compared to control subjects, and there was a significant difference between the IBS-D and IBS-C groups. *p<0.05 compared with control subjects; †p<0.05 compared with IBS-C patients.
Fig. 8.
The expression of substance P (SP) in the colon as evaluated by immunohistochemistry (×200). (A) Control subjects; (B) irritable bowel syndrome-diarrhea (IBS-D) patients; (C) irritable bowel syndrome-constipation (IBS-C) patients. (D) An increase in SP was found in IBS-D patients compared to control subjects, and there was a significant difference between the IBS-D and IBS-C groups. *p<0.05 compared with control subjects; †p<0.05 compared with IBS-C subjects.
4. Correlation analysis
The scoring criteria for abdominal pain is as follows: 1 (mild) slight abdominal pain, does not affect daily activities, 2 (moderate) moderate abdominal pain, not easy to ignore, need to adjust daily activities, 3 (severe) severe abdominal pain, daily activities affected and need to be adjusted. Severity of abdominal bloating was scored using a 1–3 scale (1: Mild; occasional bloating, about half an hour to ease, 2: Moderate; frequent bloating for 1–2 hours cannot be relieved, 3: Severe; bloating persists for more than 2 hours and cannot be relieved except after taking medication). A correlation between mast cell number, tryptase, PAR-2, VIP, SP and CGRP and symptoms associated with IBS was detected. The presence of mast cells and the expression of tryptase, VIP and SP were associated with abdominal pain. A correlation between mast cell number and abdominal bloating was also found (Table 3).
Table 3.
Relationship between Tryptase/Protease-Activated Receptor 2 and Abdominal Pain and Bloating
| Abdominal pain | Abdominal bloating | |
|---|---|---|
| Mast cell | r=0.391* | r=0.405* |
| Tryptase | r=0.498* | r=−0.073 |
| PAR-2 | r=0.123 | r=0.120 |
| VIP | r=0.399* | r=−0.148 |
| SP | r=−0.445* | r=−0.037 |
| CGRP | r=0.119 | r=−0.188 |
PAR-2, protease-activated receptor 2; r, correlation coefficient; VIP, vasoactive intestinal peptide; SP, substance P; CGRP, calcitonin gene-related peptide.
p<0.05.
DISCUSSION
Our study demonstrates an elevated expression of mast cell tryptase in IBS patients when compared with the control group. We also observed increased mRNA levels of PAR-2, as seen from the RT-PCR analysis. Up regulation of CGRP, SP, VIP was detected in IBS-D. No significant difference was found in the protein levels of PAR-2 between IBS patients and control subjects. We found a positive correlation between the levels of mast cell tryptase, PAR-2, neuropeptides and symptoms of IBS such as abdominal pain and bloating.
Previous studies have shown that mast cells and tryptase play an important role in IBS. Some studies have revealed an elevation of mast cell and tryptase, which are consistent with the findings of our study. However, some experiments show an increased level of mast cell tryptase in IBS-D and not in IBS-C, which may be attributed to the differences in experimental methods as well as sample size. Barbara et al.15 revealed that colonic mast cells in proximity to mucosal nerves may contribute to abdominal pain in IBS. PAR-2 is ubiquitously expressed on gastrointestinal mucosal cells, smooth muscle cells and neurons. It has been shown in previous studies that activation of PAR-2 induces a wide range of processes such as triggering intestinal secretion, modulating gatrointestinal motility,16,17 participating in colonic inflammatory reactions, visceral hypersensitivity,18 and high paracellular permeability. Other studies indicate contrasting results regarding the expression of PAR-2 in IBS. Lee et al.19 found no differences in the mRNA expression levels of PAR-2 in IBS-D when compared to healthy controls. Kim et al.20 have reported that PAR-2-positive cells numbers were significantly higher stressed rats when compared to nonstressed rats (where stress was used to mimic visceral hypersensitivity and intestinal permeability related to IBS). The results above focus on the expression of PAR-2 in IBS-D. We were not able to find difference in protein expression levels of PAR-2, which is consistent with the results of Bian et al.21 There is a possibility that PAR-2 contributes to the development of IBS upon its activation, rather than the level of mRNA or protein expression. This may explain no significant increase in the expression levels of PAR-2.
PAR-2 may perform different functions between IBS-D and IBS-C, resulting in different clinical symptoms. Tryptase activated PAR-2-positive neurons release neuropeptides, such as CGRP, SP, and VIP, which further play an important role in regulating intestinal motility. The enteric nerve interacts with intestinal mast cells by neuropeptides such as SP, VIP, and CGRP. Furthermore, enteric nerves are activated by mast cell mediators, interacting with intestinal epithelial cells, vascular cells and multiple inflammatory and immune cells. Hence, neuropeptide is thought to regulate gut motility and secretion and modulate visceral pain. An elevation of CGRP, SP, and VIP was detected in IBS-D compared with control. The mechanism of the involvement of neuropeptides in the pathological process of IBS has not yet been elucidated. The neuropeptide receptor subtypes perform different functions and are differentially distributed in the gut. In summary, our data indicates that mast cell tryptase might be responsible for the activation of PAR-2 and once activated, PAR-2 regulates neuropeptide secretion which is responsible for symptoms associated with IBS. The expression of mast cell tryptase, SP, and VIP in the intestinal mucosa is positively correlated with abdominal pain in patients with IBS. There is a correlation between mast cells and the expression of tryptase, SP and VIP.
Interestingly, there’s a discrepancy between protein and mRNA levels of PAR-2, in contrast to those of tryptase levels. The absence of mRNA–protein correlation for a subset of investigated genes suggests that the relationship between mRNA and protein content is not strictly linear. Different regulatory mechanisms (such as synthesis and degradation rates), acting on both the synthesized mRNA and the synthesized protein can affect the expression levels of the two molecules differentially. Further research investigating the biosynthesis and degradation of mRNA and protein levels of PAR-2 and tryptase may unravel the reasons for the discrepancies observed.
One of the limitations of the current study is the small sample size of patients. And our study focused on only part of colon. RT-PCR, Western blot, and immunohistochemistry were used to detect expression of tryptase, PAR-2 and some neuropeptides. RT-PCR is a very sensitive technique that can detect low copy numbers of RNA by exponential amplification. Western blotting has high sensitivity of detecting protein. Immunohistochemistry help to reveal the location of protein in tissue. These methods are used widely in previous studies of tryptase, PAR-2, and neuropeptides.
Our work evidences that mast cells are up regulated in IBS and mast cell tryptase may activate PAR-2, which regulates the expression of neuropeptides, resulting in symptoms associated with IBD. Thus, we could conclude that increased activation of PAR-2 rather than the increased expression levels may be responsible for symptoms of IBS. Further studies investigating the mechanisms regulating PAR-2 activation will help shed light on the signaling mechanisms associated with the development of IBS and at the same time, targeting the mast cell-PAR-2 signaling might help in developing therapeutic measures against IBS.
ACKNOWLEDGEMENTS
The authors thank Dr. Wei Jiao, Dr. Fei Liu, Dr. Jiao Lan and Rui-Ping Xiao from Scientific Research Center of the People’s Hospital of Guangxi Zhuang Autonomous Region for their valuable technological assistance on our project.
This work was supported by grants from the National Natural Science Foundation of China (number: 81160053 to F.C.Z.) the URL of website is http://isisn.nsfc.gov.cn/egrantindex/funcindex/prjsearch-list. The funders had no role in study design, data collection and analysis, decision to publish, or preparation of the manuscript.
Footnotes
See editorial on page 325.
CONFLICTS OF INTEREST
No potential conflict of interest relevant to this article was reported.
REFERENCES
- 1.Martínez C, Lobo B, Pigrau M, et al. Diarrhoea-predominant irritable bowel syndrome: an organic disorder with structural abnormalities in the jejunal epithelial barrier. Gut. 2013;62:1160–1168. doi: 10.1136/gutjnl-2012-302093. [DOI] [PubMed] [Google Scholar]
- 2.Vivinus-Nébot M, Dainese R, Anty R, et al. Combination of allergic factors can worsen diarrheic irritable bowel syndrome: role of barrier defects and mast cells. Am J Gastroenterol. 2012;107:75–81. doi: 10.1038/ajg.2011.315. [DOI] [PubMed] [Google Scholar]
- 3.Miller HR, Pemberton AD. Tissue-specific expression of mast cell granule serine proteinases and their role in inflammation in the lung and gut. Immunology. 2002;105:375–390. doi: 10.1046/j.1365-2567.2002.01375.x. [DOI] [PMC free article] [PubMed] [Google Scholar]
- 4.Wilcz-Villega EM, McClean S, O’Sullivan MA. Mast cell tryptase reduces junctional adhesion molecule-A (JAM-A) expression in intestinal epithelial cells: implications for the mechanisms of barrier dysfunction in irritable bowel syndrome. Am J Gastroenterol. 2013;108:1140–1151. doi: 10.1038/ajg.2013.92. [DOI] [PubMed] [Google Scholar]
- 5.Cenac N, Andrews CN, Holzhausen M, et al. Role for protease activity in visceral pain in irritable bowel syndrome. J Clin Invest. 2007;117:636–647. doi: 10.1172/JCI29255. [DOI] [PMC free article] [PubMed] [Google Scholar]
- 6.Oikonomopoulou K, Hansen KK, Saifeddine M, et al. Kallikrein-mediated cell signalling: targeting proteinase-activated receptors (PARs) Biol Chem. 2006;387:817–824. doi: 10.1515/BC.2006.104. [DOI] [PubMed] [Google Scholar]
- 7.Cenac N, Coelho AM, Nguyen C, et al. Induction of intestinal inflammation in mouse by activation of proteinase-activated receptor-2. Am J Pathol. 2002;161:1903–1915. doi: 10.1016/S0002-9440(10)64466-5. [DOI] [PMC free article] [PubMed] [Google Scholar]
- 8.Reed DE, Barajas-Lopez C, Cottrell G, et al. Mast cell tryptase and proteinase-activated receptor 2 induce hyperexcitability of guinea-pig submucosal neurons. J Physiol. 2003;547(Pt 2):531–542. doi: 10.1113/jphysiol.2002.032011. [DOI] [PMC free article] [PubMed] [Google Scholar]
- 9.Jacob C, Yang PC, Darmoul D, et al. Mast cell tryptase controls paracellular permeability of the intestine: role of protease-activated receptor 2 and beta-arrestins. J Biol Chem. 2005;280:31936–31948. doi: 10.1074/jbc.M506338200. [DOI] [PubMed] [Google Scholar]
- 10.Fiorucci S, Mencarelli A, Palazzetti B, et al. Proteinase-activated receptor 2 is an anti-inflammatory signal for colonic lamina propria lymphocytes in a mouse model of colitis. Proc Natl Acad Sci U S A. 2001;98:13936–13941. doi: 10.1073/pnas.241377298. [DOI] [PMC free article] [PubMed] [Google Scholar]
- 11.Demir IE, Schäfer KH, Tieftrunk E, Friess H, Ceyhan GO. Neural plasticity in the gastrointestinal tract: chronic inflammation, neurotrophic signals, and hypersensitivity. Acta Neuropathol. 2013;125:491–509. doi: 10.1007/s00401-013-1099-4. [DOI] [PubMed] [Google Scholar]
- 12.Steinhoff M, Vergnolle N, Young SH, et al. Agonists of proteinase-activated receptor 2 induce inflammation by a neurogenic mechanism. Nat Med. 2000;6:151–158. doi: 10.1038/72247. [DOI] [PubMed] [Google Scholar]
- 13.Nozdrachev AD, Akoev GN, Filippova LV, Sherman NO, Lioudyno MI, Makarov FN. Changes in afferent impulse activity of small intestine mesenteric nerves in response to antigen challenge. Neuroscience. 1999;94:1339–1342. doi: 10.1016/S0306-4522(99)00377-2. [DOI] [PubMed] [Google Scholar]
- 14.Bueno L, Fioramonti J, Delvaux M, Frexinos J. Mediators and pharmacology of visceral sensitivity: from basic to clinical investigations. Gastroenterology. 1997;112:1714–1743. doi: 10.1016/S0016-5085(97)70056-8. [DOI] [PubMed] [Google Scholar]
- 15.Barbara G, Stanghellini V, De Giorgio R, et al. Activated mast cells in proximity to colonic nerves correlate with abdominal pain in irritable bowel syndrome. Gastroenterology. 2004;126:693–702. doi: 10.1053/j.gastro.2003.11.055. [DOI] [PubMed] [Google Scholar]
- 16.Corvera CU, Déry O, McConalogue K, et al. Mast cell tryptase regulates rat colonic myocytes through proteinase-activated receptor 2. J Clin Invest. 1997;100:1383–1393. doi: 10.1172/JCI119658. [DOI] [PMC free article] [PubMed] [Google Scholar]
- 17.Duerksen DR, Wilhelm-Boyles C, Parry DM. Intestinal permeability in long-term follow-up of patients with celiac disease on a gluten-free diet. Dig Dis Sci. 2005;50:785–790. doi: 10.1007/s10620-005-2574-0. [DOI] [PubMed] [Google Scholar]
- 18.Coelho AM, Vergnolle N, Guiard B, Fioramonti J, Bueno L. Proteinases and proteinase-activated receptor 2: a possible role to promote visceral hyperalgesia in rats. Gastroenterology. 2002;122:1035–1047. doi: 10.1053/gast.2002.32387. [DOI] [PubMed] [Google Scholar]
- 19.Lee JW, Park JH, Park DI, et al. Subjects with diarrhea-predominant IBS have increased rectal permeability responsive to tryptase. Dig Dis Sci. 2010;55:2922–2928. doi: 10.1007/s10620-009-1094-8. [DOI] [PubMed] [Google Scholar]
- 20.Kim DH, Cho YJ, Kim JH, Kim YB, Lee KJ. Stress-induced alterations in mast cell numbers and proteinase-activated receptor-2 expression of the colon: role of corticotrophin-releasing factor. J Korean Med Sci. 2010;25:1330–1335. doi: 10.3346/jkms.2010.25.9.1330. [DOI] [PMC free article] [PubMed] [Google Scholar]
- 21.Bian ZX, Li Z, Huang ZX, et al. Unbalanced expression of protease-activated receptors-1 and -2 in the colon of diarrhea-predominant irritable bowel syndrome patients. J Gastroenterol. 2009;44:666–674. doi: 10.1007/s00535-009-0058-2. [DOI] [PubMed] [Google Scholar]


