

Abstract
The small intestine is void of aquaporins adept at facilitating vectorial water transport, and yet it reabsorbs ∼8 liters of fluid daily. Implications of the sodium glucose cotransporter SGLT1 in either pumping water or passively channeling water contrast with its reported water transporting capacity, which lags behind that of aquaporin-1 by 3 orders of magnitude. Here we overexpressed SGLT1 in MDCK cell monolayers and reconstituted the purified transporter into proteoliposomes. We observed the rate of osmotic proteoliposome deflation by light scattering. Fluorescence correlation spectroscopy served to assess (i) SGLT1 abundance in both vesicles and plasma membranes and (ii) flow-mediated dilution of an aqueous dye adjacent to the cell monolayer. Calculation of the unitary water channel permeability, pf, yielded similar values for cell and proteoliposome experiments. Neither the absence of glucose or Na+, nor the lack of membrane voltage in vesicles, nor the directionality of water flow grossly altered pf. Such weak dependence on protein conformation indicates that a water-impermeable occluded state (glucose and Na+ in their binding pockets) lasts for only a minor fraction of the transport cycle or, alternatively, that occlusion of the substrate does not render the transporter water-impermeable as was suggested by computational studies of the bacterial homologue vSGLT. Although the similarity between the pf values of SGLT1 and aquaporin-1 makes a transcellular pathway plausible, it renders water pumping physiologically negligible because the passive flux would be orders of magnitude larger.
Keywords: fluorescence correlation spectroscopy (FCS), glucose transport, membrane reconstitution, membrane transport, sodium transport, transporter, water channel
Introduction
The small intestine reabsorbs ∼8 liters of fluid daily. The underlying transport mechanism has thus far remained enigmatic. Although renal vectorial water transport is mediated by aquaporins, there has been no direct evidence for the role of aquaporins in intestinal water reabsorption (1). Although aquaporins 7, 10, and 11 are expressed in the jejunum (2, 3), they preferentially adopt an intracellular location and/or appear to have rather low water permeability (4–6).
Consequently, other transporters were proposed to facilitate water reabsorption. The sodium-glucose cotransporter (SGLT1)3 is one of the most prominent candidates. SGLT1 is highly expressed in the enterocytes on the villus of brush border membranes (7). It facilitates water transport, albeit at reportedly low rates: its published unitary water permeability (pf) of only 4.5 × 10⁻¹⁶ cm3/s (8) is so low that it signifies a physiologically negligible contribution to passive water flux by SGLT1. Even if such an incredibly high number as 106 transporters were expressed in the apical membrane of an epithelial cell, their combined permeabilities would only amount to 4.5 × 10⁻¹⁰ cm3/s. The lipid matrix of the apical membrane of MDCK cells would conduct three times that much, assuming that its water permeability (Pf) is ∼5 μm/s (9), and its area (Sap) amounts to ∼250 μm2 (10).
Much higher pf values of 4.7 × 10⁻¹⁵ cm3/s (11) and 2.7 × 10⁻¹³ cm3/s (12) were reported by molecular dynamics simulations on water passage through the homologous bacterial transporter protein from Vibrio parahemeolyticus, vSGLT. Although the two computed pf values appear to be very different, they do not reflect a discrepancy in the simulations themselves; rather they mirror a difference in the methods used to extract pf from the simulations: the first value is computed from the cumulative sum of the discrete efflux and influx permeation events per time interval (11), whereas the second was calculated from the velocity of water movement along a permeation path across the center of mass of water molecules (12). Thus, both values may be considered as upper and lower bounds for the computed microstate of the transporter, i.e. the sugar and sodium-bound inward facing state of vSGLT. Because the pf values for the other conformations of the transporter may be very different, the in silico pf may not closely match the experimentally observed values, they are essentially ensemble averages over all the states that might arise during the time course of these measurements.
It is interesting, however, to note that the upper boundary of the in silico pf compares well with that of aquaporin-1 (13), which, if shared by the ensemble average, would transform SGLT1 into the main facilitator of transcellular water movement through the intestinal epithelium. To date there is no general agreement as to whether water takes a transcellular or a paracellular route. According to transepithelium resistance and junctional morphology, the epithelium of the jejunum is classified as an intermediate epithelium (14), offering the possibility for cellular junctions to serve as the main water route. Thus, solving the debate about the pf of SGLT1 will offer crucial insight about how the 8 liters of water are reabsorbed in the human intestine daily.
Establishing the true passive water transporting capacity of SGLT1 would also shed new light on the long nourished hypothesis about secondary active water transport. This hypothesis was born because there was no alternative explanation for the large water flux that was observed in response to sugar and Na+ uptake in the jejunum (15). The water flux size clearly required either the transepithelial osmotic gradient or the epithelial water permeability to be large, because the flux is calculated as the product of both parameters. However, the osmotic gradient cannot be larger than a few mOsm in size, because it can only be observed in the immediate epithelial vicinity (16), i.e. within the adjacent stagnant aqueous layers (unstirred layers (USLs)) where transport occurs solely by diffusion. The osmotic permeability seemed to be minute, too, because neither efficient water channel proteins nor a highly water-permeable lipid matrix were found. It was known that the apical membrane of epithelial cells offers an extremely small Pf because of its lipid composition (9). In consequence, the most plausible solution to the conundrum of SGLT1-triggered water transport seemed to be the assignment of 260 additional water molecules to every turnover of the transporter along with two Na+ molecules and one glucose molecule (15).
Considering a turnover rate of ∼100/s, every SGLT1 molecule would accordingly pump NP = 26,000 H2O molecules/s. It would do so independent of the osmotic gradient, i.e. if necessary, even against the osmotic gradient (15). In the latter case NP is opposed by the number of water molecules Nw that may cross a unitary SGLT1 molecule in the direction of the osmotic gradient,
where Δcosm and NA are the transmembrane osmotic gradient and Avogadro's number, respectively. For a reasonably small Δcosm of only 5 mm, Nw varies between 1350 and 810,000 s−1 depending on whether the in vitro (8) or in silico estimates (12) of pf are used for calculation. Secondary active water transport may merely attain physiological importance in the former case because NP ≫ NW. In the latter case, it would be completely insignificant, because NP ≪ NW, i.e. the passive flux would always be orders of magnitude larger than the water pumping capacity of the transporter.
To determine pf, we used SGLT1-expressing tight MDCK-C7monolayers, which do not possess paracellular permeability (17). We assessed water flow from solute dilution in the immediate vicinity of the monolayer and simultaneously measured SGLT1 membrane abundance (18). Additional reconstitution experiments of the purified transporter into small vesicles and the extraction of pf from the deflation kinetics of proteoliposomes (13) provided ultimate proof for the physiological role of the water channeling capability of SGLT1 and allowed insight into the water pathway within SGLT1.
Materials and Methods
Cell Culture
The human sodium-glucose cotransporter SGLT1 DNA (kindly provided by Drs. N. K. Tyagi and R. Kinne) was subcloned into a pEGFP-N3 vector (Clontech) to create an eGFP tag at the C terminus of SGLT1. Madin-Darby canine kidney (MDCK-C7) cells and the stable cell line expressing human sodium-glucose cotransporter 1 tagged with eGFP (MDCK-SGLT1) were cultured in DMEM supplemented with nonessential amino acids, 5% fetal calf serum (v/v), 20 mm HEPES, penicillin, and streptomycin (all from PAA) at 37 °C in 7.5% CO2. MDCK-SGLT1 cells were kept under G418 selection (500 μg ml−1). The cells (5 × 10⁵) were seeded onto polyester permeable supports (Transwell® (0.33 cm2, 0.4-μm pores), Corning Life Sciences). Cell culturing on Transwells® continued (for 4–5 days in general) until a tight monolayer was formed. We used the cells within 6 days after plating. All experiments were carried out in Hanks' balanced salt solution buffer at 37 °C.
Fluorescence Correlation Spectroscopy (FCS)
We used the FCS to estimate the SGLT1 plasma membrane abundance of MDCK cells and to detect the concentration of the reporter dye dextran-RhBs in the immediate vicinity of the MDCK monolayers as previously described (18). In brief, temporal fluctuations of the fluorescence intensity (I) were measured in the focal volume of a commercial laser scanning microscope (LSM 510) that was equipped with FCS unit (Confocor3; Carl Zeiss, Jena, Germany). The corresponding autocorrelation function G(τ) allowed us to extract both the equilibrium average number <N> of diffusing SGLT1 molecules in the focal area of radius (r) and their diffusion coefficient (D) (19).
 |
A C-Apochromat 40×/1.2W objective was exploited. The pinhole for all measurements was 1 Airy unit. The cells were illuminated at 488 nm (30 milliwatt argon laser, 50% power, 1% transmission), and the fluorescence was detected with a band pass filter (505–550 nm). Calibration and control of setup performance were done routinely with Rhodamine 6G. We estimated the total transporter abundance by assuming that SGLT1s are uniformly distributed in the cell membrane. The dextran-RhB fluorescence was excited with a 561-nm DPSS laser and detected with a 580-nm-long pass filter.
We also exploited FCS for determining the number n of SGLT1 molecules per proteoliposome as previously described (20, 21). In brief, we first obtained the numbers nv and npl per unit volume of lipid vesicles and proteoliposomes, respectively. All vesicles were labeled, because the lipid mixture contained 0.004% (w/w) N-(lissamine-rhodamine-sulfonyl) phosphatidyl-ethanolamine. All protein-bearing vesicles had a second label because of the GFP tag on SGLT1. Thus, recordings of the temporal fluctuations of the fluorescence intensity I in both the lipid channel and in the protein channel allowed calculation of two autocorrelation curves (22):
 |
where <N>, z, and Dv are the number of particles in the focal volume, the elongation of the focus in the direction of the laser beam, and the diffusion coefficient of the particles, respectively. Dividing <N> by the focal volumes of the lipid and protein channels returned nv and npl, respectively.
We subsequently dissolved the vesicles in detergent (2% SDS +2% OG + 2% Fos-Choline12) and repeated the FCS measurements with the resulting micelles. Equation 3 served to determine their number in the focal volume of the protein channel. Dividing that number by the focal volume returned the number of micelles nm per unit volume. Assuming that each micelle contained exactly one SGLT1 molecule, we assigned n to the calculated ratio nm/npl.
Transepithelial Water Flow Rate
The measurements were conducted as previously described (18). In brief, the outer chamber (buffer volume, 1.5 ml) was placed on the heated stage of the confocal microscope. Transwell inserts with cells (buffer volume inside 150 μl) were fixed on a micromanipulator and positioned 100–120 μm above the glass bottom of the outer chamber. The buffer in the outer chamber contained the reporter dye, dextran-RhB. The inability of dextran-RhB to leak into the inner chamber served as an indication for a tight monolayer. Water flow across the cell monolayer brought about time- and position-dependent changes in the dextran-RhB concentration measured using FCS.
To extract the osmotic water permeability of cell monolayers from the measured kinetics of dextran-RhB concentration, we built a computational convection diffusion model (18). The two-dimensional model is realized in COMSOL Multiphysics and takes into account the rotationally symmetric geometry of our experimental setup: the sizes of (i) the insert (inner compartment), (ii) the outer chamber (outer compartment), and (iii) the cleft between them, as well as the volume of the buffer.
Rate of Transepithelial Glucose Transport
An Amplex® Red glucose assay kit allowed us to assess glucose transport through confluent cell monolayers. Prior to the experiment, the culture medium was replaced by a glucose-free medium for 1 h at 37 °C. We used Krebs-Ringer-Henseleit (KRH) solution containing 120 mm NaCl, 4.7 mm KCl, 1.2 mm MgCl2, 2.2 mm CaCl2, 5.5 mm sorbitol, 10 mm HEPES (pH 7.4) for this purpose. After the incubation period, the KRH buffer inside theTranswell® inserts was isotonically exchanged for the glucose-containing buffer (5.5 mm glucose, sorbitol omitted), and the outer KRH buffer was replenished with fresh solution. 25-μl samples of outer KRH buffer were collected 0, 15, 30, and 60 min after buffer exchange and tested for glucose concentration according to the manufacturer protocol using calibration solutions with known glucose concentrations. The porous membrane with SGLT1-expressing MDCK cells was excised out from the insert at the end of the experiment, and protein abundance in 10 cells was analyzed with FCS.
Cloning and Expression
The C292A mutation was introduced into SGLT1 by site-directed mutagenesis and confirmed by Sanger sequencing. Both the native and mutant SGLT1 sequences were cloned into the baculovirus transfer vector pACEBac1 (Geneva Biotech). A C-terminal myc-GFP-His tag was inserted during cloning. Bacmids were prepared using the DH10MultiBac virus backbone (Geneva Biotech), and baculoviruses were generated in Sf9 cells. For protein expression, Tni cells at a density of 1 × 10⁶ cells/ml were either infected with the native or mutant SGLT1-containing baculovirus, and expression was performed at 21 °C. Cells were harvested 72–96 h after infection and frozen in liquid nitrogen.
SGLT1 Purification and Reconstitution
For SGLT1-eGFP purification from Tni cells, we adopted a previously published protocol (23). The cells were resuspended in breaking buffer (50 mm sodium phosphate, pH 7.4, 10% glycerol), supplemented with protease inhibitor mixture, and homogenized using EmulsiFlex-C5 (Avestin) at 20,000 psi. Cell debris was removed by spinning the homogenate at 6,000 × g for 10 min. We collected membrane pellets after centrifuging the supernatant at 100,000 × g for 45 min. To remove adhering and peripheral proteins, we washed the membranes using breaking buffer with 4 m urea for 2–3 h. After 1 h of centrifugation at 100,000 × g, the membrane pellet was collected and solubilized in TG buffer (20 mm Tris-HCl, pH 8, 1 m NaCl, 20% glycerol) with 1.2% Fos-Choline12 (Anatrace) for 2–4 h or overnight. After removal of the insoluble pellets by centrifugation at 100,000 × g for 1 h, the supernatant was washed and mixed with equilibrated nickel-nitrilotriacetic acid Superflow beads (Qiagen) and left to bind for 3 h or overnight. After washing the beads with 100× column volume of TG buffer (0.6% Fos-Choline12, 20 mm imidazole), we eluted the protein (TG buffer, 0.2% Fos-Choline12, 250 mm imidazole). Collected protein fractions were concentrated using ultrafiltration spin columns (Vivaspin, Sartorius) of ∼500 μl and subjected to size exclusion chromatography (Äkta pure, GE Lifesciences). We controlled the quality of the collected fractions by SDS-PAGE. The chosen fractions were concentrated and immediately used for reconstitution without protein freezing. All procedures were carried out at 4 °C.
A lipid extract from liver or the polar Escherichia coli lipid extract supplemented with 25 mol % cholesterol (all from Avanti Polar Lipids) were doped with 0.004% RhPE and used to form multilamellar vesicles in 150 mm salt, 10 or 50 mm HEPES (pH 7.5) and 1.3% octyl glucoside at a final lipid concentration of 20 mg/ml. Subsequent to bath sonication, the clear suspension was incubated with 5 mm 8-aminonaphthalene-1,3,6-trisulfonic acid), 22 mm N-dodecyl-N,N-dimethylammino-3-propane and purified SGLT1 at 4 °C for 1 h under constant shaking. Biobeads SM-2 (Bio-Rad) removed the detergent in a stepwise manner within 36 h. Proteoliposomes were harvested by ultracentrifugation. The resuspended vesicles were centrifuged to remove aggregates and extruded through 100-nm polycarbonate filters to produce a homogenous suspension. Control vesicles were similarly treated. All samples were assayed without delay.
Determination of Unitary Water Permeability of Reconstituted SGLT1
As described previously (13), we monitored the intensity I of scattered light at a wavelength of 546 nm. It is related to the volumes of proteoliposomes VSGLT1(t) and bare vesicles Vbare(t) according to the following,
 |
where α is the fraction of bare vesicles. The parameter a is calculated as a = I([ifnty]) − bVf − dVf2, where Vf = V0coi/(coi + cs). coi, cs, b, and d are the initial osmolyte concentrations inside the vesicles, the incremental osmolyte concentration in the external solution caused by sucrose addition, and two fitting parameters, respectively. The rate of the osmotically driven volume decrease allowed calculation of the vesicular water permeability Pf = Pf,c + Pf,l that reflects the permeabilities Pf,c and Pf,l of all channels and the lipid bilayer, respectively,
 |
where Vw, V0, A, and L are the molar volume of water, vesicle volume at time 0, surface area of the vesicle, and the Lambert function: L(x)eL(x) = x, respectively (13).
The system of Equations 4 and 5 was globally fitted to the whole set of shrinking curves from a particular reconstitution sample to extract the fitting parameters b, d, α, and Pf,c and Pf,l. Pf,l was common to all shrinking curves (including the protein free sample), whereas Pf,c varied with the protein concentration in the bilayers.
Glucose Transport into Lipid Vesicles
To determine the glucose transport activity of SGLT1 reconstituted into the lipid vesicles, proteoliposomes and control liposomes both prepared in glucose-free high K+ buffer were mixed 1:4 (v/v) with low K+ buffer containing 10 mm glucose. 0.5 μm valinomycin was added to establish potential across the membrane. After 30 min of incubation at room temperature, liposomes were washed on PD10 columns to remove external glucose. To estimate the amount of liposomes and protein abundance in proteoliposomes, samples collected after PD10 column washing were checked using FCS. To release the accumulated glucose, aliquots of prepared samples were dissolved by detergent mixture (1% Fos-Choline12 + 1% n-dodecyl-β-l-maltoside). Concentrations of glucose in dissolved and intact samples were determined using an Amplex® Red glucose assay kit according to the manufacturer's protocol. By combining the data of the amount of released glucose, the number of proteoliposomes, and their total inner volume, we calculated the average concentration of glucose accumulated inside the vesicles.
Results
Water Flow through Epithelial Monolayers
We stably transfected human SGLT1 tagged by eGFP into MDCK-C7 cells. The cells were allowed to grow on Transwell filters until they reached confluence. SGLT1 sorted into the plasma membrane as revealed by confocal fluorescence microscopy (Fig. 1). We observed rapid bleaching while focusing on the plasma membrane, indicating that a considerable SGLT1-eGFP fraction was immobile (Fig. 2A). We assumed that both the mobile and the immobile cotransporter fractions contributed to the initial fluorescence intensity, whereas the steady state FCS signal only reflected the mobile fraction (Fig. 1). It amounted to 75.2 ± 7.2% for cells that were cultured for 1 day and 38.4 ± 3.4% for cells that were cultured for 4–5 days. We confirmed the size (S) of the immobile fraction by observing fluorescence recovery after photobleaching (FRAP) in an area with radius (rFRAP) of 2–4 μm (Fig. 2B). S was calculated as follows,
 |
where Fi, F0, and F[ifnty] are the initial fluorescence intensity, the intensity immediately after bleaching, and the intensity after fractional recovery, respectively (24). We monitored the whole cell area to exclude both overall bleaching and focal plane drift.
FIGURE 1.
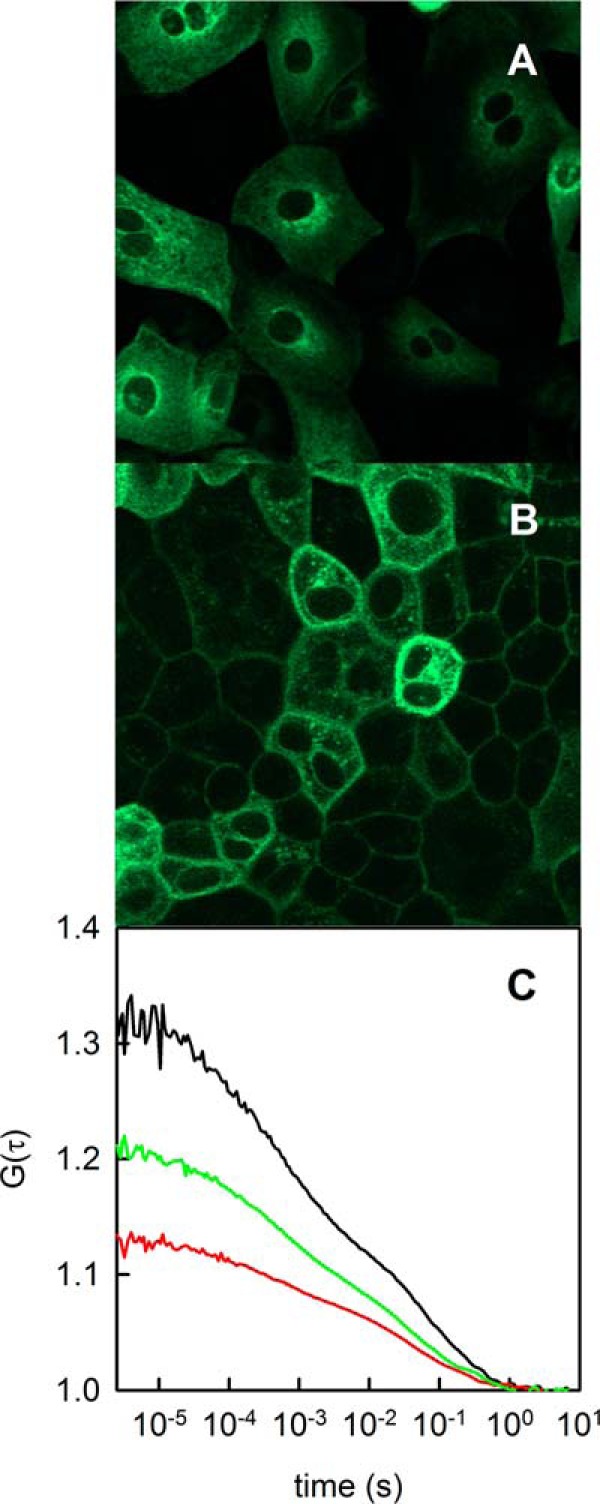
Expression of SGLT1 in stably transfected MDCK-C7 cells. A, 1 day subsequent to plating, the transporter is localized in the cytoplasm. B, it adopts plasma membrane localization when the cells reach confluency. C, fluorescence correlation spectroscopy served to determine both the number and membrane diffusion coefficient of mobile SGLT1 molecules in the focus (compare Equation 2). Representative autocorrelation curves G(τ) of the fluorescence intensity emitted by the GFP tag are shown for three different cells. According to Equation 2, they indicate that 1.5, 2.5, or 4.5 SGLT1 molecules on average were in the respective focal areas.
FIGURE 2.
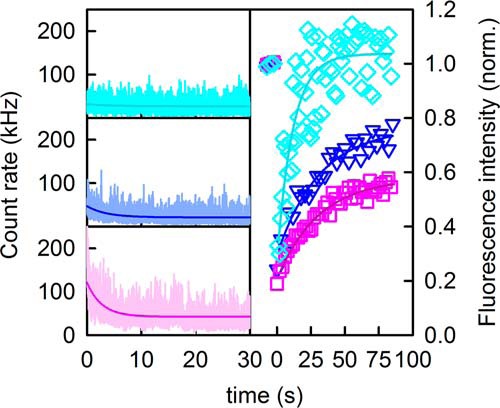
Determination of the immobile plasma membrane fraction of SGLT1 in MDCK cells. A, the focus was set on a spot of the plasma membrane in the mode for fluorescence correlation spectroscopy, which resulted in a rapid decline in the count rate from exited membrane-anchored fluorescent dyes. Assuming that freely diffusing molecules pass through the focal area too fast to be bleached, we held the immobile molecules responsible for the drop in the count rate. The size of the immobile fraction depended on cell confluency (magenta, confluent cells; blue, nonconfluent cells; cyan, lipid dye Dil18), suggesting SGLT1 anchoring to the cytoskeleton. B, FRAP in a 4–8-μm-wide area yielded the same fraction R of immobile molecules (Equation 6) as the FCS experiments. Representative FRAP curves are shown using the same color as in A. The recovery kinetics indicate SGLT1 diffusion coefficients of 0.14 ± 0.03 and 0.18 ± 0.04 μm2/s in confluent and nonconfluent cells, respectively, as well as a Dil18 diffusion coefficient of 1.0 ± 0.2 μm2/s.
We also calculated the SGLT1 membrane diffusion coefficient (DSGLT) from the half-time τFRAP of the fractional fluorescence recovery.
 |
The values 0.24 ± 0.01 and 0.18 ± 0.04 μm2/s, derived for DSGLT from FCS (Equation 2) and FRAP, respectively, agreed reasonably well with each other. By counting the mobile SGLT1 fraction by FCS and accounting for the bleached immobile SLGT1 fraction, we found a density σ of ∼218 transporters/μm2 in the apical membrane.
Isotonic addition of glucose to the apical side of the cell monolayer yielded a time-dependent increase in glucose concentration in the basal buffer that was larger for the cotransporter-expressing cells than for the parental cells (Fig. 3A). Glucose uptake by nontransfected confluent cultures of MDCK cells has been observed before. This background transport activity can be inhibited by both organic and inorganic trivalent arsenicals in a time- and concentration-dependent manner (25). By transfection with SGLT1, we provided the MDCK cells with an additional uptake system. As expected, it was inhibited by phlorizin. We calculated the transporter turnover rate R as follows,
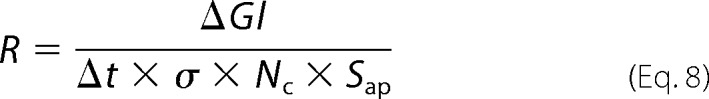 |
where ΔGl, Δt, and Nc are the increment in the number of glucose molecules in the basal buffer of SGLT1-expressing cells as compared with parental cells, the time(s) allowed for glucose accumulation, and the number of cells per Transwell insert (∼2 × 10⁵). Assuming Sap to be equal to ∼250 μm2 (10), we obtained an apparent r of 250 ± 40 s−1 (mean ± S.E., n = 10), indicating that SGLT1 was fully functional.
FIGURE 3.
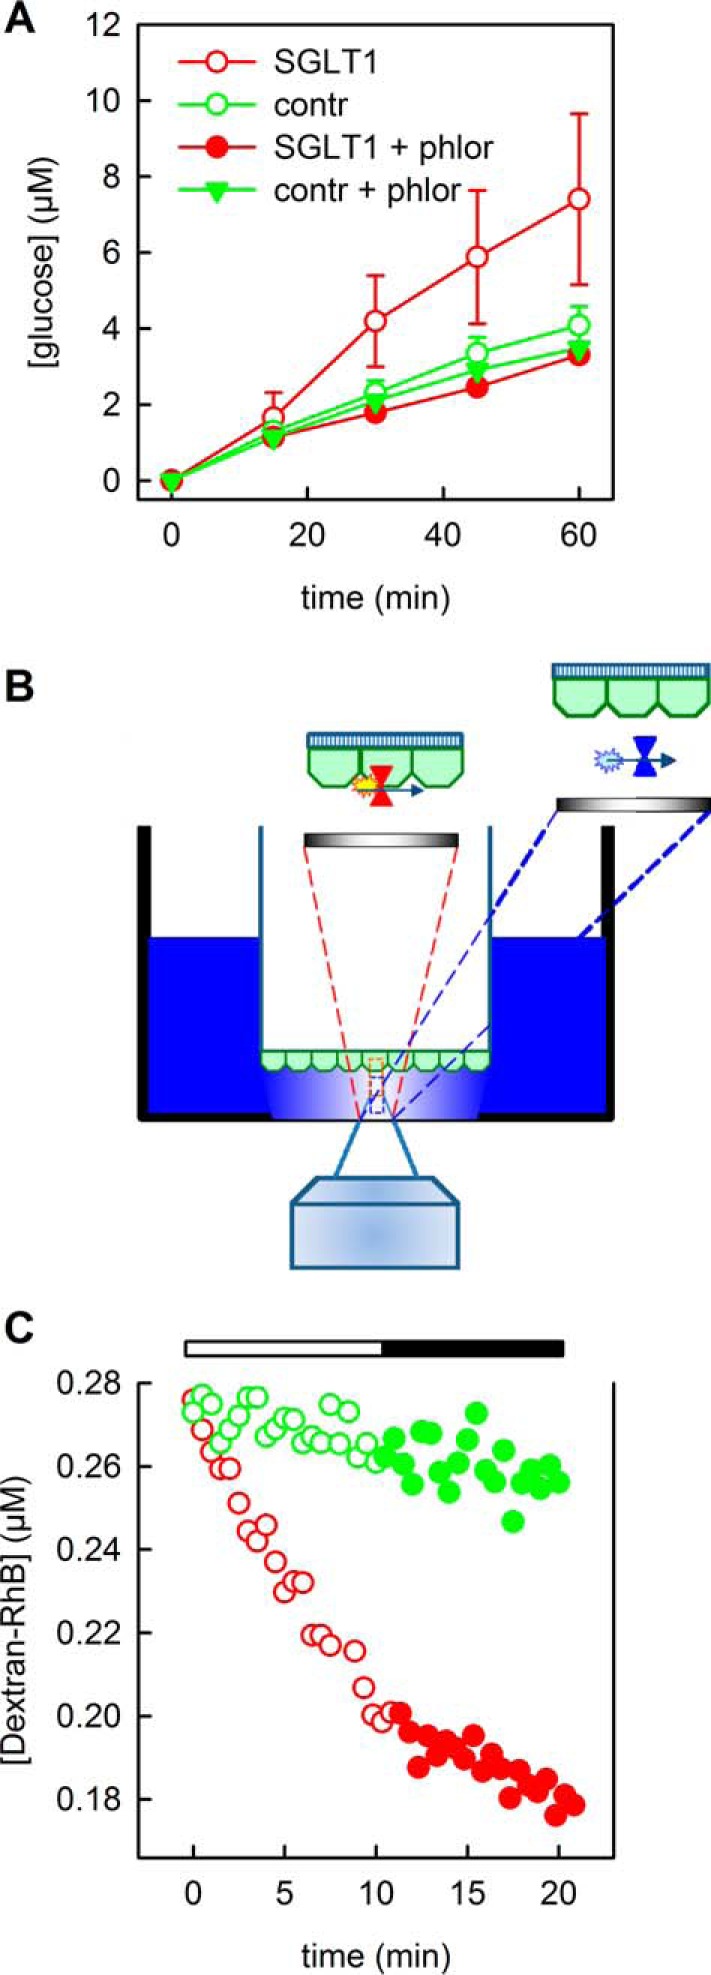
Glucose (A) and water (B and C) transport across MDCK cell monolayers. A, 5.5 mm glucose were isosmotically added into the apical compartment after 1 h of glucose deprivation. Samples from the basal compartment were taken after the indicated time intervals. Their glucose concentration was larger for SGLT1 overexpressing cells (red open circles) than for nonexpressing cells (green open circles). The data are shown as means ± S.E. of experimental data (n = 5). Inhibition by 200 μm phlorizin (phlor) brought the transport capacity of SGLT1 overexpressing cells back to control cell capacity (contr, red filled circles), whereas it had no significant effect on nontransfected cells. B, setup for measuring both transepithelial water flow and SGLT1 membrane abundance. A chamber with a glass bottom (thickness, 0.1 mm) was positioned into a thermo-jacket on top of an inverse microscope. A Transwell filter with the MDCK monolayer (green) grown on its bottom was placed ∼50 μm above the glass bottom. Osmotically induced efflux from the cup with the Transwell filter diluted the aqueous reporter dye in the outer buffer solution (blue). Fluorescence correlation spectroscopy served to determine both reporter dye concentration (right inset, blue rectangles) and membrane density of SGLT1-GFP (left inset, orange rectangle). C, the dilution of aqueous dye molecules in the outer compartment was measured at a distance of 20 μm from the MDCK-SGLT1 (red circles) or nontransfected MDCK (green circles) cell layers as a function of time. After 10 min, 0.5 mm phlorizin were added into the apical compartment. Dye dilution was delayed only in the experiment with the SGLT1-containing monolayer (filled circles) indicating SGLT1 inhibition.
The SGLT1-expressing cell monolayers displayed an increase in transepithelial water permeability, Pe. Pe was derived by rendering the basolateral compartment hyperosmotic (hypoosmotic) and by observing the resulting dilution (concentration increase) of the reporter dye, dextran-RhB, in the immediate monolayer vicinity (Fig. 3, B and C). FCS served to measure the dye concentration within the 50-μm-wide aqueous cleft between the basal membrane and the glass bottom of the measurement chamber (18). To demonstrate that SGLT1 facilitated water transport, we inhibited SGLT1 by phlorizin (0.5 mm). Pe of MDCK SGLT1 decreased from 30 μm/s to 10 μm/s. As expected, the drug did not alter the Pe of 6 μm/s of parental MDCK cells (Fig. 3C).
To derive the single cotransporter water permeability (pf) from Pe, we took into account that Pe depends on both apical and basolateral membrane permeability, Pap and Pbl, respectively,
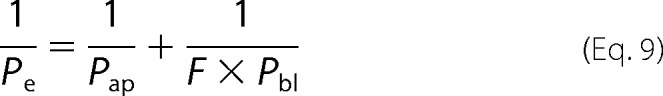 |
where F = 7.63 (10) is the ratio of the basolateral to apical membrane areas. Because our MDCK cells expressed SGLT1 both in the apical and the basolateral membranes, Pap and Pbl represent the sum of transporter- (Pt,ap and Pt,bl) and lipid-mediated (Pl,ap and Pl,bl) permeabilities. Pt,ap and Pt,bl can be expressed as the product of pf and σ.
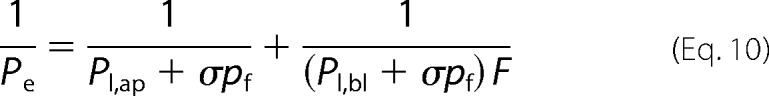 |
Assuming 4.4 (9) and 5.4 μm/s (18) for Pl,ap and Pl,bl, respectively, we found a pf of 2.55 ± 0.25 × 10⁻¹³ cm3 s−1.
Because pf exceeded the one previously measured in oocytes (8) by 3 orders of magnitude, we decided to test the water transporting capacity of SGLT1 in a reconstituted system. We therefore purified the protein from overexpressing insect cells and reconstituted it into lipid vesicles. Proteoliposome exposure to a hyperosmotic solution resulted in their deflation. Measurements of scattered light intensity (I) served to monitor vesicle volume V(t) as a function of time (Fig. 4) via our new adaptation of the Rayleigh-Gans-Debye equation (13). In turn, V(t) allowed calculation of vesicle permeability Pf. Increasing the number (n) of SGLT1 molecules per vesicle accelerated the rate of shrinkage (Fig. 4).
FIGURE 4.
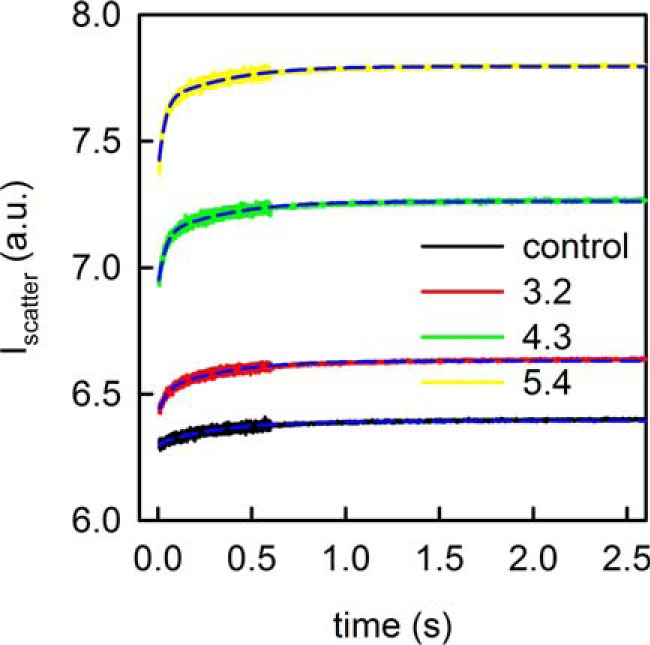
Osmotically induced deflation of proteoliposomes increased the intensity of scattered light. The rate of the intensity changes increase with the per vesicle number of reconstituted SGLT1 molecules. On average 0, 3.2, 4.3, or 5.4 SGLT1 monomers were reconstituted per proteoliposome (inset). The global fit of the mathematical model to the experimental data set is shown as dashed blue lines. For the control sample and the SGLT1-containing samples in the order of increasing protein abundance, it yielded the following Pf values: 5.9, 46.2, 52.9, and 56 μm/s, respectively. Scattered light intensity was recorded by a stopped flow device at an angle of 90° at 5 °C. The buffer contained 150 mm NaCl, 10 mm HEPES (pH 7.5). Osmosis was induced by a 150 mm sucrose gradient.
In contrast, substitution of Na+ for K+ had no significant effect on pf, suggesting that passing the Na+ binding site may not be rate-limiting for water. Water does not seem to drag Na+ through a constriction site either, because changes of the transmembrane voltage by CCCP and valinomycin did not alter pf. This may have been expected if a streaming potential would have built up (Fig. 5, C and D). Finally, we substituted Cys in position 292 for Ala. Although the mutation triples the Na+ leak current through SGLT1 in the oolema (26), it did not augment pf of the reconstituted channel (Fig. 5B). Thus, the introduced mutation removes a barrier that obstructs the Na+ leak (either sterical or electrostatic) but does not eliminate a significant barrier for water movement. Previous oocyte experiments report contradictory results: removal of external Na+ either eliminated the water conducting ability of SGLT1 (27) or augmented it (28).
FIGURE 5.
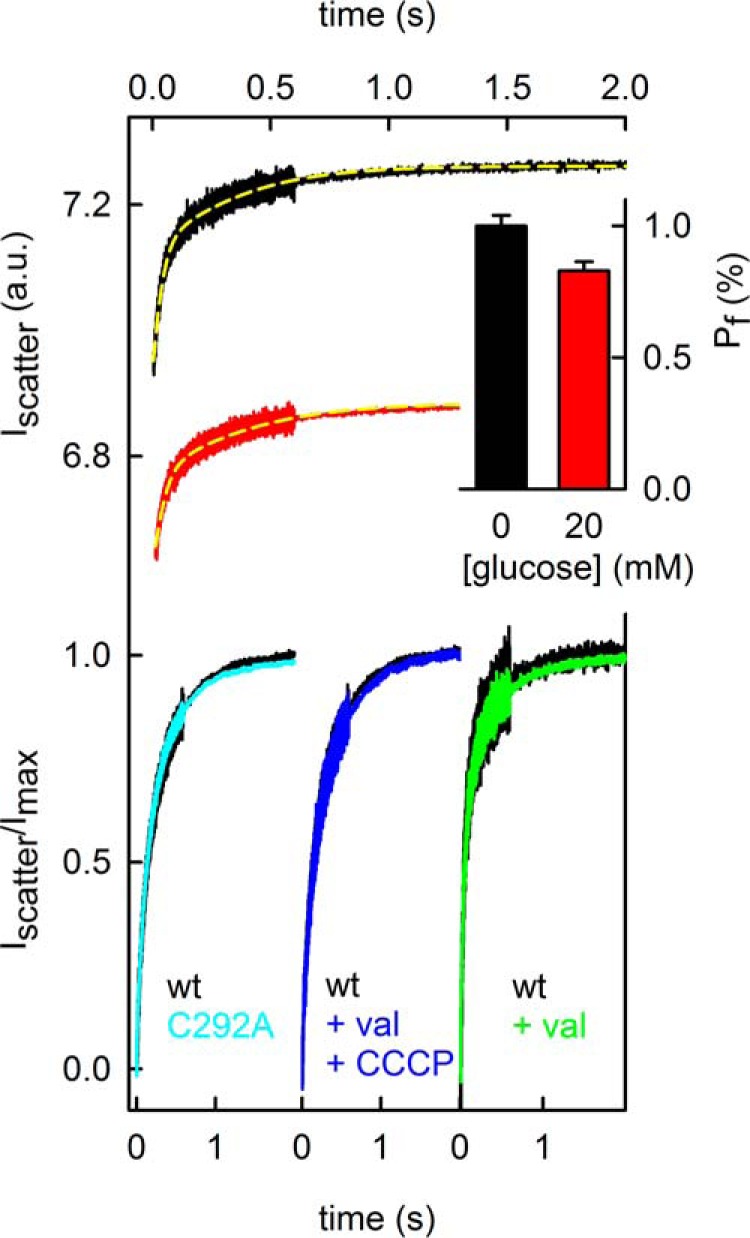
The unitary water permeability pf of SGLT1 was modified by glucose. A, the proteoliposomes contained on average 4.3 SGLT1 molecules. Deflation by 150 mm sucrose was decelerated by 20 mm glucose (black and red lines). Fitting Equations 4 and 5 (yellow lines) to the time dependence of scattered light intensity returned 5, 53, and 43 μm/s for basal (lipid) Pf, Pf in the absence of glucose, and Pf in the presence of glucose, respectively. Thus, glucose reduces pf by 17% (inset). We confirmed the effect at two additional SGLT1 concentrations. The initial internal and external solutions contained 150 mm NaCl and 10 mm HEPES (pH 7.5). B, although known to triple the sodium leak for SGLT1, the point mutation C292A did not alter pf. C, clamping the membrane potential to 0 by adding both the potassium ionophore valinomycin and the protonophore CCCP did not alter pf. For B and C, the initial internal and external salt concentrations were 10 mm NaCl and 140 mm KCl. The vesicular membrane contained 2.5 transporter molecules on average. D, reconstituting an average number of 5.7 transporter molecules per vesicle and inducing a membrane potential of −18 mV by adding valinomycin did not alter the rate of vesicle shrinkage. The outside and inside solutions contained 20 mm glucose, 75 mm NaCl, 75 mm KCl, 150 mm sucrose, 20 mm glucose, and 150 mm KCl, respectively. The solutions (B–D) were buffered with 50 mm HEPES (pH 7.5).
The addition of 1 or 2 mm glucose somewhat decreased the water flux. To get a statistically significant effect, we had to add larger amounts of glucose to the proteoliposomes: 20 mm glucose resulted in a 17% drop in pf (Fig. 5A), suggesting that at least some of the water molecules share the pathway of glucose and are delayed by its presence.
In contrast, phlorizin did not significantly inhibit water transport through the reconstituted SGLT1. The result is not at odds with the partial inhibition (Fig. 3) observed with MDCK cells, mainly because (i) the membrane-impermeable phlorizin may bind to only 50% of the randomly oriented transporter molecules in vesicles, (ii) inhibition of glucose-sodium cotransport across the apical plasma membrane must decrease the cytoplasmic osmolyte concentration adjacent to that membrane, thereby decreasing water flux, and (iii) the inhibitory effect in MDCK cells may partly be mediated by the inhibition of the Na+-K+-ATPase. The pump generates a local osmotic gradient which in turn drives water transport in epithelia (16).
The reconstituted transporter was functional as indicated by accumulation of 2.5 mm glucose within the proteoliposomes as compared with control vesicles (Fig. 6). Glucose transport into the vesicles was driven by both a glucose gradient and a membrane potential that built up in the presence of valinomycin because of a transmembrane potassium gradient.
FIGURE 6.
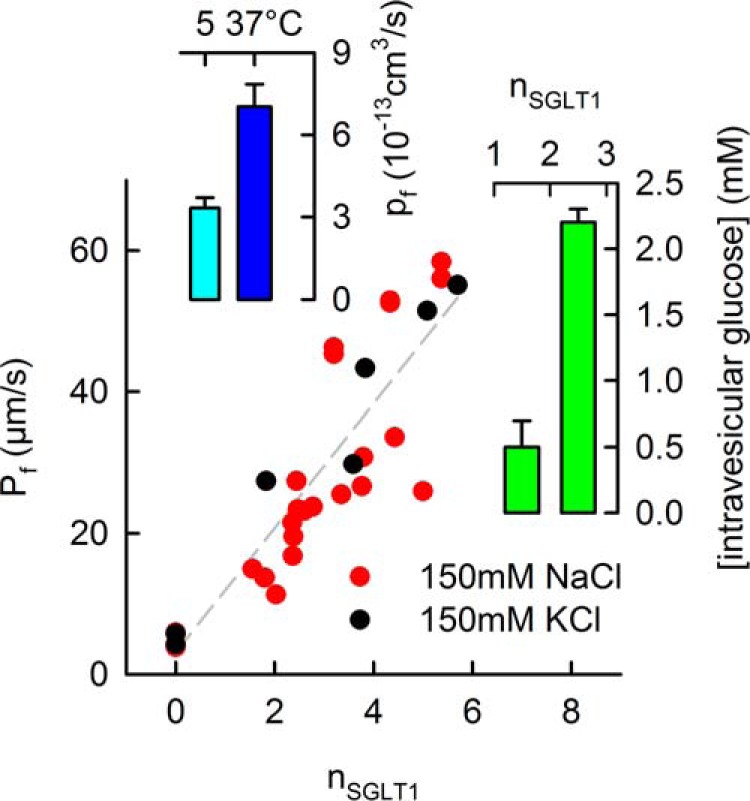
Water and glucose transport across reconstituted SGLT1. A, the water permeability pf of one SGLT1 molecule was measured at 5 °C and subsequently recalculated for 37 °C. B, dependence of the vesicular water permeability Pf on the per vesicle number nSGLT1 of reconstituted SGLT1 molecules. pf was found as the slope of the linear regression multiplied by the membrane area of an individual vesicle. Substituting 150 mm Na+ (red) for 150 mm K+ had no significant effect on pf. The buffer also contained 10 mm HEPES (pH 7.5). C, the reconstituted transporter was functional as tested by a colorimetric assay of glucose uptake into the vesicles. External K+ and valinomycin served to establish an initial membrane potential.
We calculated pf from a plot of Pf as a function of n (29). The slope of that plot corresponds to a pf of 3.3 ± 0.4 × 10⁻¹³ cm3/s at 5 °C (Fig. 6). Assuming the typical activation energy of ∼ 4 kcal/mol for water transport through channels, we find that pf is equal to 7 ± 0.8 × 10⁻¹³ cm3 s−1 at 37 °C.
The pf of the reconstituted transporter is in line with the one obtained from SGLT1-expressing cell monolayers. The agreement is surprising, because the SGLT1 conformations in cells and vesicles are not necessarily the same: The membrane potential is maintained at −30 mV in living MDCK cells, whereas it is either positive inside shrunken vesicles (because of the up-concentration of Na+) or clamped to 0 by the protonophore CCCP and the K+-ionophore valinomycin. Previous oocyte experiments also revealed a weak potential dependence: the water permeability of SGLT1 overexpressing oocytes changed by only ∼20% when the membrane potential was decreased from −20 to −100 mV (28).
Discussion
pf measurements of SGLT1 both in live cells and in a reconstituted system reveal unexpectedly high water conductivity. It positions the transporter into the top league of water facilitators, alongside with aquaporin-1 (13). Taking into account that aquaporin-1 represents the main water pathway in the leaky epithelium of the proximal renal tubule, this observation suggests that SGLT1 may enable transcellular water movement through the intermediate epithelium of the small intestine.
The high pf value immediately leads to a second very important conclusion: It rules out the possibility of secondary active water transport via SGLT1. SGLT1 has been repeatedly proposed to pump water (reviewed in Ref. 30). The simple calculation according to Equation 1 shows that even a modest osmotic gradient of only 5 mOsm would drive an osmotic flux of ∼1000 times as large as the largest flux attainable by pumping (compare Introduction). That is, even if water was carried along with glucose and Na+, the resulting flux would be physiologically negligible.
Our conclusion is in line with other reports that likewise found only passive water flux and no indications for water pumping: (i) The first report explained the increment in water influx caused by SGLT1 expression in oocytes (15) by the near-membrane accumulation of the cotransported osmotically active Na+ ions and glucose molecules (31, 32). The transport of both solutes away from the oocyte membrane was hampered by USLs. Because the multiple oolemma invaginations act to increase the size of the USLs, solute accumulation is more pronounced than in epithelial cells. In combination with the large pf of SGLT1, the USLs ensure that even small osmotic gradients produce large water fluxes. (ii) Recent molecular dynamics simulations captured such a small number of water molecules in the occluded state of vSGLT that pumping them through vSGLT1 or any other homologous protein was deemed unlikely to make a significant contribution to water transport (11). (iii) Another experimental study explored the possibility that not only SGLT1, but also the potassium chloride cotransporter has falsely been implicated in water pumping (33). It showed that the decrease in transepithelial water flux upon pharmacological potassium chloride cotransporter inhibition has nothing to do with water pumping but is due to a reduced potassium efflux from the cell monolayer. Administering the K+-H+ exchanger nigericin rescued the cellular K+ efflux, which in turn allowed for full recovery of the transepithelial water flux (33). Because the mobile carrier nigericin is too small to shuttle several hundred water molecules per cycle, there must be alternative pathways for water and potassium.
Our experimentally determined pf is 3 orders of magnitude larger than the one derived for SGLT1 from experiments in the oocyte expression system (8). The difference is too large to place sole blame on oocyte USLs (31). During the swelling experiments, oocytes generally increase their volume by 20–30%. The required increase in surface area is impossible to achieve by membrane stretching, which is limited to 5% (34). It requires unfolding of the oolemma, which has a 9-fold larger surface area than a sphere with the size of the oocyte (8). Attachment of SGLT1 to the cytoskeleton is likely to hamper unfolding of oolemma invaginations and prevent microvilli from stretching out. If the fraction of SGLT1 molecules in oocytes that is thus rendered immobile is as large as that in MDCK cells (Fig. 2), oolemma unfolding must face a considerable resistance. This explains why the water permeability of oocytes transfected with SGLT1 saturates at 38 μm/s (27), whereas levels of 300 μm/s are easily achievable by transfection with aquaporins (35).
Because the structures of the SGLT1 family members vSGLT and LeuT do not show an aqueous pore (36–38), water is likely to take the same routes as glucose or Na+ through these transporters (Fig. 7). We found experimental support for a shared pathway with glucose, but none in favor of water taking the Na+ pathway. That is, neither the presence nor absence of Na+ nor modifying the membrane potential (by CCCP and/or valinomycin) exerted any effect on pf. Furthermore, the wild-type protein and the C292A mutant conduct water equally well, although the mutant is known to facilitate a 3-fold larger Na+ leak current. Nevertheless, we cannot exclude that (i) the mutation only removed a barrier to Na+ and (ii) the diffusion of both species is completely decoupled within that part of the pathway that they may share.
FIGURE 7.
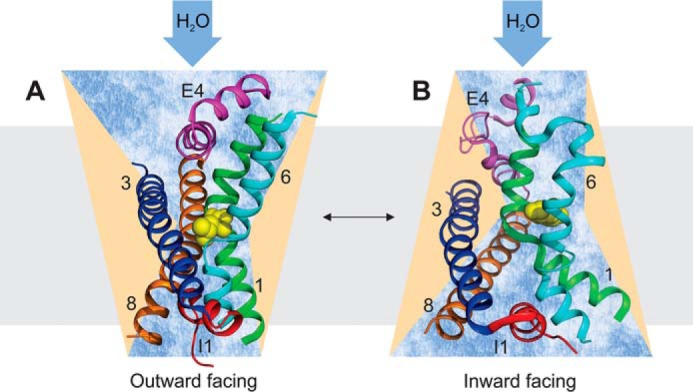
Scheme of the water pathway through SGLT1. The outward (A) and inward (B) facing conformations are taken from the homologous transporters LeuT (Protein Data Bank code 2A65) and vSGLT (Protein Data Bank code 3DH4), respectively. Leucine and galactose are shown as yellow spheres. Either the duration of glucose occupying this position is rather short as compared with the whole transport cycle or water is able to bypass the constriction zone as has been suggested by molecular dynamics simulation. The selection of the crucial membrane helices (1, green; 3, blue; 6, cyan; 8, brown), extracellular and intracellular helix-loop-helix structures, E4, and I1 follows (39). The water transporting capacity of SGLT1 is comparable with that of aquaporin-1.
A shared pathway for water and glucose is supported by the observed decrease in pf upon addition of saturating glucose concentrations. That is, glucose partially blocked the water pathway when its concentration exceeded Michaelis constant Km = 0.6 mm by more than an order of magnitude, at which SGLT1 achieves half of its maximum rate. This observation clearly shows that the empty transporter is also water-permeable. So far only the inward facing substrate-bound state was reported to facilitate water transport by computational analysis (12). However, it must be noted that the experimentally obtained pf value is in surprisingly good agreement with the in silico pf that was derived for a single conformational state of the homologous vSGLT (12).
SGLT1 overexpressing in MDCK cells and reconstitution into proteoliposomes both provide the first experimental evidence for a highly efficient water pathway through the transporter. Because SGLT1 is not equipped with a special water selectivity filter, the constriction site in the middle of the protein consisting of four hydrophobic residues is likely to fulfill that function. The large pf value of SGLT1 renders transcellular water transport in the jejunal epithelium plausible and at the same time proves by reductio ad absurdum that SGLT1 water pumping is out of the question.
Author Contributions
L. E. conducted the experiments on cells. L. E., N. O., and C. S. purified the protein. A. H. reconstituted SGLT1 and carried out the experiments on proteoliposomes. L. E., A. H., and P. P. analyzed the results. P. P. conceived the idea for the project and wrote the paper. All authors reviewed the results and approved the final version of the manuscript.
Acknowledgments
We thank Quentina Beatty for editorial help. Cloning and expression using the baculovirus system were performed by the CSF Protein Technologies Facility (Vienna, Austria). We are grateful to Drs. N. K. Tyagi and R. Kinne for providing us with the SGLT1 clone.
The project was supported by Grant P23574 from the Austrian Science Fund (to P. P.). The authors declare that they have no conflicts of interest with the contents of this article.
- SGLT
- sodium-glucose cotransporter
- USL
- unstirred layer
- FCS
- fluorescence correlation spectroscopy
- KRH
- Krebs-Ringer-Henseleit
- FRAP
- fluorescence recovery after photobleaching.
References
- 1. Ma T., and Verkman A. S. (1999) Aquaporin water channels in gastrointestinal physiology. J. Physiol. 517, 317–326 [DOI] [PMC free article] [PubMed] [Google Scholar]
- 2. Hatakeyama S., Yoshida Y., Tani T., Koyama Y., Nihei K., Ohshiro K., Kamiie J. I., Yaoita E., Suda T., Hatakeyama K., and Yamamoto T. (2001) Cloning of a new aquaporin (AQP10) abundantly expressed in duodenum and jejunum. Biochem. Biophys. Res. Commun. 287, 814–819 [DOI] [PubMed] [Google Scholar]
- 3. Laforenza U., Miceli E., Gastaldi G., Scaffino M. F., Ventura U., Fontana J. M., Orsenigo M. N., and Corazza G. R. (2010) Solute transporters and aquaporins are impaired in celiac disease. Biol. Cell 102, 457–467 [DOI] [PubMed] [Google Scholar]
- 4. Ishibashi K., Kuwahara M., Gu Y., Kageyama Y., Tohsaka A., Suzuki F., Marumo F., and Sasaki S. (1997) Cloning and functional expression of a new water channel abundantly expressed in the testis permeable to water, glycerol, and urea. J. Biol. Chem. 272, 20782–20786 [DOI] [PubMed] [Google Scholar]
- 5. Ishibashi K., Morinaga T., Kuwahara M., Sasaki S., and Imai M. (2002) Cloning and identification of a new member of water channel (AQP10) as an aquaglyceroporin. Biochim. Biophys. Acta 1576, 335–340 [DOI] [PubMed] [Google Scholar]
- 6. Yakata K., Tani K., and Fujiyoshi Y. (2011) Water permeability and characterization of aquaporin-11. J. Struct. Biol. 174, 315–320 [DOI] [PubMed] [Google Scholar]
- 7. Hwang E. S., Hirayama B. A., and Wright E. M. (1991) Distribution of the SGLT1 Na+ glucose cotransporter and mRNA along the crypt-villus axis of rabbit small intestine. Biochem. Biophys. Res. Commun. 181, 1208–1217 [DOI] [PubMed] [Google Scholar]
- 8. Zampighi G. A., Kreman M., Boorer K. J., Loo D. D., Bezanilla F., Chandy G., Hall J. E., and Wright E. M. (1995) A method for determining the unitary functional capacity of cloned channels and transporters expressed in Xenopus laevis oocytes. J. Membr. Biol. 148, 65–78 [DOI] [PubMed] [Google Scholar]
- 9. Krylov A. V., Pohl P., Zeidel M. L., and Hill W. G. (2001) Water permeability of asymmetric planar lipid bilayers: leaflets of different composition offer independent and additive resistances to permeation. J. Gen. Physiol. 118, 333–340 [DOI] [PMC free article] [PubMed] [Google Scholar]
- 10. von Bonsdorff C. H., Fuller S. D., and Simons K. (1985) Apical and basolateral endocytosis in Madin-Darby canine kidney (MDCK) cells grown on nitrocellulose filters. EMBO J. 4, 2781–2792 [DOI] [PMC free article] [PubMed] [Google Scholar]
- 11. Li J., Shaikh S. A., Enkavi G., Wen P. C., Huang Z., and Tajkhorshid E. (2013) Transient formation of water-conducting states in membrane transporters. Proc. Natl. Acad. Sci. U.S.A. 110, 7696–7701 [DOI] [PMC free article] [PubMed] [Google Scholar]
- 12. Adelman J. L., Sheng Y., Choe S., Abramson J., Wright E. M., Rosenberg J. M., and Grabe M. (2014) Structural determinants of water permeation through the sodium-galactose transporter vSGLT. Biophys. J. 106, 1280–1289 [DOI] [PMC free article] [PubMed] [Google Scholar]
- 13. Horner A., Zocher F., Preiner J., Ollinger N., Siligan C., Akimov S. A., and Pohl P. (2015) The mobility of single-file water molecules is governed by the number of H-bonds they may form with channel-lining residues. Sci. Adv. 1, e1400083. [DOI] [PMC free article] [PubMed] [Google Scholar]
- 14. Claude P., and Goodenough D. A. (1973) Fracture faces of zonulae occludentes from“ tight” and“ leaky” epithelia. J. Cell Biol. 58, 390–400 [DOI] [PMC free article] [PubMed] [Google Scholar]
- 15. Loo D. D., Zeuthen T., Chandy G., and Wright E. M. (1996) Cotransport of water by the Na+/glucose cotransporter. Proc. Natl. Acad. Sci. U.S.A. 93, 13367–13370 [DOI] [PMC free article] [PubMed] [Google Scholar]
- 16. Spring K. R. (1999) Epithelial fluid transport: a century of investigation. News Physiol. Sci. 14, 92–98 [DOI] [PubMed] [Google Scholar]
- 17. Kovbasnjuk O., Leader J. P., Weinstein A. M., and Spring K. R. (1998) Water does not flow across the tight junctions of MDCK cell epithelium. Proc. Natl. Acad. Sci. U.S.A. 95, 6526–6530 [DOI] [PMC free article] [PubMed] [Google Scholar]
- 18. Erokhova L., Horner A., Kügler P., and Pohl P. (2011) Monitoring single-channel water permeability in polarized cells. J. Biol. Chem. 286, 39926–39932 [DOI] [PMC free article] [PubMed] [Google Scholar]
- 19. Magde D., Elson E., and Webb W. W. (1972) Thermodynamic fluctuations in a reacting system: measurement by fluorescence correlation spectroscopy. Phys. Rev Lett. 29, 705–708 [Google Scholar]
- 20. Knyazev D. G., Lents A., Krause E., Ollinger N., Siligan C., Papinski D., Winter L., Horner A., and Pohl P. (2013) The bacterial translocon SecYEG opens upon ribosome binding. J. Biol. Chem. 288, 17941–17946 [DOI] [PMC free article] [PubMed] [Google Scholar]
- 21. Hoomann T., Jahnke N., Horner A., Keller S., and Pohl P. (2013) Filter gate closure inhibits ion but not water transport through potassium channels. Proc. Natl. Acad. Sci. U.S.A. 110, 10842–10847 [DOI] [PMC free article] [PubMed] [Google Scholar]
- 22. Elson E. L., and Magde D. (1974) Fluorescence correlation spectroscopy: 1. conceptual basis and theory. Biopolymers 13, 1–27 [DOI] [PubMed] [Google Scholar]
- 23. Tyagi N. K., Goyal P., Kumar A., Pandey D., Siess W., and Kinne R. K. (2005) High-yield functional expression of human sodium/d-glucose cotransporter1 in Pichia pastoris and characterization of ligand-induced conformational changes as studied by tryptophan fluorescence. Biochemistry 44, 15514–15524 [DOI] [PubMed] [Google Scholar]
- 24. Reits E. A., and Neefjes J. J. (2001) From fixed to FRAP: measuring protein mobility and activity in living cells. Nat. Cell Biol. 3, E145–E147 [DOI] [PubMed] [Google Scholar]
- 25. Liebl B., Mückter H., Doklea E., Fichtl B., and Forth W. (1992) Influence of organic and inorganic arsenicals on glucose uptake in Madin-Darby canine kidney (MDCK) cells. Analyst 117, 681–684 [DOI] [PubMed] [Google Scholar]
- 26. Longpré J. P., Gagnon D. G., Coady M. J., and Lapointe J. Y. (2010) The actual ionic nature of the leak current through the Na+/glucose cotransporter SGLT1. Biophys. J. 98, 231–239 [DOI] [PMC free article] [PubMed] [Google Scholar]
- 27. Loike J. D., Hickman S., Kuang K., Xu M., Cao L., Vera J. C., Silverstein S. C., and Fischbarg J. (1996) Sodium-glucose cotransporters display sodium- and phlorizin-dependent water permeability. Am. J. Physiol. 271, C1774–C1779 [DOI] [PubMed] [Google Scholar]
- 28. Sasseville L. J., Cuervo J. E., Lapointe J. Y., and Noskov S. Y. (2011) The structural pathway for water permeation through sodium-glucose cotransporters. Biophys. J. 101, 1887–1895 [DOI] [PMC free article] [PubMed] [Google Scholar]
- 29. Saparov S. M., Tsunoda S. P., and Pohl P. (2005) Proton exclusion by an aquaglyceroprotein: a voltage clamp study. Biol. Cell 97, 545–550 [DOI] [PubMed] [Google Scholar]
- 30. Zeuthen T. (2010) Water-transporting proteins. J. Membr. Biol. 234, 57–73 [DOI] [PubMed] [Google Scholar]
- 31. Duquette P. P., Bissonnette P., and Lapointe J. Y. (2001) Local osmotic gradients drive the water flux associated with Na+/glucose cotransport. Proc. Natl. Acad. Sci. U.S.A. 98, 3796–3801 [DOI] [PMC free article] [PubMed] [Google Scholar]
- 32. Gagnon M. P., Bissonnette P., Deslandes L. M., Wallendorff B., and Lapointe J. Y. (2004) Glucose accumulation can account for the initial water flux triggered by Na+/glucose cotransport. Biophys. J. 86, 125–133 [DOI] [PMC free article] [PubMed] [Google Scholar]
- 33. Mollajew R., Zocher F., Horner A., Wiesner B., Klussmann E., and Pohl P. (2010) Routes of epithelial water flow: aquaporins versus cotransporters. Biophys. J. 99, 3647–3656 [DOI] [PMC free article] [PubMed] [Google Scholar]
- 34. Evans E., and Rawicz W. (1990) Entropy-driven tension and bending elasticity in condensed-fluid membranes. Phys. Rev Lett. 64, 2094–2097 [DOI] [PubMed] [Google Scholar]
- 35. Yang B., and Verkman A. S. (1997) Water and glycerol permeabilities of aquaporins 1–5 and MIP determined quantitatively by expression of epitope-tagged constructs in Xenopus oocytes. J. Biol. Chem. 272, 16140–16146 [DOI] [PubMed] [Google Scholar]
- 36. Faham S., Watanabe A., Besserer G. M., Cascio D., Specht A., Hirayama B. A., Wright E. M., and Abramson J. (2008) The crystal structure of a sodium galactose transporter reveals mechanistic insights into Na+/sugar symport. Science 321, 810–814 [DOI] [PMC free article] [PubMed] [Google Scholar]
- 37. Watanabe A., Choe S., Chaptal V., Rosenberg J. M., Wright E. M., Grabe M., and Abramson J. (2010) The mechanism of sodium and substrate release from the binding pocket of vSGLT. Nature 468, 988–991 [DOI] [PMC free article] [PubMed] [Google Scholar]
- 38. Yamashita A., Singh S. K., Kawate T., Jin Y., and Gouaux E. (2005) Crystal structure of a bacterial homologue of Na+/Cl−-dependent neurotransmitter transporters. Nature 437, 215–223 [DOI] [PubMed] [Google Scholar]
- 39. Krishnamurthy H., Piscitelli C. L., and Gouaux E. (2009) Unlocking the molecular secrets of sodium-coupled transporters. Nature 459, 347–355 [DOI] [PMC free article] [PubMed] [Google Scholar]