

Abstract
Flow cytometry-, ELISA-, and ELISpot-based in vitro assays have played important roles in assessing the frequencies and functional competence of antigen-specific T cells in the setting of infectious disease and cancer. Such methods have helped in the development of antigen-specific vaccines for human disease prevention/treatment and have also served as a foundation for the monitoring of patients’ immune responsiveness based on antigen-induced T cell expression of effector molecules (such as cytokines, chemokines, or proteins associated with cytolysis) as a consequence of therapeutic intervention.
The following method outlines a protocol employing quantitative real-time PCR (qRT-PCR) with SYBR® green technology to examine antigen-specific CD8+ T cell responses based on their rapid up-regulation of IFN-γ mRNA transcription following in vitro stimulation with peptide (antigen)-loaded, autologous peripheral blood mononuclear cells (PBMCs). The advantages of the current qRT-PCR approach over protein-based detection methods include the sensitivity to distinguish resident CD8+ T cell responses against multiple antigens without the need to artificially pre-expand T cell numbers ex vivo, as is commonly required for the latter in vitro assay systems. Following qRT-PCR setup and run, the level of human IFN-γ transcript is normalized to CD8 transcript expression level, with data reported as the relative fold change in this index versus a patient-matched PBMC sample stimulated with a negative control peptide (e.g., HIV NEF).
Keywords: Quantitative real-time PCR, CD8+ T cell, Peptide-restricted response, Cancer
1 Introduction
Over the past several decades, a number of immunologic techniques have been used to document and quantitate antigen-specific responses among CD8+ T cells harvested from patients with cancer [1]. These include in vitro sensitization (IVS) procedures in which T cells are first preincubated with antigens for typically 5–7 days, prior to the measurement of their “specific” production/secretion of effector cytokines (e.g., interleukin (IL)-2, interferon (IFN)-γ, tumor necrosis factor (TNF)-α, among others) by means of enzyme-linked immunosorbent assay [ELISA]) and/or the cytolysis of antigen-expressing target cells, which both provide indices of T cell functionality. The enzyme-linked immunosorbent spot (ELISPOT) assay remains a separate but related technique in distinguishing protein expression at the individual T cell level and, thus, it provides information regarding T cell functionality, but also a quantitative index of antigen-specific T cell frequencies in the bulk population. Additionally, flow cytometric methods, incorporating fluorescently labeled MHC class I-peptide multimers (e.g., tetramer and dextramer technologies), allow for the determination of the frequency of T cells reactive against a given MHC class I-presented peptide complex. When combined with procedures that stain for intracellular expression of T cell effector molecules (e.g., cytokines, chemokines, lytic molecules such as perforin and granzyme B, or lytic granule release based on translocation of the CD107 marker to the T cell surface) a quantitative readout of antigen-specific T cell functionality may also be established [2–4].
Unfortunately, for detection of T cell responses that are rare events against a range of low-to-moderate immunogenic antigens, substantial cell (PBMC) yields, and prior IVS may limit the range of specificities that may be investigated and/or necessitate in vitro expansions that may deviate the nature and frequency of analogous responses in vivo [5]. In the following method, we describe a quantitative real-time PCR (qRT-PCR)-based approach to assess peptide-specific, type 1 CD8+ T cell responses based on the quantitation of acute differences in IFN-γ mRNA expression levels in the absence or the presence of antigen-specific stimulation. The strength of this method lies in its ability to rapidly (within 2 h) quantitate a range of antigen-specific T cell responses in a given patient, without prior in vitro manipulations, using a small sample size in comparison to the aforementioned immunologic techniques. Our experience with this method, to date, has involved the analysis of low-frequency CD8+ T cell responses against peptide epitopes derived from antigens differentially expressed by blood vessel cells within the tumor microenvironment in HLA-A2+ patients with renal cell carcinoma (RCC). We envision this technique to be useful in the longitudinal assessment of type 1 T cell response in cancer patients undergoing any form of immunomodulatory therapy, including specific vaccination approaches [5–7]. However, one can also readily envision the application of this qRT-PCR technique of monitoring T cell responsiveness in the settings of infectious disease, autoimmunity, and organ transplantation [8–11].
2 Materials
Ficoll-Hypaque density gradient solution (GE Healthcare).
Phosphate-buffered saline (PBS).
Complete culture medium (CM) (IMDM [Life Technologies] supplemented with 10 % heat-inactivated normal human serum [Sigma], 10 mmol/l L-glutamine, 100 U/ml penicillin, 100 μg/ml streptomycin, and nonessential amino acids [all from Life Technologies]).
RNeasy plus micro Kit (Qiagen).
High Capacity RNA-to-cDNA Kit (Life Technologies).
SYBR® Green Master Mix (Life Technologies).
Human CD8 forward and reverse primers.
Human IFN-γ forward and reverse primers.
PCR thermocycler.
qRT-PCR system.
3 Methods
3.1 Human Peripheral Blood Mononuclear Cell (PBMC) Isolation and Culture Setup
The collection and handling of human blood should be performed in accordance to institutional rules and guidelines. Assume that all blood products contain infectious material.
Human whole blood should be transferred from heparinized tubes to a T75 culture flask (do not exceed 50 ml). Blood should be diluted at a 1:2 ratio with PBS, mixed thoroughly, and 30 ml aliquoted into a 50 ml conical tube (see Note 1).
Gently add 12 ml Ficoll-Hypaque to the bottom of the tube so that the diluted blood overlays the density gradient solution.
Centrifuge tubes at 800 × g for 20 min at room temperature.
Carefully aspirate the interphase layer containing the leukocytes without disturbing the erythrocyte pellet at the bottom of the tube and transfer to a new 50 ml conical tube (see Note 2).
Add PBS up to 50 ml, mix sufficiently, and centrifuge at 500 × g for 10 min at 4 °C.
Decant the supernatant, resuspend the leukocyte cell pellet in 5 ml PBS, and repeat steps 5 and 6 for a total of two wash steps.
Resuspend the PBMCs in CM and adjust to 2.7 × 10⁶ cells/ml.
Place 150 μl into each well of a 96-well U-bottom plate depending on the number of desired replicates and peptides to be analyzed (see Note 3).
3.2 PBMC Peptide Stimulation
Peptides are solubilized in DMSO at a concentration of 10 mg/ml and placed at −20 °C for long-term storage. Temporary peptide storage (<1 month) is recommended at 4 °C.
Pipette 50 μl of CM containing a desired peptide (at a final concentration of 10 μg/ml per well) into each well containing PBMCs. Gently tap the sides of the plate to evenly distribute the well components (see Notes 4 and 5).
Incubate the plate at 37 °C with 5 % CO2 for an optimal period of time, which is generally between 2 and 4 h (see Note 6).
Centrifuge the plate at 300 × g for 5 min at 4 °C.
Carefully aspirate the CM from wells while leaving the cell pellet intact.
3.3 RNA Isolation and cDNA Generation of Peptide-Stimulated PBMCs
Proceed with isolating genomic DNA-free RNA from each designated well as indicated by the RNeasy plus micro kit. The final column pass will result in 12 μl eluate (purified RNA in H2O). For short-term storage, maintain the purified RNA on ice (see Note 7).
Generate cDNA for each sample using the High Capacity RNA-to-cDNA Kit as recommended by the manufacturer. Briefly, add the 2× RT buffer, 20× enzyme mix, RNA sample, and nuclease-free H2O to 20 μl total volume per tube. Any unused RNA should be immediately stored at −80 °C (see Note 8).
Incubate the tube in a PCR thermocycler at 37 °C for 60 min followed by a stop reaction cycle at 95 °C for 5 min. The tube can be temporarily placed at 4 °C until use in a downstream qRT-PCR reaction. However, the generated cDNA should be held at −20 °C for long-term storage.
3.4 qRT-PCR Performance and Analysis
qRT-PCR primers used for SYBR® green technology must conform to several guidelines in order to guarantee specific and quality amplification. Primer length is recommended to be between 18 and 24 nucleotides and specifically amplify a target that is 50–150 bp long. Melting temperatures for primer pairs should be compatible (Tm of 58–60 °C) and contain approximately 50 % GC content. Additionally, primer pairs must be designed to avoid hybridization (i.e., primer-dimer amplification) and either anneal to exons with an internal intron region or span an exon/exon boundary. Primers are also usually dissolved in water at a working stock concentration of 20 μM, and qRT-PCR trial runs incorporating primers between 0.05 and 0.9 μM will typically yield optimum primer pair concentrations for qRT-PCR assay conditions.
Mix the SYBR® Green Master Mix, IFN-γ or CD8 forward/reverse primers, H2O, and cDNA together in the appropriate tube on a cold block following the specific guidelines of a qRT-PCR system as diagramed in Fig. 1. Assays should also include a no-template control (NTC) and no-reverse-transcriptase control in order to rule out contamination (see Notes 9–12).
-
The following cycling parameters for PCR amplification are utilized on the StepOnePlus™ Real-Time PCR System (Life Technologies) (with melting curve analysis immediately following in order to confirm the absence of nonspecific amplification):
20 s at 95 °C.
3 s at 95 °C followed by 30 s at 60 °C for 35 cycles.
Using specific software from the qRT-PCR system, assign a baseline range that demonstrates little to no fluorescent activity up to the cycle before amplification becomes evident (usually cycles 3–15). Additionally, modify the threshold level to capture Ct (threshold cycle) values in the linear portion of the amplification curve (see Fig. 2).
Following a successful qRT-PCR run, calculate IFN-γ gene expression values using an appropriate quantitation method (i.e., absolute or relative quantitation). We employ the comparative CT (ΔΔCt) method for relative quantitation and report IFN-γ expression (corrected to CD8 mRNA) as the relative fold change (increase or decrease) versus an HIV peptide-stimulated control sample as demonstrated in Fig. 3 (see Notes 13–15).
Fig. 1.
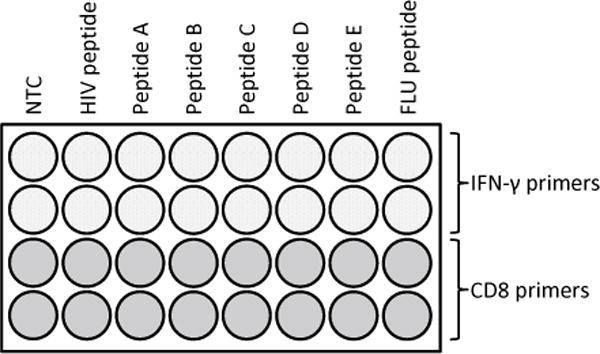
Example of a qRT-PCR reaction plate setup. After generating high-quality cDNA from peptide-stimulated cells, the qRT-PCR components (outlined in Subheading 3.3) must be added individually to the appropriate qRT-PCR tubes on a cold block. The diagrammed plate includes NTC wells for both IFN-γ and CD8 primers (minus cDNA) in order to affirm the absence of gene-specific amplification. Although IFN-γ primer products will provide index of peptide-specific gene activation in responder T cells, the data must first be normalized to CD8 mRNA expression levels in order to register peptide responsiveness to the presence of CD8+ T cells and to correct for interwell/interassay variability. A negative control peptide (HIV NEF) is used to establish the baseline (negative) IFN-γ response so that relative IFN-γ fold change differences can be calculated for peptides A–E following the comparative CT (ΔΔCt) method. This representative plate also includes positive control wells in which PBMCs were initially exposed to a virusderived peptide, such as FLU M1, against which a majority of individuals exhibit type 1 immunologic memory
Fig. 2.
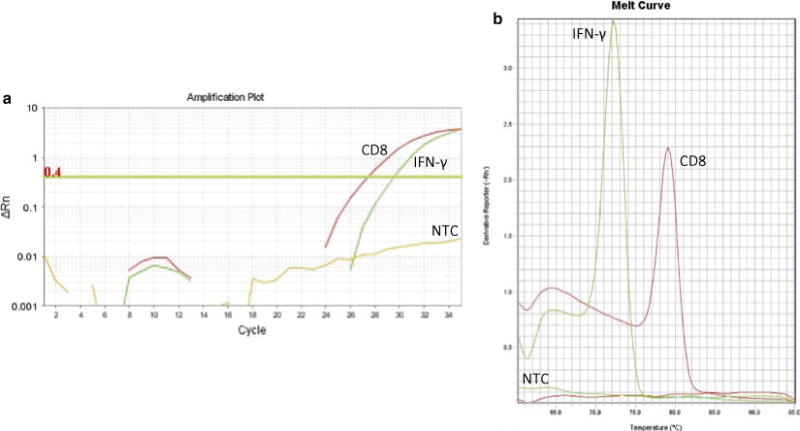
Representative qRT-PCR amplification and melting curve plots for the human IFN-γ- and CD8-specific amplicons. (a) CD8 and IFN-γ were amplified from cDNA of a normal HLA-A2+ human donor through qRT-PCR using the StepOnePlus™ Real-Time PCR System (Life Technologies). Ct values were obtained following baseline subtraction (cycles 3–15) and threshold assignment within the linear portion of the amplification curves. (b) Melting curve analysis revealed gene-specific products at 79 °C and 72 °C for the CD8 and IFN-γ primers, respectively. NTC wells containing either CD8 or IFN-γ primers (along with all other reaction components as indicated in Subheading 3.4, step 1) did not demonstrate observable double-stranded DNA products as determined by amplification and melting curve plots
Fig. 3.
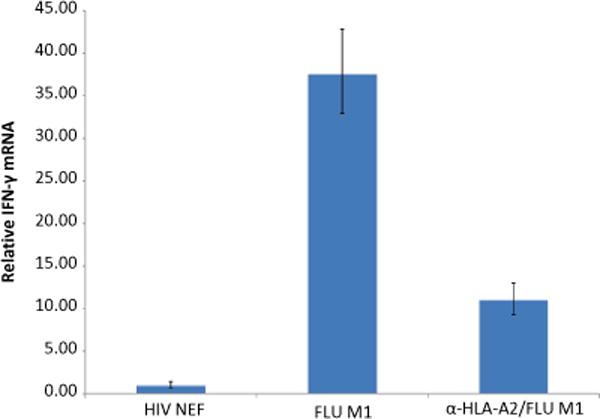
qRT-PCR can detect relative fold change differences in IFN-γ expression following HLA class I-restricted peptide stimulation. PBMCs from a normal HLA-A2+ donor were stimulated with 10 μg/ml of either HIV NEF (AFHHVAREL) or FLU M1 (GILGFVFTL) peptide for 2 h at 37 °C. In a parallel reaction, HLA class I molecules on PBMCs were first blocked using the anti-HLA-A2 antibody BB7.2 for 1 h prior to FLU M1 peptide stimulation. Cells were immediately lysed following a 2-h incubation period, with total RNA purified, and corresponding cDNA generated as detailed in Subheading 3.3. Following the procedure outlined in Subheading 3.4, qRT-PCR was performed in duplicate using primers specific to IFN-γ and CD8. IFN-γ Ct values were normalized to CD8 mRNA for all assay conditions, and final data are reported as the relative IFN-γ fold change compared to PBMCs stimulated with HIV NEF peptide using the comparative CT (ΔΔCt) method
Acknowledgments
This work was supported by NIH R01 grant CA140375 (W.J.S.) and a Postdoctoral Fellowship (PF-11-151-01-LIB) from the American Cancer Society (D.B.L.). The authors declare no conflicts of interest.
Footnotes
Although freshly harvested PBMCs are recommended, particularly for expected rare-event CD8+ T cell responses, we have successfully analyzed CD8+ T cell reactions from PBMCs cryopreserved (in 90 % fetal bovine serum/10 % DMSO) in liquid nitrogen. Frozen PBMCs are first thawed and maintained (at 4 × 10⁵ cells) in 96-well U-bottom plates in 150 μl CM overnight prior to being stimulated with peptides as in Subheading 3.2, step 1.
If erythrocyte contamination is evident in the harvested interphase layer following density gradient centrifugation, perform a red blood cell lysis step using ACK lysing buffer.
Duplicates are typically run for each peptide analyzed to conserve SYBR® green reagent and to limit PBMC material use in order to expand the range of peptide-specific responses that may be investigated. Assuming consistent pipetting technique, qRT-PCR Ct values should be well below a standard deviation of 0.5.
Since the goal of this method is to assess intrinsic CD8+ T cell responses in HLA-A2+ individuals, peptides should be 8–10 amino acids long and bind the HLA-A2 peptide domain. With appropriate modification, this method may be used for the analysis of antigen-specific CD4+ or CD8+ T cell responses in many species [12]. Our laboratory has successfully used a peptide prediction tool (http://www-bimas.cit.nih.gov/molbio/hla_bind/) to determine the potential immunogenic peptide sequences derived from proteins of interest based on HLA-binding affinity scores.
Situations may arise where resident antigen-presenting cells (APCs) in the plated PBMCs are either abnormally low or deficient in their ability to directly present exogenous peptide to CD8+ T cells (e.g., immunocompromised individual). In these cases, an artificial APC may be used to generate an adequate type 1 immunologic response [13, 14]. The HLA-A2+ TAP-deficient cell T2 (ATCC # CRL-1992) can be loaded with peptide for 3–4 h, added to individual wells containing PBMCs at a 5:1 E:T ratio (i.e., 8 × 10⁴ T2 cells per well), and centrifuged at 250 × g for 2 min as a modification to Subheading 3.2, step 1.
In preliminary studies, we observed that HLA-A2+ patient CD8+ T cells against the influenza (FLU) M1 peptide (e.g., GILGFVFTL) were generally rather high after 2 h of T cell stimulation in culture (see Fig. 3). This incubation time conforms to independent data supporting maximal IFN-γ transcript expression in responder T cells within a 2–4-h period, with IFN-γ mRNA levels dropping precipitously after this time point [5].
The RNeasy plus micro Kit calls for adding RLT buffer to disrupt and lyse cells. Owing to the volume constraints of wells in the 96-well U-bottom plate, cell pellets are resuspended in 200 μl RLT buffer and transferred to a sterilized 1.5 ml microcentrifuge tube containing 200 μl RLT buffer. Samples are then further homogenized by vortexing for 1 min.
We generally use 3 μl of RNA sample per cDNA conversion reaction. However, optimum RNA volumes are user dependent and should be determined empirically.
Although this qRT-PCR method employs SYBR® green to quantify PCR amplification, the use of an alternate fluorogenic strategy (i.e., TaqMan) may also be readily adopted, assuming that the appropriate primer/probe sets are designed/utilized [5, 13].
The qRT-PCR system usually recommends certain master mixes and consumables for optimum performance. We use the StepOnePlus™ Real-Time PCR System (Life Technologies) and incorporate the “Fast” setting for all qRT-PCR runs. As such, our laboratory incorporates the Fast SYBR® Green Master Mix along with MicroAmp® Fast tubes (all from Life Technologies) for Subheading 3.4, step 1.
In our experience, 2 μl of cDNA per qRT-PCR reaction is sufficient to amplify CD8 and IFN-γ mRNA within a run of 35 cycles (Fig. 2). However, the user should determine an optimum cDNA volume, particularly for low-copy genes.
- Forward—ACTTGTGGGGTCCTTCTCCT.
- Reverse—GTCTCCCGATTTGACCACAG.
- Forward—TGGAAAGAGGAGAGTGACAGAA.
- Reverse—TCTTTTGGATGCTCTGGTCAT.
Melting curve analysis following qRT-PCR reveals specific Tm values of approximately 79 °C and 72 °C for CD8 and IFN-γ, respectively (Fig. 2).
Absolute quantitation incorporates serial dilutions of a standard curve (of known quantity) in order to assign copy numbers to a gene of interest. Relative quantitation determines the fold change difference of a gene of interest in experimental samples relative to an untreated (i.e., normal) sample. To correct for qRT-PCR variability among samples, gene amplification values are typically normalized to a gene target that remains unchanged among experimental and normal groups (e.g., housekeeping gene expression).
CD8 is designated as the normalizer gene in order to correct for sample variations of IFN-γ expression. Since HLA-A2-restricted peptides are used for stimulation purposes, CD8+ T cells are expected to represent the primary effector cell population synthesizing IFN-γ mRNA. We have not observed substantial differences in CD8 mRNA levels pre/posttreatment in human PBMCs, indicating that CD8 transcript levels remain relatively constant among our patient cohorts. However, since CD8+ T cell frequencies in individuals change over time for a variety of reasons (e.g., pathogen insult, immunodeficiency), normalizing to CD8 mRNA maintains the sensitivity of the qRT-PCR assay as opposed to inappropriately normalizing to the expression of a housekeeping gene (e.g., β-actin) that remains stable over time regardless of a patient’s general health status.
References
- 1.Lemonnier FA. Evaluating CD8+ T cell responses in vitro. Methods Mol Biol. 2013;960:261–277. doi: 10.1007/978-1-62703-218-6_20. [DOI] [PubMed] [Google Scholar]
- 2.Betts MR, Brenchley JM, Price DA, De Rosa SC, Douek DC, Roederer M, Koup RA. Sensitive and viable identification of antigen-specific CD8+ T cells by a flow cytometric assay for degranulation. J Immunol Methods. 2003;281(1–2):65–78. doi: 10.1016/s0022-1759(03)00265-5. [DOI] [PubMed] [Google Scholar]
- 3.Rao A, Taylor JL, Chi-Sabins N, Kawabe M, Gooding WE, Storkus WJ. Combination therapy with HSP90 inhibitor 17-DMAG reconditions the tumor microenvironment to improve recruitment of therapeutic T cells. Cancer Res. 2012;72(13):3196–3206. doi: 10.1158/0008-5472.CAN-12-0538. [DOI] [PMC free article] [PubMed] [Google Scholar]
- 4.Berrien-Elliott MM, Jackson SR, Meyer JM, Rouskey CJ, Nguyen TL, Yagita H, Greenberg PD, DiPaolo RJ, Teague RM. Durable adoptive immunotherapy for leukemia produced by manipulation of multiple regulatory pathways of CD8+ T-cell tolerance. Cancer Res. 2013;73(2):605–616. doi: 10.1158/0008-5472.CAN-12-2179. [DOI] [PMC free article] [PubMed] [Google Scholar]
- 5.Kammula US, Marincola FM, Rosenberg SA. Real-time quantitative polymerase chain reaction assessment of immune reactivity in melanoma patients after tumor peptide vaccination. J Natl Cancer Inst. 2000;92(16):1336–1344. doi: 10.1093/jnci/92.16.1336. [DOI] [PubMed] [Google Scholar]
- 6.Wheeler CJ, Black KL, Liu G, Mazer M, Zhang XX, Pepkowitz S, Goldfinger D, Ng H, Irvin D, Yu JS. Vaccination elicits correlated immune and clinical responses in glioblastoma multiforme patients. Cancer Res. 2008;68(14):5955–5964. doi: 10.1158/0008-5472.CAN-07-5973. [DOI] [PubMed] [Google Scholar]
- 7.Xu Y, Theobald V, Sung C, DePalma K, Atwater L, Seiger K, Perricone MA, Richards SM. Validation of a HLA-A2 tetramer flow cytometric method, IFNgamma real time RT-PCR, and IFNgamma ELISPOT for detection of immunologic response to gp100 and-MelanA/MART-1 in melanoma patients. J Transl Med. 2008;6:61. doi: 10.1186/1479-5876-6-61. [DOI] [PMC free article] [PubMed] [Google Scholar]
- 8.Provenzano M, Mocellin S, Bonginelli P, Nagorsen D, Kwon SW, Stroncek D. Ex vivo screening for immunodominant viral epitopes by quantitative real time polymerase chain reaction (qRT-PCR) J Transl Med. 2003;1(1):12. doi: 10.1186/1479-5876-1-12. [DOI] [PMC free article] [PubMed] [Google Scholar]
- 9.Trojan A, Urosevic M, Hummerjohann J, Giger R, Schanz U, Stahel RA. Immune reactivity against a novel HLA-A3-restricted influenza virus peptide identified by predictive algorithms and interferon-gamma quantitative PCR. J Immunother. 2003;26(1):41–46. doi: 10.1097/00002371-200301000-00005. [DOI] [PubMed] [Google Scholar]
- 10.Trojan A, Giger R, Rist N, Speck RF. Impaired CD8+ T-cell reactivity against viral antigens in cancer patients with solid tumors. Infection. 2004;32(5):287–292. doi: 10.1007/s15010-004-3140-y. [DOI] [PubMed] [Google Scholar]
- 11.Schultz-Thater E, Frey DM, Margelli D, Raafat N, Feder-Mengus C, Spagnoli GC, Zajac P. Whole blood assessment of antigen specific cellular immune response by real time quantitative PCR: a versatile monitoring and discovery tool. J Transl Med. 2008;6:58. doi: 10.1186/1479-5876-6-58. [DOI] [PMC free article] [PubMed] [Google Scholar]
- 12.Hempel DM, Smith KA, Claussen KA, Perricone MA. Analysis of cellular immune responses in the peripheral blood of mice using real-time RT-PCR. J Immunol Methods. 2002;259(1–2):129–138. doi: 10.1016/s0022-1759(01)00502-6. [DOI] [PubMed] [Google Scholar]
- 13.Rentzsch C, Kayser S, Stumm S, Watermann I, Walter S, Stevanoviç S, Wallwiener D, Gückel B. Evaluation of pre-existent immunity in patients with primary breast cancer: molecular and cellular assays to quantify antigen-specific T lymphocytes in peripheral blood mononuclear cells. Clin Cancer Res. 2003;9(12):4376–4386. [PubMed] [Google Scholar]
- 14.Wang A, Chandran S, Shah SA, Chiu Y, Paria BC, Aghamolla T, Alvarez-Downing MM, Lee CC, Singh S, Li T, Dudley ME, Restifo NP, Rosenberg SA, Kammula US. The stoichiometric production of IL-2 and IFN-γ mRNA defines memory T cells that can self-renew after adoptive transfer in humans. Sci Transl Med. 2012;4(149):149ra120. doi: 10.1126/scitranslmed.3004306. [DOI] [PMC free article] [PubMed] [Google Scholar]
- 15.Schmittgen TD, Livak KJ. Analyzing real-time PCR data by the comparative C(T) method. Nat Protoc. 2008;3(6):1101–1108. doi: 10.1038/nprot.2008.73. [DOI] [PubMed] [Google Scholar]