Abstract
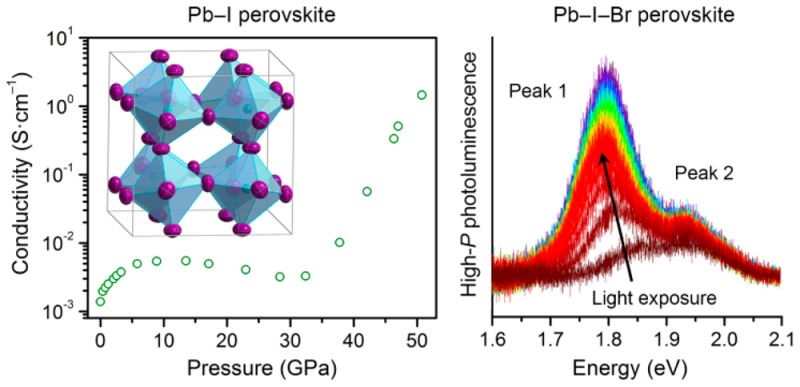
We report the first high-pressure single-crystal structures of hybrid perovskites. The crystalline semiconductors (MA)PbX3 (MA = CH3NH3+, X = Br– or I–) afford us the rare opportunity of understanding how compression modulates their structures and thereby their optoelectronic properties. Using atomic coordinates obtained from high-pressure single-crystal X-ray diffraction we track the perovskites’ precise structural evolution upon compression. These structural changes correlate well with pressure-dependent single-crystal photoluminescence (PL) spectra and high-pressure bandgaps derived from density functional theory. We further observe dramatic piezochromism where the solids become lighter in color and then transition to opaque black with compression. Indeed, electronic conductivity measurements of (MA)PbI3 obtained within a diamond-anvil cell show that the material’s resistivity decreases by 3 orders of magnitude between 0 and 51 GPa. The activation energy for conduction at 51 GPa is only 13.2(3) meV, suggesting that the perovskite is approaching a metallic state. Furthermore, the pressure response of mixed-halide perovskites shows new luminescent states that emerge at elevated pressures. We recently reported that the perovskites (MA)Pb(BrxI1–x)3 (0.2 < x < 1) reversibly form light-induced trap states, which pin their PL to a low energy. This may explain the low voltages obtained from solar cells employing these absorbers. Our high-pressure PL data indicate that compression can mitigate this PL redshift and may afford higher steady-state voltages from these absorbers. These studies show that pressure can significantly alter the transport and thermodynamic properties of these technologically important semiconductors.
Short abstract
Using the first high-pressure single-crystal structures of 3D hybrid perovskites, we track structural relaxation with compression, which leads to dramatic changes in color, photoluminescence, and electronic conductivity.
1. Introduction
Understanding correlations between pressure-induced structural and electronic changes can allow us to more precisely tune material properties through compression.1 Pressures on the gigapascal scale effect a wide variety of transformations in the structural,2 optical,3 magnetic,3a,4 and electronic transport5 properties of organic and inorganic solids. Furthermore, the compressibility of well-defined organic–inorganic hybrids can be modulated by fine-tuning both organic and inorganic components. In this regard, the effects of compression on crystalline hybrid perovskites are a subject of great interest. Pressure effects on layered Pb–I6 and Cu–Cl7 perovskites have been studied for several decades, and we recently reported pressure-induced conductivity in the 2D perovskite (EDBE)[CuCl4] (EDBE = 2,2′-(ethylenedioxy)bis(ethylammonium)).8 Structural information from the high-pressure phases of 2D Cu–Cl perovskites indicates that pressure can induce octahedral rotations and bond compression in the inorganic layers, leading to striking piezochromism7c,8 and changes in electronic conductivity.8 This suggests that pressure can generate similar changes in their 3D analogues (Figures 1 and 2).
Figure 1.
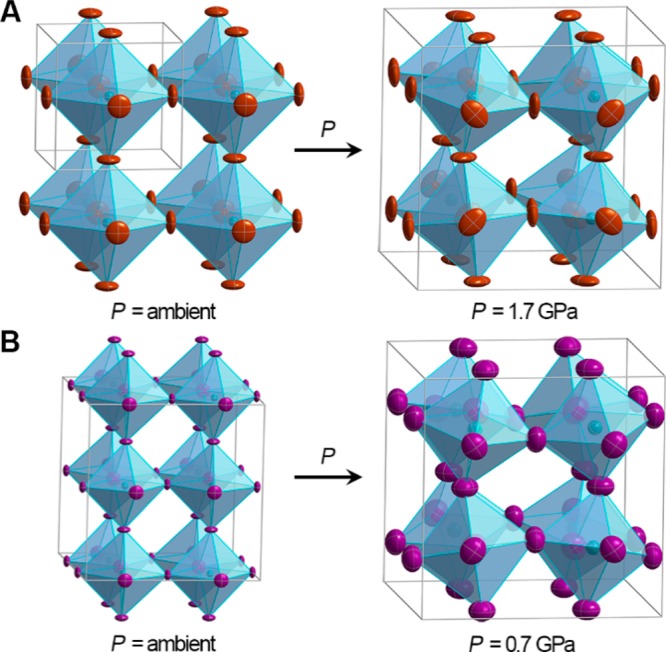
Single-crystal X-ray structures of (A) (MA)PbBr3 (MA = CH3NH3+) at ambient pressure (space group: Pm3̅m) and 1.7 GPa (Im3̅) and of (B) (MA)PbI3 at ambient pressure (Fmmm) and 0.7 GPa (Im3̅). Turquoise, purple, and brown ellipsoids represent Pb, I, and Br atoms, respectively. Disordered iodides and MA cations omitted for clarity. Thermal ellipsoids are drawn at the 50% probability level.
Figure 2.
Optical micrographs showing piezochromic transitions of (MA)PbBr3 (top) and (MA)PbI3 (bottom). The Pb–Br perovskite is in a 600 μm culet diamond-anvil cell (DAC) between 0.4 and 7.2 GPa and in a 300 μm culet DAC up to 46 GPa. The Pb–I perovskite is in a 400 μm culet DAC with Pt leads used for conductivity measurements. The cubic BN gasket surrounding the sample is transparent to visible light at high pressures.
The 3D hybrid perovskites (MA)PbX3 (MA = CH3NH3+, X = Br– or I–) are semiconductors that can be processed via solution-state film deposition and that exhibit exceptional properties for optoelectronic devices, including direct bandgaps, high carrier lifetime and charge mobility, and high photoluminescence efficiency.9 These properties have been exploited in their recent implementation as solar-cell absorbers,9 light-emitting diodes,10 and lasers.11 Therefore, the pressure response of the optical and electronic properties of these materials is of both fundamental and technological interest. Despite a study on their pressure–temperature phase relations over two decades ago,12 the effects of pressure on 3D hybrid perovskites are just beginning to be explored. Structural changes upon compression in (CD3ND3)PbBr3 have been studied through neutron powder diffraction up to ca. 2.8 GPa,13 and the photoluminescence (PL) of (MA)PbBr3 under pressures of up to ca. 5 GPa has been reported.14 Recent studies on electrical resistivity in (MA)PbBr3 upon compression up to 25 GPa and in a nanorod form of (MA)PbI3 up to ca. 8 GPa showed increases in resistivity.15 The compressibility of the 3D Sn–I perovskites up to ca. 5 GPa has also been investigated.16
Herein, we study the high-pressure properties of (MA)PbI3, (MA)PbBr3, and (MA)Pb(BrxI1–x)3 (x = 0.2, 0.4, and 0.6) up to pressures of 51 GPa. Using atomic coordinates obtained from single-crystal structures in the high-pressure phases of (MA)PbI3 and (MA)PbBr3, we track structural changes that occur with compression. We correlate this structural information to changes in the compressed materials’ PL, color, electronic structure, and electronic conductivity and show that (MA)PbI3 likely approaches a metallic transition at high pressure. We also find that applied pressure can alter light-induced dynamics in mixed-halide perovskites.
2. Results and Discussion
2.1. Structural Evolution upon Compression
The 3D perovskites (MA)PbBr3 and (MA)PbI3 form cubic or pseudocubic lattices consisting of anionic networks of corner-sharing lead–halide octahedra. Here, each MA cation occupies the body center of a cube defined by eight lead–halide octahedra. In order to accurately track pressure-mediated structural changes, we first collected ambient-pressure single-crystal X-ray diffraction (SCXRD) structures of (MA)PbBr3 and (MA)PbI3 (Figure 1). The Pb–Br perovskite crystallizes in the cubic space group Pm3̅m,17 and we obtained a good structure solution (R1 = 1.53%). The Pb–I analogue has been reported to crystallize under ambient conditions in several tetragonal space groups such as I4/mcm,18I4cm,19 or I4/m,20 where twinning has complicated space-group assignment.21 We obtained the best structure solution (R1 = 5.55%) with the orthorhombic Fmmm space group as explained below. We then investigated structural changes in the Pb–Br and Pb–I perovskites upon compression through high-pressure single-crystal and powder X-ray diffraction (PXRD) using synchrotron radiation.
2.1.1. High-Pressure Single-Crystal X-ray Diffraction (SCXRD)
We loaded high-quality single crystals of (MA)PbI3 and (MA)PbBr3 in Merrill–Bassett-type diamond-anvil cells (DACs) with a perfluorinated polyether pressure medium, which is hydrostatic up to ca. 2 GPa.22 High-pressure neutron powder diffraction measurements have shown that the Pb–Br perovskite13 undergoes a phase transition during compression past ca. 0.9 GPa from a low-pressure α phase to a high-pressure β phase, and our PXRD data (section 2.1.2) show a similar phase transition for the Pb–I perovskite at ca. 0.3 GPa. We obtained complete SCXRD structures for the β phases of the Pb–I (P = 0.7 GPa, R1 = 9.49%) and Pb–Br (P = 1.7 GPa, R1 = 6.07%) perovskites (Figures 1 and 3). Our data indicate that the cubic space group Im3̅ is consistent with the observed reflections for the β phase in both the Pb–Br and Pb–I perovskites. The predicted PXRD patterns based on the single-crystal structures agree well with experimental PXRD patterns at similar pressures (Figures S4 and S5). Using atomic coordinates from ambient-pressure and high-pressure SCXRD, we also performed Rietveld refinements on PXRD patterns for the Pb–I and Pb–Br perovskites over a range of pressures in their α and β phases (see Supporting Information for details). We can therefore track structural evolution of the perovskites using precise atomic coordinates over finer pressure steps as detailed below.
Figure 3.
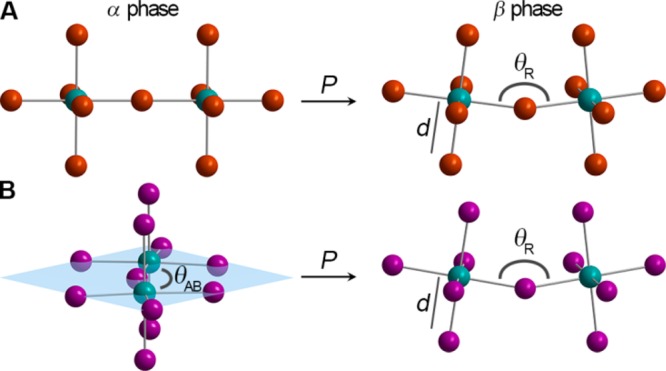
Fragments of the inorganic lattices in (A) (MA)PbBr3 and (B) (MA)PbI3 in their ambient-pressure α (left) and high-pressure β phases (right). Areas of structural distortion upon compression are the Pb–X–Pb angle (X = Br or I) resulting from octahedral rotation about the [001] direction (θAB), the Pb–X–Pb angle resulting from octahedral rotation about the [100], [010], and [001] directions (θR), and the Pb–X bond length (d).
Within the Pm3̅m α phase of (MA)PbBr3 all Pb–Br–Pb angles (θR) are 180° (Figure 3A). Therefore, compression only contracts the lead–halide bonds. However, a sudden onset of octahedral tilting occurs at the α–β transition (Table S2). Upon compression past the α–β transition, the θR angle decreases to 161.799(2)° at 1.0 GPa resulting from octahedral rotation about the [100], [010], and [001] crystallographic directions. This constitutes an a+a+a+ tilt according to established descriptors of octahedral tilting in perovskites.23 The Pb–Br distance reduces from 2.9664(7) to 2.9406(1) Å over the same pressure range (ambient pressure to 1.0 GPa). Further volume reduction due to compression in the β phase occurs with a combination of additional octahedral tilting and bond contraction.
The ambient pressure α phase for (MA)PbI3 was determined to be orthorhombic, despite its significant tetragonal character. Two of the three iodide positions displayed nonellipsoidal electron density, indicating disorder. These two sites would have been equivalent in a tetragonal space group, but the disorder is distinct in each site. The assigned orthorhombic space group, Fmmm, differs from previously reported space groups,18−21 and a detailed discussion of the refinement is provided in the Supporting Information. The structure shows a 180° Pb–I–Pb angle along the c axis when considering the iodide positions with the highest occupancy (75%). A torsional rotation of each Pb–I octahedron relative to its neighboring octahedra along the c axis (an a0a0a– tilt) and deviation from perfect local octahedral symmetry cause a distortion in the inorganic framework within the ab plane. This distortion yields in-plane Pb–I–Pb angles (θAB, Figure 3B) of 158.185(1)° and 168.189(1)°. Distances between Pb and I (including disordered iodide positions) range from 3.1462(7) to 3.199(6) to give a weighted average of 3.163(2) Å in the slightly irregular octahedra. In the α phase of (MA)PbI3, volume reduction occurs mostly through Pb–I bond contraction (Table S3). With compression to 0.6 GPa (after the α–β transition), the torsional rotation disappears and the structure undergoes an a+a+a+ tilt to yield a very similar structure to the β phase of the Pb–Br perovskite. Each iodide in the β phase is best modeled as disordered over six crystallographic positions. Using an average position for the iodide, the Pb–I–Pb θR angle is 154.9(4)° and the Pb–I distance is 3.18(1) Å, indicating that octahedral tilts are the major avenue for volume reduction in transitioning to the β phase. With further compression after the α–β transition, bond lengths continue to decrease in conjunction with more severe tilting. The electronic consequences of these structural changes are discussed in sections 2.2.1, 2.2.2, and 2.3.
The a+a+a+ tilt in perovskites generates two inequivalent A sites. It is therefore typically seen in perovskites containing two different A-site metals with different coordination modes.23b In the case of β-(MA)PbX3 (X = I or Br), the rotational flexibility of the MA cation allows for two different types of disorder in the two distinct A sites (Figure S6). This may be facilitated by different hydrogen bonding interactions between MA and the inorganic lattice in the two A-site cavities.
2.1.2. High-Pressure Powder X-ray Diffraction (PXRD)
PXRD measurements were obtained using DACs loaded with helium as a pressure-transmitting medium as it provides hydrostatic conditions up to at least 12.1 GPa (if not higher) and remains quasi-hydrostatic even at higher pressures.22Figure 4 shows PXRD patterns obtained at pressures up to 9.2 and 9.5 GPa for (MA)PbI3 and (MA)PbBr3, respectively. We observe the onset of the α–β phase transition at 0.3 GPa for (MA)PbI3 and 0.9 GPa for (MA)PbBr313 and material amorphization at pressures above ca. 2.7 GPa. With further compression, a mostly amorphous γ phase is maintained up to pressures of at least 48.5 and 46.4 GPa for the Pb–I and Pb–Br perovskites, respectively (Figures S7 and S8). Despite the largely amorphous diffraction signature in the γ phase, several distinct Bragg reflections still remain, indicating that some degree of long-range order is retained up to ca. 50 GPa. Both materials recover their original α phase with minimal hysteresis upon decompression. Similar high-pressure PXRD studies on the mixed-halide perovskites (MA)Pb(BrxI1–x)3 (x = 0.2 and 0.6) (Figures S9 and S10, respectively) show that they behave in a similar manner to (MA)PbBr3, albeit with expanded lattice constants that scale with iodide content. The β-phase space group Im3̅ obtained through our SCXRD analysis yields good peak indexing and profile matching of our high-resolution PXRD patterns for the Pb–Br, Pb–I, and mixed-halide perovskites.
Figure 4.
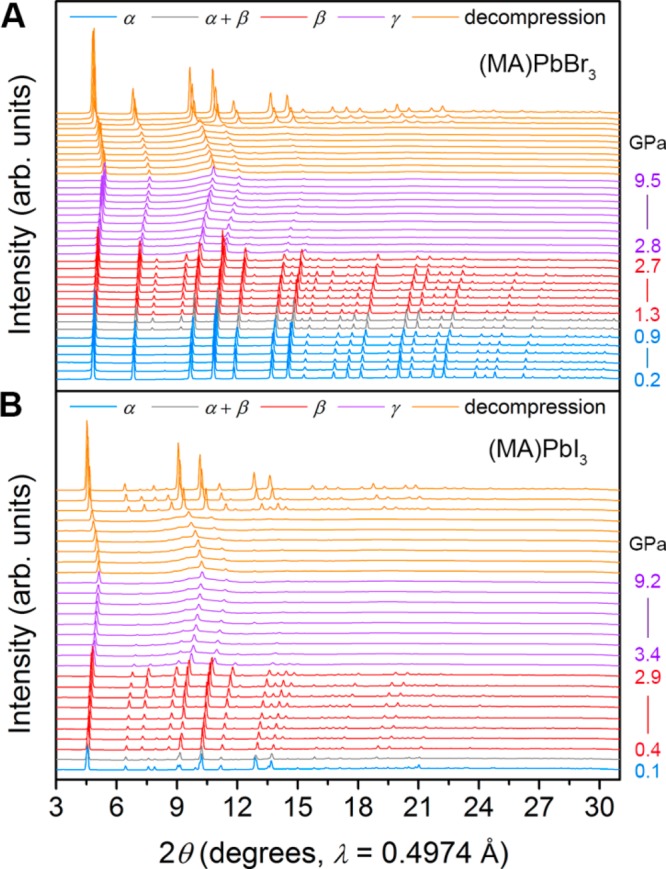
(A) PXRD patterns of (MA)PbBr3 upon compression up to 9.5 GPa. Pressure ranges (GPa) for each phase: α (0.2–0.9), α + β (1.0–1.1), β (1.3–2.7), and γ (2.8–9.5). (B) PXRD patterns of (MA)PbI3 upon compression up to 9.2 GPa. Pressure ranges (GPa) for each phase: α (ca. 0–0.1), α + β (0.3), β (0.4–2.9), and γ (3.4–9.2).
2.1.3. Material Compressibility
Using lattice parameters derived from PXRD patterns for (MA)PbBr3, (MA)PbI3, and (MA)Pb(BrxI1–x)3 (x = 0.2 and 0.6), we accounted for pressure-induced stiffening of the perovskite lattices by fitting their pressure–volume (P–V) relationships to the second-order Birch–Murnaghan equation of state (2OBM EOS, Figure 5). The fit for the α phase of (MA)PbBr3 yielded a K0 value (bulk modulus at ambient pressure) of 17.6(4) GPa, similar to reported values for (CD3ND3)PbBr3,13 and 3D Sn–I16 and 2D Cu–Cl7c,8 hybrid perovskites. Fits to the 2OBM EOS for the β phase of the Pb–Br perovskite gave K0 = 12(1) GPa, comparable to the value for the deuterated analogue.13 Our structural analysis shows that volume reduction in the α phase can only occur through Pb–Br bond contraction, while compression in the β phase also occurs through octahedral tilting. This explains the unusual result that the high-pressure β phase in (MA)PbBr3 is more compressible than its low-pressure α phase.
Figure 5.
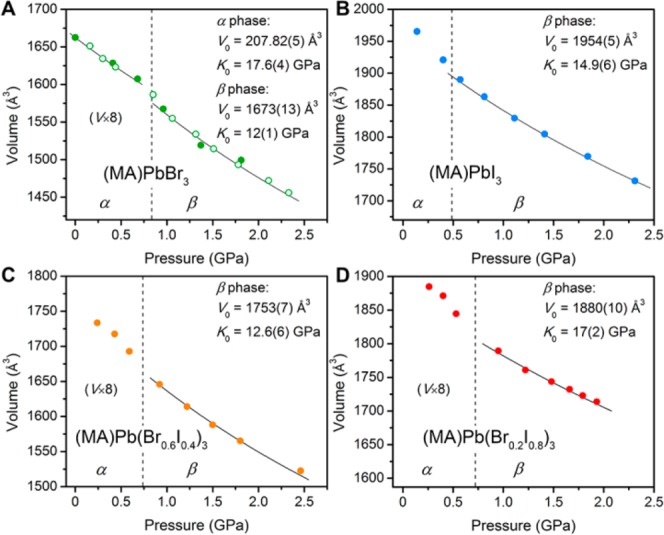
Unit-cell volume changes with pressure for (A) (MA)PbBr3, (B) (MA)PbI3, (C) (MA)Pb(Br0.6I0.4)3, and (D) (MA)Pb(Br0.2I0.8)3. Second-order Birch–Murnaghan EOS fits (black lines) and fit parameters are shown. Open and closed symbols represent data from separate measurements.
Since the α–β phase transition for (MA)PbI3 occurs at ca. 0.3 GPa, we were unable to obtain enough PXRD patterns within the α phase to determine its EOS. In its β phase, a fit to the 2OBM EOS yields K0 = 14.9(6) GPa. This indicates that, in their β phases, (MA)PbI3 is less compressible than (MA)PbBr3. The x = 0.2 and x = 0.6 mixed-halide perovskites gave β-phase K0 values of 17(2) and 12.6(6) GPa, respectively, indicating that higher iodide content reduces their lattice compressibility. Broad background features begin to appear in the PXRD patterns of all samples at pressures close to amorphization, so we did not include these data in the EOS fits as their P–V behavior may be unreliable.
2.2. Electronic Structure Evolution upon Compression
We measured high-pressure PL spectra of (MA)PbI3 and (MA)Pb(BrxI1–x)3 (x = 0.2, 0.4, and 0.6) in helium-loaded DACs in order to directly compare PL trends to structural trends derived from our diffraction experiments. We further used these high-pressure structural data to direct calculations tracking changes in electronic structure upon compression.
2.2.1. High-Pressure Single-Crystal PL of (MA)PbI3
We collected PL spectra from a single crystal of (MA)PbI3 during compression from ambient conditions to 3.1 GPa followed by decompression (Figure 6). PL intensities increase at elevated pressures (up to 2.7 GPa) relative to the ambient-pressure spectrum. The PL energy changes with compression correlate well with the structural evolution we observed through our high-pressure diffraction studies. Here, Pb–I bond contraction suggests greater orbital overlap and consequently increased band dispersion and reduced bandgap while octahedral rotations can decrease orbital overlap, reduce band dispersion, and therefore increase the bandgap. The PL energy redshift in the α phase between ambient pressure and 0.3 GPa is consistent with the bond contraction we observe with compression in the α phase. The PL energy sharply blueshifts during the α–β phase transition, coincident with the onset of increased octahedral tilting. Further compression in the β phase causes more redshifting of the PL band from 0.9 to 2.7 GPa, indicating that Pb–I bond contraction exerts a stronger effect on the electronic structure than octahedral tilts in this regime. Then just before the PL disappears, another sharp increase in PL energy occurs, albeit with reduced PL intensity, above pressures where we see increased octahedral tilting in the β phase and higher baseline signals in PXRD patterns. The disappearance of PL intensity coincides with an increase in amorphous baseline signals and the disappearance of most of the reflections in the diffraction patterns, indicating the emergence of nonradiative PL decay pathways in the γ phase. PL of (MA)PbBr3 powder under pressures of up to ca. 5 GPa has been reported to also show a redshift in its α phase with compression followed by a blueshift above the α–β phase transition.14 To further examine if these pressure-induced shifts in PL energy represent changes in the material’s fundamental bandgap (instead of the PL originating from trap/defect states) we performed pressure-dependent electronic-structure calculations to assess how the bandgap of (MA)PbI3 varied with compression.
Figure 6.
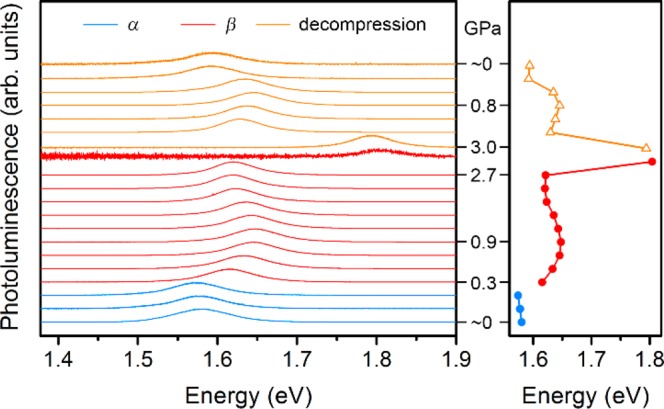
Left: Normalized photoluminescence (PL) spectra for a single crystal of (MA)PbI3 as a function of pressure. Right: Pressure response of the PL peak energy.
2.2.2. High-Pressure Electronic Structure of (MA)PbI3
We performed density functional theory (DFT) calculations to track the electronic band structure of the Pb–I lattice in (MA)PbI3 as it is compressed (Figure 7). Atomic coordinates derived from SCXRD and Rietveld refinements were used as initial inputs for the calculations. For the β phase, the rotational disorder of the MA cation required substitution of a Cs+ cation to mimic the charge distribution. A comparison of the α-phase band structures at 0 GPa calculated using a MA or a Cs+ cation shows very similar band structures that differ in bandgap by only ca. 40 meV (Figure S13). This indicates minimal contribution of the cation to the valence-band maximum and conduction-band minimum, calculated with constrained lattice relaxation. Unlike in the β phase, there is no rotational disorder of MA in the α phase. Therefore, the error in predicted bandgap should be even smaller in the β phase when substituting Cs+ for MA. A complete description of substitutional and structural constraints imposed for calculations is provided in the Supporting Information.
Figure 7.
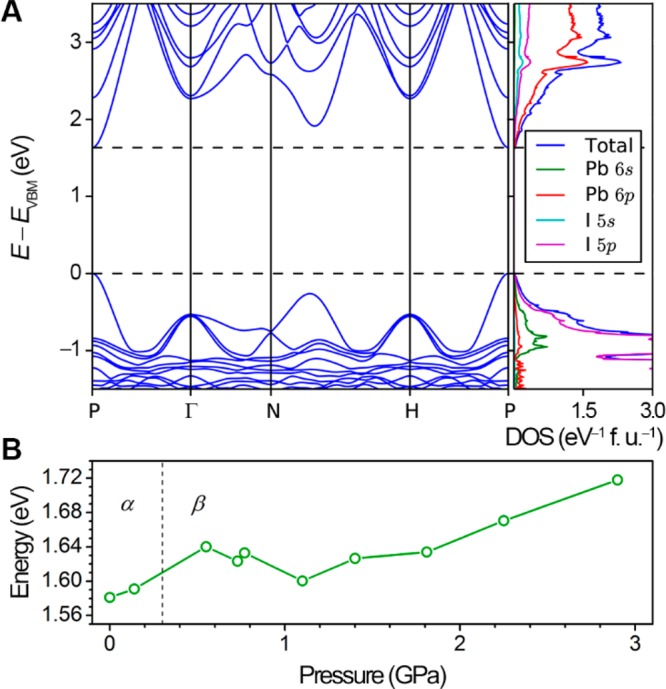
(A) Representative β-phase band structure and atom-projected density of states (DOS) for (MA)PbI3 (P = 1.8 GPa). (B) Calculated bandgap for the perovskite as a function of pressure.
The slight redshift in PL energy of ca. 3 meV upon increasing pressure to 0.1 GPa in the α phase is below the accuracy of the bandgap predictions and is not reproduced by the calculations. The calculated bandgap increases at the α–β transition, in good agreement with experiment (Figure 7B). The bandgap redshift at ca. 1.1 GPa is slightly overestimated in the calculations. The inability to fully model the 6-fold disorder of the iodide as well as the substitution of Cs+ for the rotationally disordered MA likely accounts for the deviation between experimental PL energies and calculated bandgaps. Similar to experiment, the predicted bandgaps blueshift with further compression, albeit with an earlier onset pressure for this second blueshift. The overall experimental trends are well captured in these calculations: the calculated bandgap blueshifts at the α–β phase transition, then redshifts with further compression, and finally blueshifts at the highest pressures just before the β–γ transition. Furthermore, the bandgap energies at each pressure are close to the PL energies.
A representative atom-projected density of states and electronic dispersion of β-(MA)PbI3 at 1.8 GPa are shown in Figure 7A, showing a direct bandgap at P (1/2,1/2,1/2), as well as the dominant I 5p character of the valence-band maximum and Pb 6p character of the conduction-band minimum. The DFT bandgap has been corrected by a derivative discontinuity term.24 The width of the bands and hence also the prediction of the sharpness of the valence band edge are of only qualitative value, since the derivative discontinuity correction is used only to shift empty states rigidly up in energy. Band structures and density of states for the α phase are shown in Figure S13.
2.2.3. High-Pressure PL of (MA)Pb(BrxI1–x)3
We recently reported on reversible redshifts in PL energy of mixed-halide perovskites with light exposure.25 Upon visible-light soaking for less than 1 min, the PL energies for films of (MA)Pb(BrxI1–x)3 (0.2 < x < 1) converge to ca. 1.7 eV. We proposed that this may be caused by halide segregation during illumination. If bromide- and iodide-rich domains form in the light-exposed film, the lower-bandgap iodide-rich domains can serve as recombination traps yielding low-energy PL even in perovskites with higher bromide content. This may explain why high voltages have been difficult to attain in solar cells employing these absorbers despite their higher bandgaps compared to (MA)PbI3.18 Because our proposal requires halide migration, we reasoned that the increased stiffness of the compressed lattice should affect ion transport and therefore the PL energy shift.
We measured PL spectra over the course of ca. 150 s for (MA)Pb(BrxI1–x)3 (x = 0.2, 0.4, and 0.6) powder compressed within helium-loaded DACs. This experiment was repeated from ambient conditions to pressures at which the PL disappeared. The light-induced PL redshift is more rapid for powders than for films. Compiled spectra at four selected pressures are shown for the x = 0.6 material in Figure 8. Overall, the PL intensity decreases with increasing pressure. At 0.2 GPa the PL band redshifts and increases in intensity with increased duration of light exposure (Figure 8A), similar to its ambient-pressure behavior. At 0.6 GPa, however, a second, higher-energy peak (hereafter designated as peak 2) is visible, which is invariant with light soaking (Figure 8B). The lower-energy peak (peak 1) still redshifts with light exposure. Upon increasing pressure to 0.7 GPa, peak 1 is barely visible and peak 2 has increased in relative intensity (Figure 8C). At 0.9 GPa only peak 2 is visible (Figure 8D), and above ca. 1.6 GPa no PL is visible from the sample. Importantly, the energy to which peak 1 redshifts with light exposure increases with increasing pressure (Figure 8E). Furthermore, the appearance of peak 2, whose energy is invariant with light-exposure time, indicates a new photoluminescent state either created or revealed by pressure.
Figure 8.
PL spectra recorded at ca. 8 s intervals for (MA)Pb(Br0.6I0.4)3 showing the PL evolution with light soaking, ranging from ca. 0 s (dark red) to ca. 150 s (purple). Spectra displayed were obtained at (A) 0.2 GPa, (B) 0.6 GPa, (C) 0.7 GPa, and (D) 0.9 GPa. (E) Pressure dependence of peak 1’s saturation energy (energy to which the PL band asymptotes with light exposure) for (MA)Pb(Br0.6I0.4)3.
Much like the x = 0.6 mixed-halide perovskite, a high-energy peak (peak 2) also emerges at elevated pressures for the x = 0.4 material, but with smaller separation from peak 1 (Figure S14). In other respects, this perovskite’s PL energy shifts mimic the x = 0.6 material. At ambient pressure, the PL energies of the 0.2 < x < 1 perovskites converge with light exposure to ca. 1.7 eV, which coincides with the PL energy of the x = 0.2 member. Therefore, we do not see a significant shift in PL energy for the x = 0.2 perovskite with light exposure at atmospheric pressure.25 Similarly, we see only a slight shift in PL energy for the compressed x = 0.2 perovskite with light soaking (Figure S16). Upon compression, this material behaves like (MA)PbI3. However, the x = 0.2 perovskite shows an increase in PL intensity with light exposure at pressures below 1 GPa, similar to other mixed-halide perovskites.
The higher-energy PL peak (peak 2) for the x = 0.4 and 0.6 perovskites appears at 0.3 and 0.6 GPa, respectively, close to their α–β phase transitions. For each perovskite, peak 2 shifts in energy only as a function of pressure and not with light exposure. Peak 2 thus evolves with pressure in a similar manner to the PL from the pure bromide or iodide perovskites—with its energy simply modulated by halide stoichiometry. To illustrate this trend, Figure S18 shows the pressure evolution of the initial PL energies (before light soaking) of peak 1 and the pressure evolution of peak 2 for (MA)Pb(BrxI1–x)3 (x = 0.4 and 0.6). The pressure dependence of the PL energies of (MA)PbI3 and (MA)PbBr3 is also shown for comparison. We see that the mixed-halide perovskites show intermediate pressure dependence compared to the pure-halide perovskites, where the degree of PL blueshift with pressure scales approximately with bromide content.
These results suggest that peak 2, which is visible only at high pressures, may arise from the native material where halide segregation is suppressed by lattice compression in the β phase. Furthermore, even when considering peak 1, higher-energy steady-state PL is obtained at higher pressure (Figure 8E). The formation of low-energy trap states upon light exposure can impede the use of these mixed-halide perovskites in high-voltage solar cells. Although application of very high pressures decreases PL intensity, our results show that some amount of material compression can mitigate this PL redshift. This compression may be attained through mechanical or chemical means. For example, chemical pressure exerted through ion substitution has been shown to modulate the related structure of AMnF4 (A = Cs, Rb, K) in a similar manner to mechanical pressure.26 Theoretical frameworks have been developed for correlating chemical pressure exerted through steric compression to the effects of mechanical pressure.27 Therefore, A-site cation substitution,28 which has been shown to alter the bandgap of 3D hybrid perovskites,29 may provide additional means of tuning lead–halide perovskites through chemical pressure.
2.3. Electronic Conductivity upon Compression
The 3D Pb–Br and Pb–I hybrid perovskites are semiconductors with bandgaps of ca. 2.3 and 1.6 eV, respectively. Accordingly, (MA)PbBr3 is orange and (MA)PbI3 is black at ambient pressure. During the α–β phase transition, the Pb–Br perovskite lightens in color, indicating a widening of the optical bandgap (Figure 2). This is consistent with the blueshift in the PL in this pressure range and the higher degree of interoctahedral tilting in the SCXRD structure for the β phase. We do not see clear color changes in the optical micrographs of the Pb–I perovskite during the α–β phase transition, although the material becomes redder in color and more translucent beginning at ca. 2.6 GPa (Figure 2), close to pressures where we measured a second PL blueshift and where the β–γ phase transition occurs. At pressures above ca. 17 GPa for (MA)PbBr3 and above ca. 9 GPa for (MA)PbI3, their color starts to become significantly darker, suggesting a reduction in optical bandgap. We therefore measured the conductivity of the Pb–I perovskite compressed within a DAC over a 51 GPa pressure range.
The dc conductivity measurements on compressed (MA)PbI3 are shown in Figure 9. The first point measured is likely in the MPa range because of the slight compression imparted by the DAC and from initial packing of the sample. At this lowest pressure, the conductivity was ca. 1 × 10⁻³ S/cm. This value is significantly higher than the reported conductivity value for (MA)PbI3 of ca. 2 × 10⁻⁸ S/cm at ambient pressure.30 This could be due to excellent interparticle contact resulting from the elevated pressure. Furthermore, based on its structural response to pressure, (MA)PbI3 is very sensitive to small pressure increases, which may increase conductivity. With compression to ca. 5 GPa, conductivity increases to approximately 6 × 10⁻³ S/cm, reaches a plateau, and then decreases upon further compression to ca. 30 GPa. At higher pressures we observe a dramatic increase in conductivity, leading to a maximum of 1.5 S/cm at 51 GPa. We measured the temperature dependence of the conductivity at 47 and 51 GPa (Figure S19 and Figure 9, respectively). At 47 GPa, the conductivity follows Arrhenius behavior with a calculated activation energy of conduction (Ea) of 19.0(8) meV, which is comparable to kT at room temperature. At 51 GPa the Ea reduces to 13.2(3) meV, suggesting that the material is approaching a metallic state. The amorphous and crystalline features in the γ phase evolve monotonically with increasing pressure above 2.7 GPa up to ca. 50 GPa (Figure S7). This suggests that the sharp increases in conductivity above 30 GPa are not associated with a first-order structural transition. High conductivity requires large carrier concentration and/or high carrier mobility. Therefore, the large increase in conductivity could result from a decrease in bandgap and increase in band dispersion (decrease in carrier effective mass) upon increased orbital overlap with compression.31 Further compression may lead to truly metallic behavior through bandgap closure.
Figure 9.
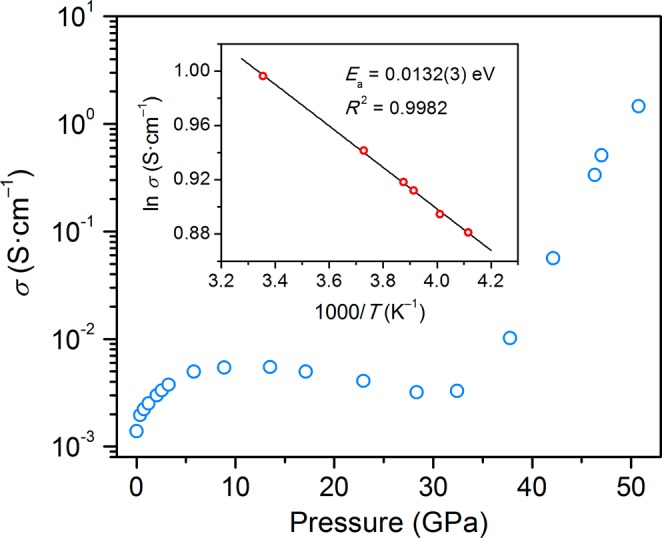
Electronic conductivity as a function of pressure for (MA)PbI3. Inset: Arrhenius fit of the temperature dependence of the conductivity at 51 GPa, which gives an activation energy for conduction (Ea) of 13.2(3) meV.
3. Conclusions
Applied pressure can be used to systematically fine-tune the optical and electronic properties of lead–halide hybrid perovskites, which have shown great utility in photovoltaics and other optoelectronics. Atomic coordinates obtained from the first high-pressure single-crystal structures of hybrid perovskites and Rietveld refinements of high-quality PXRD data allow us to track structural changes in (MA)PbBr3 and (MA)PbI3 upon compression. In the low-pressure α phase of the Pb–I and Pb–Br perovskites, significant volume reduction occurs through lead–halide bond compression. This accounts for the PL redshift in (MA)PbI3 at higher pressures in the α phase as bond compression increases orbital overlap and band dispersion and thereby decreases the optical bandgap. At the α–β phase transition, however, we observe the onset of octahedral tilting. This explains the abrupt blueshift in PL energy at the phase transition as octahedral tilting decreases orbital overlap, leading to narrower bands and a widening of the bandgap. Volume reduction in the β phase occurs through both bond compression and octahedral tilting. These structural and optical trends in (MA)PbI3 are well captured in the pressure dependence of the predicted bandgaps obtained through DFT calculations. Conductivity measurements obtained within a DAC show that pressure decreases the resistivity of (MA)PbI3 by 3 orders of magnitude. We measure a conductivity of 1.5 S/cm at 51 GPa with an activation energy for conduction of only 13.2(3) meV, suggesting that the perovskite may be close to a semiconductor-to-metal transition. Notably, all structural and optical transformations are reversible even after partial material amorphization during compression above 50 GPa. Our investigations into the high-pressure properties of the mixed-halide perovskites (MA)Pb(BrxI1–x)3 (x = 0.2, 0.4, and 0.6) show new photoluminescent states that emerge upon compression. We recently reported on reversible light-induced trap formation in (MA)Pb(BrxI1–x)3 (0.2 < x < 1) that can impede their utilization as absorbers in high-voltage solar cells.25 Our results suggest that pressures of less than 1 GPa, applied through mechanical or chemical means, offer a route for mitigating this effect and allowing for higher voltages to be realized from these absorbers.
The dramatic pressure response of these compressible materials indicate that lattice strain, mechanical pressure, or chemical pressure may provide further means of realizing new thermodynamic and transport properties in these versatile solids.
Acknowledgments
Work by A.J. and H.I.K. was funded by the National Science Foundation CAREER Award DMR-1351538 and the Global Climate and Energy Project (GCEP). Work by Y.L. and W.L.M. was supported through the Department of Energy through the Stanford Institute for Materials & Energy Science DE-AC02-76SF00515. A.J. thanks the Satre Family for the Stanford Interdisciplinary Graduate Fellowship. Work by J.V. was supported by the U.S. Department of Energy, Office of Sciences, Office of Basic Energy Sciences via the SUNCAT Center for Interface Science and Catalysis. High-pressure single-crystal and powder XRD data were collected at beamline 12.2.2 at the ALS and ambient-pressure single-crystal XRD data were collected at beamline 11.3.1. The ALS is supported by the Director, Office of Science, Office of Basic Energy Sciences, of the U.S. Department of Energy under Contract No. DE-AC02-05CH11231. The high-pressure facilities at the ALS are supported by COMPRES, the Consortium for Materials Properties Research in Earth Sciences under NSF Cooperative Agreement EAR 11-57758. We gratefully acknowledge Simon Teat, Kevin Gagnon, and Martin Kunz for assistance with XRD studies. We also thank Diego Solis-Ibarra, Emma Dohner, and Abraham Saldivar-Valdes for experimental assistance.
Supporting Information Available
The Supporting Information is available free of charge on the ACS Publications website at DOI: 10.1021/acscentsci.6b00055.
Experimental and computational details, crystallographic information, and spectra (PDF)
Room-temperature CIF for (MA)PbI3 at ambient pressure (CIF)
Room-temperature CIF for (MA)PbI3 at 0.7 GPa (CIF)
Room-temperature CIF for (MA)PbBr3 at ambient pressure (CIF)
Room-temperature CIF for (MA)PbBr3 at 1.7 GPa (CIF)
The authors declare no competing financial interest.
Supplementary Material
References
- Tan J. C.; Cheetham A. K. Mechanical properties of hybrid inorganic-organic framework materials: establishing fundamental structure-property relationships. Chem. Soc. Rev. 2011, 40, 1059–1080. 10.1039/c0cs00163e. [DOI] [PubMed] [Google Scholar]
- a Scelta D.; Ceppatelli M.; Santoro M.; Bini R.; Gorelli F. A.; Perucchi A.; Mezouar M.; van der Lee A.; Haines J. High pressure polymerization in a confined space: conjugated chain/zeolite nanocomposites. Chem. Mater. 2014, 26, 2249–2255. 10.1021/cm500061f. [DOI] [Google Scholar]; b Kim D. Y.; Stefanoski S.; Kurakevych O. O.; Strobel T. A. Synthesis of an open-framework allotrope of silicon. Nat. Mater. 2015, 14, 169–173. 10.1038/nmat4140. [DOI] [PubMed] [Google Scholar]; c Kawamoto T.; Fujita K.; Yamada I.; Matoba T.; Kim S. J.; Gao P.; Pan X.; Findlay S. D.; Tassel C.; Kageyama H.; Studer A. J.; Hester J.; Irifune T.; Akamatsu H.; Tanaka K. Room-temperature polar ferromagnet ScFeO3 transformed from a high-pressure orthorhombic perovskite phase. J. Am. Chem. Soc. 2014, 136, 15291–15299. 10.1021/ja507958z. [DOI] [PubMed] [Google Scholar]
- a Pinkowicz D.; Rams M.; Mišek M.; Kamenev K. V.; Tomkowiak H.; Katrusiak A.; Sieklucka B. Enforcing multifunctionality: a pressure-induced spin-crossover photomagnet. J. Am. Chem. Soc. 2015, 137, 8795–8802. 10.1021/jacs.5b04303. [DOI] [PubMed] [Google Scholar]; b Wang Y.; Tan X.; Zhang Y.-M.; Zhu S.; Zhang I.; Yu B.; Wang K.; Yang B.; Li M.; Zou B.; Zhang S. X.-A. Dynamic behavior of molecular switches in crystal under pressure and its reflection on tactile sensing. J. Am. Chem. Soc. 2015, 137, 931–939. 10.1021/ja511499p. [DOI] [PubMed] [Google Scholar]
- Egan L.; Kamenev K.; Papanikolaou D.; Takabayashi Y.; Margadonna S. Pressure-induced sequential magnetic pole inversion and antiferromagnetic–ferromagnetic crossover in a trimetallic Prussian Blue analogue. J. Am. Chem. Soc. 2006, 128, 6034–6035. 10.1021/ja061514m. [DOI] [PubMed] [Google Scholar]
- a Murayama C.; Iye Y.; Enomoto T.; Môri N.; Yamada Y.; Matsumoto T.; Kubo Y.; Shimakawa Y.; Manako T. Correlation between the pressure-induced changes in the Hall coefficient and Tc in superconducting cuprates. Phys. C 1991, 183, 277–285. 10.1016/0921-4534(91)90573-H. [DOI] [Google Scholar]; b Drozdov A. P.; Eremets M. I.; Troyan I. A.; Ksenofontov V.; Shylin S. I. Conventional superconductivity at 203 K at high pressures in the sulfur hydride system. Nature 2015, 525, 73–76. 10.1038/nature14964. [DOI] [PubMed] [Google Scholar]; c Gao L.; Xue Y. Y.; Chen F.; Xiong Q.; Meng R. L.; Ramirez D.; Chu C. W.; Eggert J. H.; Mao H. K. Superconductivity up to 164 K in HgBa2Cam–1CumO2m+2+δ (m = 1, 2, and 3) under quasihydrostatic pressures. Phys. Rev. B: Condens. Matter Mater. Phys. 1994, 50, 4260–4263. 10.1103/PhysRevB.50.4260. [DOI] [PubMed] [Google Scholar]; d Zhao Z.; Zhang H.; Yuan H.; Wang S.; Lin Y.; Zeng Q.; Xu G.; Liu Z.; Solanki G. K.; Patel K. D.; Cui Y.; Hwang H. Y.; Mao W. L. Pressure induced metallization with absence of structural transition in layered molybdenum diselenide. Nat. Commun. 2015, 6, 7312. 10.1038/ncomms8312. [DOI] [PMC free article] [PubMed] [Google Scholar]
- a Papavassiliou G. C. Three- and low-dimensional inorganic semiconductors. Prog. Solid State Chem. 1997, 25, 125–270. 10.1016/S0079-6786(97)80886-2. [DOI] [Google Scholar]; b Matsuishi K.; Suzuki T.; Onari S.; Gregoryanz E.; Hemley R. J.; Mao H. K. Excitonic states of alkylammonium lead-iodide layered perovskite semiconductors under hydrostatic pressure to 25 GPa. Phys. Status Solidi B 2001, 223, 177–182. . [DOI] [Google Scholar]
- a Moritomo Y.; Tokura Y. Pressure-induced disappearance of the in-plane lattice distortion in layered cupric chloride: (C2H5NH3)2CuCl4. J. Chem. Phys. 1994, 101, 1763–1766. 10.1063/1.467754. [DOI] [Google Scholar]; b Valiente R.; Rodríguez F. Electron-phonon coupling in charge-transfer and crystal-field states of Jahn-Teller CuCl64– systems. Phys. Rev. B: Condens. Matter Mater. Phys. 1999, 60, 9423–9429. 10.1103/PhysRevB.60.9423. [DOI] [Google Scholar]; c Aguado F.; Rodríguez F.; Valiente R.; Itiè J.-P.; Hanfland M. Pressure effects on Jahn-Teller distortion in perovskites: the roles of local and bulk compressibilities. Phys. Rev. B: Condens. Matter Mater. Phys. 2012, 85, 100101. 10.1103/PhysRevB.85.100101. [DOI] [Google Scholar]
- Jaffe A.; Lin Y.; Mao W. L.; Karunadasa H. I. Pressure-induced conductivity and yellow-to-black piezochromism in a layered Cu–Cl hybrid perovskite. J. Am. Chem. Soc. 2015, 137, 1673–1678. 10.1021/ja512396m. [DOI] [PubMed] [Google Scholar]
- a Green M. A.; Ho-Baillie A.; Snaith H. J. The emergence of perovskite solar cells. Nat. Photonics 2014, 8, 506–514. 10.1038/nphoton.2014.134. [DOI] [Google Scholar]; b Kazim S.; Nazeeruddin M. K.; Grätzel M.; Ahmad S. Perovskite as light harvester: a game changer in photovoltaics. Angew. Chem., Int. Ed. 2014, 53, 2812–2824. 10.1002/anie.201308719. [DOI] [PubMed] [Google Scholar]
- a Tan Z.-K.; Moghaddam R. S.; Lai M. L.; Docampo P.; Higler R.; Deschler F.; Price M.; Sadhanala A.; Pazos L. M.; Credgington D.; Hanusch F.; Bein T.; Snaith H. J.; Friend R. H. Bright light-emitting diodes based on organometal halide perovskite. Nat. Nanotechnol. 2014, 9, 687–692. 10.1038/nnano.2014.149. [DOI] [PubMed] [Google Scholar]; b Kim Y.-H.; Cho H.; Heo J. H.; Kim T.-S.; Myoung N.; Lee C.-L.; Im S. H.; Lee T.-W. Multicolored organic/inorganic hybrid perovskite light-emitting diodes. Adv. Mater. 2015, 27, 1248–1254. 10.1002/adma.201403751. [DOI] [PubMed] [Google Scholar]
- a Xing G.; Mathews N.; Lim S. S.; Yantara N.; Liu X.; Sabba D.; Grätzel M.; Mhaisalkar S.; Sum T. C. Low-temperature solution-processed wavelength-tunable perovskites for lasing. Nat. Mater. 2014, 13, 476–480. 10.1038/nmat3911. [DOI] [PubMed] [Google Scholar]; b Deschler F.; Price M.; Pathak S.; Klintberg L. E.; Jarausch D.-D.; Higler R.; Hüttner S.; Leijtens T.; Stranks S. D.; Snaith H. J.; Atatüre M.; Phillips R. T.; Friend R. H. High photoluminescence efficiency and optically pumped lasing in solution-processed mixed halide perovskite semiconductors. J. Phys. Chem. Lett. 2014, 5, 1421–1426. 10.1021/jz5005285. [DOI] [PubMed] [Google Scholar]
- Onoda-Yamamuro N.; Yamamuro O.; Matsuo T.; Suga H. p-T phase relations of CH3NH3PbX3 (X = Cl, Br, I) crystals. J. Phys. Chem. Solids 1992, 53, 277–281. 10.1016/0022-3697(92)90056-J. [DOI] [Google Scholar]
- Swainson I. P.; Tucker M. G.; Wilson D. J.; Winkler B.; Milman V. Pressure response of an organic–inorganic perovskite: methylammonium lead bromide. Chem. Mater. 2007, 19, 2401–2405. 10.1021/cm0621601. [DOI] [Google Scholar]
- Matsuishi K.; Ishihara T.; Onari S.; Chang Y. H.; Park C. H. Optical properties and structural phase transitions of lead-halide based inorganic–organic 3D and 2D perovskite semiconductors under high pressure. Phys. Status Solidi B 2004, 241, 3328–3333. 10.1002/pssb.200405229. [DOI] [Google Scholar]
- a Wang Y.; Lü X.; Yang W.; Wen T.; Yang L.; Ren X.; Wang L.; Lin Z.; Zhao Y. Pressure-induced phase transformation, reversible amorphization, and anomalous visible light response in organolead bromide perovskite. J. Am. Chem. Soc. 2015, 137, 11144–11149. 10.1021/jacs.5b06346. [DOI] [PubMed] [Google Scholar]; b Ou T.; Yan J.; Xiao C.; Shen W.; Liu C.; Liu X.; Han Y.; Ma Y.; Gao C. Visible light response, electrical transport, and amorphization in compressed organolead iodine perovskites. Nanoscale 2016, 10.1039/C5NR07842C. [DOI] [PubMed] [Google Scholar]
- Lee Y.; Mitzi D. B.; Barnes P. W.; Vogt T. Pressure-induced phase transitions and templating effect in three-dimensional organic-inorganic hybrid perovskites. Phys. Rev. B: Condens. Matter Mater. Phys. 2003, 68, 020103. 10.1103/PhysRevB.68.020103. [DOI] [Google Scholar]
- Knop O.; Wasylishen R. E.; White M. A.; Cameron T. S.; van Oort M. J. M. Alkylammonium lead halides. Part 2. CH3NH3PbX3 (X = Cl, Br, I) perovskites: cuboctahedral halide cages with isotropic cation reorientation. Can. J. Chem. 1990, 68, 412–422. 10.1139/v90-063. [DOI] [Google Scholar]
- Noh J. H.; Im S. H.; Heo J. H.; Mandal T. N.; Seok S. I. Chemical management for colorful, efficient, and stable inorganic–organic hybrid nanostructured solar cells. Nano Lett. 2013, 13, 1764–1769. 10.1021/nl400349b. [DOI] [PubMed] [Google Scholar]
- Stoumpos C. C.; Malliakas C. D.; Kanatzidis M. G. Semiconducting tin and lead iodide perovskites with organic cations: phase transitions, high mobilities, and near-infrared photoluminescent properties. Inorg. Chem. 2013, 52, 9019–9038. 10.1021/ic401215x. [DOI] [PubMed] [Google Scholar]
- Saidaminov M. I.; Abdelhady A. L.; Murali B.; Alarousu E.; Burlakov V. M.; Peng W.; Dursun I.; Wang L.; He Y.; Maculan G.; Goriely A.; Wu T.; Mohammed O. F.; Bakr O. M. High-quality bulk hybrid perovskite single crystals within minutes by inverse temperature crystallization. Nat. Commun. 2015, 6, 7586. 10.1038/ncomms8586. [DOI] [PMC free article] [PubMed] [Google Scholar]
- Baikie T.; Barrow N. S.; Fang Y.; Keenan P. J.; Slater P. R.; Piltz R. O.; Gutmann M.; Mhaisalkar S. G.; White T. J. A combined single crystal neutron/x-ray diffraction and solid-state nuclear magnetic resonance study of the hybrid perovskites CH3NH3PbX3 (X = I, Br and Cl). J. Mater. Chem. A 2015, 3, 9298–9307. 10.1039/C5TA01125F. [DOI] [Google Scholar]
- Klotz S.; Chervin J. C.; Munsch P.; Marchand G. L. Hydrostatic limits of 11 pressure transmitting media. J. Phys. D: Appl. Phys. 2009, 42, 075413. 10.1088/0022-3727/42/7/075413. [DOI] [Google Scholar]
- a Glazer A. The classification of tilted octahedra in perovskites. Acta Crystallogr., Sect. B: Struct. Crystallogr. Cryst. Chem. 1972, 28, 3384–3392. 10.1107/S0567740872007976. [DOI] [Google Scholar]; b Lufaso M. W.; Woodward P. M. Prediction of the crystal structures of perovskites using the software program SPuDS. Acta Crystallogr., Sect. B: Struct. Sci. 2001, 57, 725–738. 10.1107/S0108768101015282. [DOI] [PubMed] [Google Scholar]; c According to this convention, tilts are described as rotations about the axes of the original undistorted cubic unit cell. Letters refer to the relative degree of tilt, where abc or aaa represents three unequal or equal tilts, respectively. A superscript “0” signifies that no tilt occurs along that axis, a “+” means that all octahedra tilt in the same direction along that axis, and a “–” means that neighboring octahedra along that axis alternate in their tilt direction.
- Kuisma M.; Ojanen J.; Enkovaara J.; Rantala T. T. Kohn-Sham potential with discontinuity for band gap materials. Phys. Rev. B: Condens. Matter Mater. Phys. 2010, 82, 115106. 10.1103/PhysRevB.82.115106. [DOI] [Google Scholar]
- Hoke E. T.; Slotcavage D. J.; Dohner E. R.; Bowring A. R.; Karunadasa H. I.; McGehee M. D. Reversible photo-induced trap formation in mixed-halide hybrid perovskites for photovoltaics. Chem. Sci. 2015, 6, 613–617. 10.1039/C4SC03141E. [DOI] [PMC free article] [PubMed] [Google Scholar]
- Morón M. C.; Palacio F.; Clark S. M. Pressure-induced structural phase transitions in the AMnF4 series (A = Cs, Rb, K) studied by synchrotron x-ray powder diffraction: correlation between hydrostatic and chemical pressure. Phys. Rev. B: Condens. Matter Mater. Phys. 1996, 54, 7052–7061. 10.1103/PhysRevB.54.7052. [DOI] [PubMed] [Google Scholar]
- Luty T.; Eckhardt C. J. General theoretical concepts for solid state reactions: quantitative formulation of the reaction cavity, steric compression, and reaction-induced stress using an elastic multipole representation of chemical pressure. J. Am. Chem. Soc. 1995, 117, 2441–2452. 10.1021/ja00114a008. [DOI] [Google Scholar]
- Kieslich G.; Sun S.; Cheetham A. K. Solid-state principles applied to organic-inorganic perovskites: new tricks for an old dog. Chem. Sci. 2014, 5, 4712–4715. 10.1039/C4SC02211D. [DOI] [Google Scholar]
- Amat A.; Mosconi E.; Ronca E.; Quarti C.; Umari P.; Nazeeruddin M. K.; Grätzel M.; De Angelis F. Cation-induced band-gap tuning in organohalide perovskites: interplay of spin–orbit coupling and octahedra tilting. Nano Lett. 2014, 14, 3608–3616. 10.1021/nl5012992. [DOI] [PubMed] [Google Scholar]
- Yang T.-Y.; Gregori G.; Pellet N.; Grätzel M.; Maier J. The significance of ion conduction in a hybrid organic–inorganic lead-iodide-based perovskite photosensitizer. Angew. Chem., Int. Ed. 2015, 54, 7905–7910. 10.1002/anie.201500014. [DOI] [PubMed] [Google Scholar]
- Grochala W.; Hoffmann R.; Feng J.; Ashcroft N. W. The chemical imagination at work in very tight places. Angew. Chem., Int. Ed. 2007, 46, 3620–3642. 10.1002/anie.200602485. [DOI] [PubMed] [Google Scholar]
Associated Data
This section collects any data citations, data availability statements, or supplementary materials included in this article.


