

Abstract
Objective
Patients with hospital-acquired acute kidney injury (AKI) are at risk for increased mortality and further medical complications. Evaluating these patients with a prediction tool easily implemented within an electronic health record (EHR) would identify high risk patients prior to the development of AKI, and could prevent iatrogenically induced episodes of AKI and improve clinical management.
Methods
We used structured clinical data acquired from an EHR to identify patients with normal kidney function for admissions from August 1st, 1999 to July 31st, 2003. Using administrative, computerized provider order entry, and laboratory test data, we developed a 3-level risk stratification model to predict each of two severity levels of in-hospital AKI as defined by RIFLE criteria. The severity levels were defined as 150% or 200% of baseline serum creatinine. Model discrimination and calibration was evaluated using 10-fold cross-validation.
Results
Cross-validation of the models resulted in area under the receiver operating characteristic (AUC) curves of 0.75 (150% elevation) and 0.78 (200% elevation). Both models were adequately calibrated as measured by the Hosmer-Lemeshow goodness-of-fit test chi-squared values of 9.7 (p = 0.29) and 12.7 (p = 0.12), respectively.
Conclusions
We generated risk prediction models for hospital-acquired AKI using only commonly available electronic data. The models identify patients at high risk for AKI who might benefit from early intervention or increased monitoring.
Background
Acute kidney injury (AKI), an acute sustained rise in serum creatinine, affects 1–5% of all hospitalized patients and 5–20% of patients requiring ICU care.1–3 The incidence of this condition has increased among the Medicare population over the last few decades in parallel with the rising epidemic of chronic kidney disease, diabetes, and hypertension.1, 4–7 The occurrence of AKI is associated with subsequent in-hospital mortality rates which range from 15% among general ward patients with isolated AKI to greater than 50% among patients in the ICU requiring dialysis. AKI episodes are commonly divided into community-acquired and hospital-acquired sub-categories, each with approximately equal incidence but significant differences in etiology and prognosis.8, 9 Hospital-acquired AKI is potentially preventable when related to therapies such as administration of intravenous contrast dye or nephrotoxic medications.
In the last three decades, statistical models to predict adverse outcomes have been widely used to improve the quality of care,10, 11 provide institutional and physician quality scorecards,12, 13 risk stratify patients10, evaluate futility of care,14–16 and to provide individual patient prognostications. The majority of existing risk prediction models for AKI have focused on adverse outcomes that follow development of AKI.17 Two risk models have been developed to predict AKI following specific coronary arterial bypass grafting surgery and percutaneous coronary interventions using clinical registry data.18–21 Yet no models exist which predict future, in-hospital AKI in a general population of recently admitted patients.
Automated clinical decision support, such as clinical reminders for individual patient encounters and dashboards for population surveillance, has proven to be useful for well-defined or relatively simple tasks. However, these tools are only as good as the underlying encoded medical knowledge supporting their use. Frequently, such knowledge requires information beyond that commonly collected in electronic health records (EHRs), which prevents or limits their use in such an environment. This problem is particularly prevalent for risk prediction tools, which in many cases are designed to be used at the bedside or using data that must be manually collected by health care providers.
We sought to develop risk models to predict the development of AKI among general patient hospitalizations in order to support future applications for bedside and population AKI surveillance. In order to enhance generalizability of the models, we restricted the available medical information to structured data obtained from basic EHR components (administrative data, computerized physician order entry, and laboratory tests).
Methods
Study Setting and Design
A retrospective cohort of 61,179 patients was collected by including all adult admissions to a tertiary care, academic hospital (Vanderbilt University Medical Center – VUMC) from August 1st, 1999 to July 31st, 2003 with a length of stay of at least two days. During the study period, all providers were required to prescribe medications through the inpatient computerized physician order entry system. All laboratory tests were processed and recorded in a central laboratory and posted electronically. This study was approved by the institutional review board of VUMC.
Data Collection
Medication orders were collected from the log files of an inpatient computerized physician order entry system. An automated software scheduler generated the expected timing of dose administrations based on the frequency, priority, medication start date and time, and actual stop time (either scheduled stop or discontinuation related to hospital discharge or patient death). We validated the performance of the scheduler by manually reviewing administrations recorded in the paper-based Medication Administration Record and published these results separately.22 This study revealed no medications that were administered without being ordered, but there was a dose omission rate of 12.6% compared to the automated scheduler. On further analysis, 59% of those omissions were due to explainable issues such as the patient being off the floor, the drug not being available, or patient refusal.
Laboratory results were also obtained for each hospitalization. We included results recorded up to 24 hours before hospital admission and 24 hours following discharge to capture events which occurred during emergency care and immediate outpatient follow-up respectively. Laboratory results with attached comments indicating hemolysis, invalid laboratory procedures, or an inadequate sample were excluded.
Discharge diagnoses and codes were collected for each hospitalization from the administrative database. The diagnosis-related group adjusted length of stay for patients was calculated using the mean length of stay data by diagnosis-related group from Medicare published for the year in which the patient was admitted. Specific dates and times were converted to relative hours after hospital admission.
Cohort Exclusion Criteria
Using records from administrative and laboratory databases, we selected an analysis cohort of patients in an effort to exclude those who a) were missing data necessary for outcome determination, b) had evidence of moderate or severe chronic kidney dysfunction or c) were experiencing acute kidney injury at the time of hospital admission. Patients were excluded from the initial cohort if no serum creatinine measurements were available within the 48 hours surrounding the time of admission or if there were no further serum creatinine measurements after 24 hours of hospitalization. Measurement of creatinine within the 48 hour time window surrounding admission established an “admission baseline” that was used to calculate an estimated glomerular filtration rate (eGFR) using the 4-component Modification of Diet in Renal Disease equation.23 Patients were excluded with baseline eGFR’s less than 60 mL/min/1.73 m2. A summary of patient hospitalization exclusions are shown in Figure 1. The final analysis cohort consisted of 26,107 patient admissions. There were a total of 21,074 patients in this cohort, and 17,870 only had one admission.
Figure 1.

Summary of the patient cohort after each step of exclusion
Study Definition of Acute Kidney Injury
The admission creatinine was calculated by averaging all creatinine values within the 48 hours surrounding the time of admission. In some cases, the database includes creatinine values from Emergency Department care or from an outpatient clinic visit just prior to admission, and these values are also included in the admission average. Outpatient serum creatinine measurements performed outside the study institution or earlier than the time window surrounding baseline were not available for inclusion in the study.
The outcome of AKI was based upon the Risk and Injury categories of the Risk, Injury, Failure, Loss, and End-stage Kidney (RIFLE) classification criteria.24 AKI Risk was defined as at least two creatinine measurements greater than or equal to 150% of the baseline creatinine value. AKI Injury was defined as at least two creatinine measurements greater than or equal to 200% of the baseline creatinine value. All creatinine measurements subsequent to the first 24 hours of inpatient stay and up to 30 days of hospitalization were evaluated to determine if hospital-acquired AKI developed.
Acute Kidney Injury Risk Factors
A list of the primary risk factors for AKI was compiled after a literature review by the research team, which included a nephrologist (A. I.). To be eligible for inclusion in the risk prediction model, the variable had to be readily accessible via the EHR, be recorded prior to the onset of AKI, and be clinical plausible as an associated factor. Some data were excluded, such as International Classification of Diseases 9th revision codes (ICD-9), because they are recorded without time/date stamps, and the related event or condition could occur after the outcome. Variables available in the dataset and considered for inclusion were patient demographics, medication orders, and laboratory tests with date/time stamps prior to the outcome (Table 1). Medication orders were aggregated into therapeutic class and categorized as present or absent. Laboratory values were included to represent the potential presence of a comorbidity that is correlated with in-hospital AKI. For all laboratory data risk factors except the baseline creatinine, the mean values or the peak values were calculated using all data available prior to the development of the outcome. Clinical guidelines and research publications were used to select the laboratory test thresholds. Some laboratory test values were included because they are diagnostic for specific disease processes which cause AKI. Myocardial infarction was classified as either a peak muscle and brain creatine kinase (CK-MB) value of three times the upper limit of normal or a peak Troponin-I (or Troponin-T) value at least two times the upper limit of normal.25, 26 Rhabdomyolysis was classified as a peak creatine phoshokinase (CK) value of at least five times the upper limit of normal in the absence of a diagnosis of myocardial infarction.27 Acute hepatitis was classified as a peak alanine aminotransferase (ALT) or aspartate aminotransferase (AST) value of greater than 400 IU/L. Acute pancreatitis was classified as a peak lipase value of at least three times the upper limit of normal.28 Chronic liver disease was classified as either a mean ammonia level of greater than 40 mcg/dL or a mean AST/ALT ratio greater than 1.5. Elevated mean serum glucose was chosen to represent diabetes mellitus or insulin resistance and is associated with infectious risk which may precipitate AKI.
Table 1.
Primary Risk Factors in the Development of Acute Kidney Injury and summary of the candidate risk factors available in the clinical database. Items with direct data representation have no entry for Coded Data Approximation.
| Clinical Risk Factor | Source of Coded Data |
|---|---|
| Patient Demographics | |
| Age3 | Administrative Data |
| Gender | Administrative Data |
| Race | Administrative Data |
| Medication Classes | |
| Angiotensin Converting Enzyme Inhibitors (ACE)40 | Computerized Physician Order Entry |
| Angiotensin Receptor Blockers (ARB) | Computerized Physician Order Entry |
| Aminoglycoside Antibiotics2, 40–43 | Computerized Physician Order Entry |
| Non-Steroidal Anti-Inflammatory Drugs (NSAID)43, 44 | Computerized Physician Order Entry |
| Amphotericin B (all formulations)45, 46 | Computerized Physician Order Entry |
| Cyclosporine40 | Computerized Physician Order Entry |
| Acyclovir40, 47 | Computerized Physician Order Entry |
| Cisplatin | Computerized Physician Order Entry |
| Diuretic Medications (CHF/hypovolemia/hypotension)3, 48–50 | Computerized Physician Order Entry |
| Radiocontrast Media2, 43, 51, 52 | CPOE - Computed Tomography with contrast |
| Medical Conditions | |
| Acute Myocardial Infarction49, 50 | Peak Troponin I > 2.0× ULN (OR) Peak Troponin T > 2.0× ULN (OR) Peak CK-MB > 3.0× ULN |
| Rhabdomyolysis53 | Peak CK > 5.0× ULN (AND) (NOT) Acute Myocardial Infarction |
| Acute Hepatitis | Peak ALT >= 400 IU/L (OR) Peak AST >= 400 IU/L |
| Acute Pancreatitis | Peak Lipase > 3.0× ULN |
| Bacterial Infection3, 52 | Any Antibiotic Order (treatment of) |
| Hypercalcemia | Mean Albumin-Corrected Calcium > ULN |
| Thrombocytopenia | Nadir Platelets < 0.75× LLN |
| Pre-existing hepatic disease | Mean AST/ALT Ratio >= 1.5, Mean Ammonia >= 40 mcg/dL |
| Intravascular Volume Depletion54 | Diuretic Medications (treatment of) |
| Diabetes48, 52 | Mean Glucose >= 150 mg/dL (AND) < 200 mg/dL, Mean Glucose >= 200 mg/dL (AND) < 250 mg/dL, Mean Glucose >= 250 mg/dL |
ULN = Upper limit of normal laboratory value. LLN = Lower limit of normal laboratory value.
Other laboratory values were included as being potentially predictive of AKI because abnormal values are associated with conditions which cause AKI. A mean AST/ALT ratio of greater than 1.5 is associated with liver disease. An elevated peak white blood cell count (WBC) or antibiotic orders are associated with bacterial infection. An elevated albumin-corrected calcium value is associated with bone breakdown from malignancies or multiple myeloma. Advanced thrombocytopenia is associated with a number of causes of acute kidney injury, including disseminated intravascular coagulation, hemolytic-uremic syndrome, and heparin-induced thrombocytopenia, and was defined as less than 75% of the lower limit of normal for platelets. Direct administration records of contrast dye administration were unavailable, so orders for computed tomography scans with intravenous contrast were used as a surrogate for this exposure. Missing values among laboratory tests were captured as a separate category in each case, since information may be contained in the choice to not perform a particular test.
Statistical Analysis
Significance testing for the hospitalization characteristics was performed using Fisher’s exact test for binary variables and likelihood chi square testing for categorical variables. Two logistic regression models were developed for RIFLE AKI Risk and Injury outcomes. Performance for each of the models was evaluated with the area under the receiver operating characteristic curve (AUC) and the Hosmer-Lemeshow goodness-of-fit (HL-GOF) test.29, 30 To estimate the model performance uncertainty and potential overfitting we used a 10 fold cross-validation with 95% confidence intervals (95% CI).31 This method splits the data into ten data sets each of 90% training data and 10% testing data, with a model fitted for each training data set, and applied to the testing data. Selection is random, but each observation is only used in the testing data one time. This method has been shown to be equivalent or superior to split training and test data in multiple studies.32 All development and validation of model was performed using SAS (Version 9.1, Cary, NC) with the GENMOD procedure with adjustment for repeated patient hospitalizations. Calibration plots were generated using the observed and expected event rates per deciles as defined by the Hosmer-Lemeshow ĉ statistic. The risk predictiveness curves were generated as described by Pepe and colleagues using summary statistics in SAS and plotted with Microsoft Excel 2007 (Redmond, WA).33
RESULTS
A summary of patient demographic factors, inpatient medication use rates, laboratory test ordering rates, and outcomes are listed in Table 2 for both the analysis cohort and the patients excluded from analysis. Comparison between the groups revealed significant differences in all categories between the groups. The inclusion cohort average admission creatinine was 0.81 (95% CI 0.81 – 0.82) and the average number of admission creatinines were 1.77 (95% CI 1.76–1.78).
Table 2.
Characteristics of study cohort and prevalence of medications and laboratory values [footnote: use and laboratory test ordering were counted if present at any point during a hospitalization.
| Demographics | Excluded N=35,072 |
Included N=26,107 |
P |
|---|---|---|---|
| Age | <0.001 | ||
| 18–25 | 3,985 (11.4%) | 2,365 (9.1%) | |
| 26–35 | 4,992 (14.2%) | 3,044 (11.7%) | |
| 36–45 | 5,156 (14.7%) | 4,382 (16.8%) | |
| 46–55 | 5,194 (14.8%) | 5,027 (19.3%) | |
| 56–65 | 5,590 (15.9%) | 4,614 (17.7%) | |
| >65 | 10,155 (29.0%) | 6,675 (25.6%) | |
| Female | 14,605 (41.6%) | 14,505 (55.6%) | <0.001 |
| Race | 0.001 | ||
| White | 25,518 (72.8%) | 19,329 (74.0%) | |
| African American | 5,612 (16.0%) | 3,866 (14.8%) | |
| Other | 686 (2.0%) | 515 (2.0%) | |
| Unknown | 3,256 (9.3%) | 2,397 (9.2%) | |
| Length of Stay (Mean) | 5.67 (5.62 – 5.72) | 8.12 (8.04 – 8.21) | <0.001 |
| DRG Length of Stay (Mean) | 4.65 (4.63 – 4.67) | 5.03 (5.01 – 5.06) | <0.001 |
| Medication Usage | |||
| Any Antibiotic | 24,799 (70.7%) | 19,672 (75.4%) | <0.001 |
| ACE Inhibitor | 6,866 (19.6%) | 5,828 (22.3%) | <0.001 |
| Acyclovir | 742 (2.1%) | 1508 (5.8%) | <0.001 |
| Angiotensin Receptor Blocker | 1570 (4.5%) | 866 (3.3%) | <0.001 |
| Aminoglycoside | 1,996 (5.7%) | 2,501 (9.6%) | <0.001 |
| Amphotericin B | 192 (0.6%) | 498 (1.9%) | <0.001 |
| Cyclosporine | 1,219 (3.5%) | 578 (2.2%) | <0.001 |
| Cisplatin | 84 (2.4%) | 303 (1.2%) | <0.001 |
| Diuretics | |||
| Loop | 9,667 (27.6%) | 10,239 (39.2%) | <0.001 |
| Thiazide | 2,905 (8.3%) | 2,056 (7.9%) | 0.068 |
| Potassium-Sparing | 1,714 (4.9%) | 1,559 (6.0%) | <0.001 |
| NSAID | 17,085 (48.7%) | 11,622 (44.5%) | <0.001 |
| Radiocontrast Dye | 2,580 (7.4%) | 4,610 (17.7%) | <0.001 |
| Laboratory Test Ordered | |||
| Albumin | 14,535 (41.4 %) | 16,958 (65.0%) | <0.001 |
| ALT | 13,805 (37.3%) | 14,561 (58.6%) | <0.001 |
| AST | 15,719 (44.8%) | 17,690 (67.8%) | <0.001 |
| Ammonia | 790 (2.3%) | 877 (3.4%) | <0.001 |
| Ca | 22,711 (64.8%) | 23,149 (88.7%) | <0.001 |
| CKMB | 7,488 (21.4%) | 7310 (28.0%) | <0.001 |
| CK | 8163 (23.3%) | 7877 (30.2%) | <0.001 |
| Glucose | 26898 (76.7%) | 25834 (99.0%) | <0.001 |
| Lipase | 3022 (8.6%) | 4224 (16.1%) | <0.001 |
| Platelets | 26408 (75.3%) | 24527 (94.0%) | <0.001 |
| TropI/TropT | 5618 (16.0%) | 5692 (21.8%) | <0.001 |
| WBC | 27743 (79.1%) | 25178 (96.4%) | <0.001 |
ACE = Angiotensin Converting Enzyme.
Discrimination performance of the AKI Risk and AKI Injury models were evaluated by the AUC, which was 0.75 (0.73 – 0.76 95% CI) and 0.78 (0.76 – 0.79 95% CI), respectively. Calibration performance for each model was adequate (indicated by a p value > 0.05 on the HL-GOF test) with χ2 results of 9.7 (p = 0.29) and 12.7 (p = 0.12). Calibration assessment by deciles is reported in Table 4. A high level of agreement between observed and expected outcome event rates was noted for both models across the full spectrum of patient risk. The risk predictiveness curves (Figure 2) also showed good calibration for both risk models, although the risk predictions in the 30–60% risk percentiles of the AKI Injury model were somewhat insensitive to the observed outcome rates. A few examples of thresholds will also be presented. For the AKI Risk model, the risk percentile threshold was 0.372 for 50% of the observed outcome incidence and 0.847 for 150% of the observed outcome incidence. For the AKI Injury model, the risk percentile threshold was 0.477 for 50% of the observed outcome incidence and 0.831 for 150% of the observed outcome incidence.
Table 4.
Calibration performance by deciles for each model
| AKI Risk | AKI Injury | |||||
|---|---|---|---|---|---|---|
| Group | Total | Observed Outcomes |
Expected Outcomes |
Total | Observed Outcomes |
Expected Outcomes |
| 1 | 2610 | 19 | 29.2 | 2612 | 6 | 8.5 |
| 2 | 2609 | 44 | 42.5 | 2613 | 10 | 15.8 |
| 3 | 2610 | 50 | 51.3 | 2611 | 16 | 21.7 |
| 4 | 2610 | 72 | 61.7 | 2610 | 48 | 27.1 |
| 5 | 2610 | 68 | 75.5 | 2611 | 40 | 34.2 |
| 6 | 2611 | 94 | 93.9 | 2611 | 33 | 44.2 |
| 7 | 2611 | 122 | 117.2 | 2610 | 55 | 57.3 |
| 8 | 2610 | 162 | 149.8 | 2611 | 67 | 76.0 |
| 9 | 2610 | 189 | 208.6 | 2610 | 117 | 113.4 |
| 10 | 2611 | 532 | 522.4 | 2603 | 334 | 327.7 |
Figure 2.
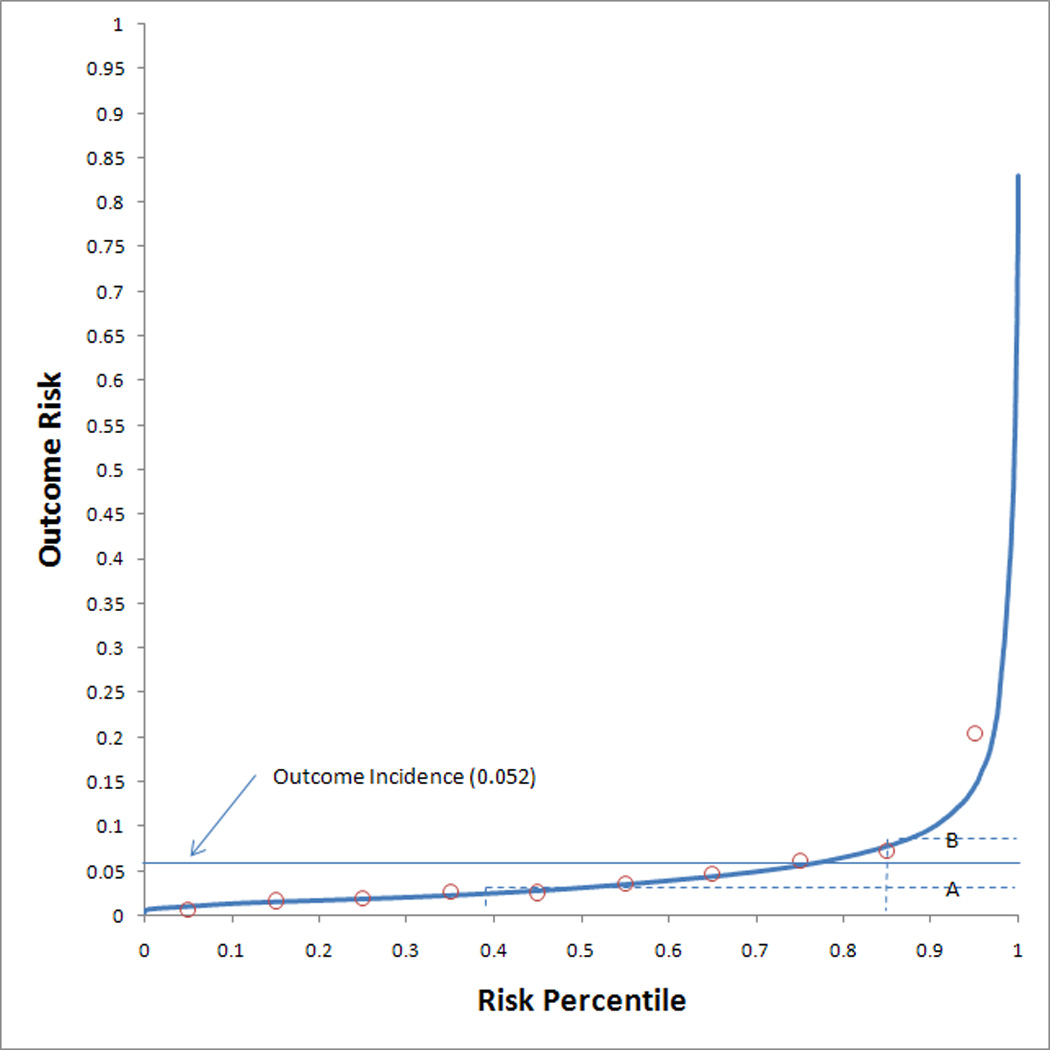
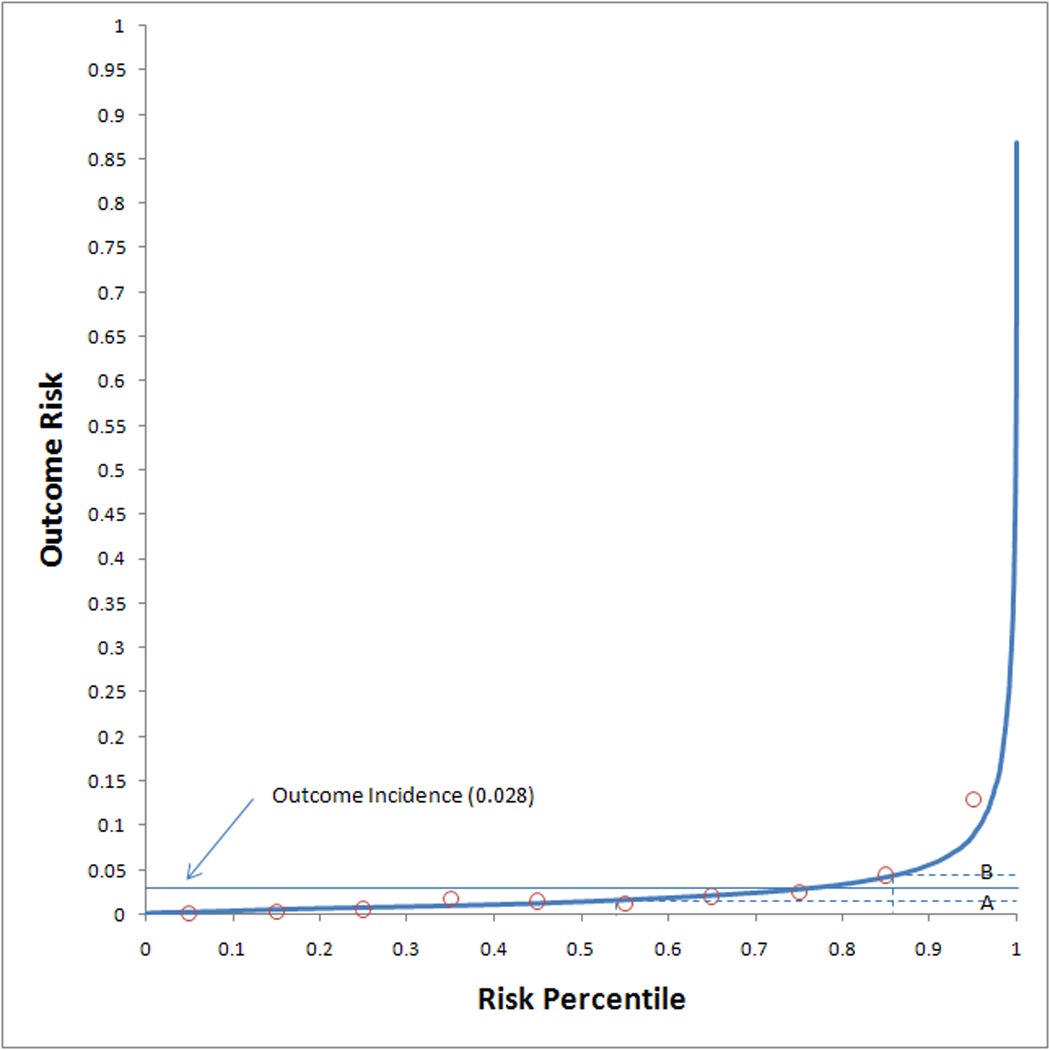
Risk predictiveness curves for the (a) AKI Risk model and the (b) AKI Injury model. Open circles display the observed outcome proportions within risk deciles. The solid horizontal line indicates the observed outcome incidence in the population. The dotted lines indicate the risk thresholds for rates that are (A) 50% and (B) 150% of the observed outcome incidence.
Most of the variables, which were selected on the basis of known association with in-hospital AKI, were significantly associated with at least one of the two stages of AKI. Several showed no significant association including potassium sparing diuretics, acyclovir, cisplatin, ordering a computed tomography (CT) scan with contrast, angiotensin receptor blockers (ARB), rhabdomyolysis, acute pancreatitis, and leukocytosis. A summary of the patient correlation adjusted logistic regression risk models for the outcomes of AKI Risk and AKI Injury is shown in Table 3, and instructions for use of the models for risk prediction is described in the Appendix.
Table 3.
Risk Stratification Models. Each risk factor was listed as odds ratios for interpretation. See the appendix for instructions on use. Each of the conditions with values for Yes and Unknown were in reference to a normal result.
| Effect | AKI Risk (OR [95% CI]) | AKI Injury (OR [95% CI]) |
|---|---|---|
| Demographics | ||
| Female | 1.22 [1.07 – 1.4] | 1.22 [1.02 – 1.47] |
| Age | ||
| 18 to 35 | 1.00 | 1.00 |
| 36 to 45 | 1.01 [0.81 – 1.25] | 1.12 [0.85 – 1.48] |
| 46 to 55 | 1.15 [0.94 – 1.41] | 1.17 [0.90 – 1.53] |
| 56 to 65 | 1.28 [1.04 – 1.57] | 1.13 [0.85 – 1.49] |
| >= 66 | 1.42 [1.17 – 1.73] | 1.35 [1.04 – 1.75] |
| Race | ||
| White | 1.00 | 1.00 |
| African American | 0.97 [0.81 – 1.17] | 1.07 [0.84 – 1.37] |
| Other | 0.96 [0.61 – 1.49] | 1.44 [0.88 – 2.34] |
| Unknown | 1.26 [1.04 – 1.52] | 1.33 [1.04 – 1.69] |
| Medication Class | ||
| Amphotericin B | 8.04 [6.19 – 10.46] | 8.39 [6.16 – 11.42] |
| Cyclosporine | 2.99 [2.33 – 3.84] | 2.10 [1.51 – 2.92] |
| Loop Diuretics | 2.08 [1.82 – 2.38] | 2.24 [1.87 – 2.69] |
| Thiazide Diuretics | 1.51 [1.23 – 1.85] | 1.89 [1.48 – 2.42] |
| Aminoglycosides | 1.53 [1.27 – 1.85] | 1.49 [1.18 – 1.89] |
| NSAID | 1.12 [0.99 – 1.28] | 1.24 [1.05 – 1.47] |
| K-Sparing Diuretics | 1.21 [0.97 – 1.51] | 1.19 [0.90 – 1.57] |
| Acyclovir | 0.98 [0.77 – 1.25] | 0.66 [0.48 – 0.91] |
| Cisplatin | 0.62 [0.33 – 1.15] | 0.37 [0.13 – 1.05] |
| CT Scan w/ Contrast | 0.92 [0.79 – 1.08] | 0.85 [0.69 – 1.04] |
| ARB | 0.96 [0.70 – 1.33] | 0.78 [0.49 – 1.25] |
| ACEI | 0.80 [0.69 – 0.94] | 0.70 [0.56 – 0.88] |
| Clinical Condition Associations (Lab) | ||
| Mean Admission Creatinine | 0.72 [0.51 – 1.03] | 0.54 [0.33 – 0.87] |
| Bacterial Infection (Any Antibiotic Use) | 1.74 [1.45 – 2.10] | 2.84 [2.09 – 3.84] |
| Myocardial Infarction | ||
| Yes | 1.11 [0.85 – 1.44] | 1.45 [1.05 – 1.99] |
| Unknown | 0.89 [0.62 – 1.29] | 1.10 [0.71 – 1.71] |
| Rhabdomyolysis | ||
| Yes | 0.98 [0.65 – 1.50] | 0.93 [0.54 – 1.62] |
| Unknown | 1.00 [0.70 – 1.45] | 0.75 [0.49 – 1.16] |
| Acute Hepatitis | ||
| Yes | 1.65 [1.28 – 2.12] | 1.86 [1.38 – 2.52] |
| Unknown | 1.03 [0.78 – 1.36] | 0.89 [0.60 – 1.31] |
| Acute Pancreatitis | ||
| Yes | 0.84 [0.64 – 1.11] | 0.82 [0.59 – 1.15] |
| Unknown | 0.90 [0.73 – 1.10] | 0.86 [0.67 – 1.12] |
| Hyperammonemia | ||
| Yes | 1.38 [0.85 – 2.23] | 1.86 [1.02 – 3.40] |
| Unknown | 0.85 [0.60 – 1.19] | 1.06 [0.68 – 1.66] |
| AST/ALT Ratio > 1.5 | ||
| Yes | 1.86 [1.58 – 2.18] | 1.73 [1.40 – 2.13] |
| Unknown | 1.01 [0.82 – 1.26] | 0.88 [0.66 – 1.18] |
| Thrombocytopenia | ||
| Yes | 1.76 [1.53 – 2.03] | 2.11 [1.75 – 2.54] |
| Unknown | 0.84 [0.60 – 1.17] | 1.00 [0.62 – 1.61] |
| Leukocytosis | ||
| Yes | 1.00 [0.88 – 1.14] | 1.09 [0.92 – 1.3] |
| Unknown | 0.97 [0.62 – 1.51] | 1.25 [0.68 – 2.3] |
| Hypercalcemia (Corrected) | ||
| Yes | 1.52 [1.06 – 2.18] | 1.05 [0.62 – 1.79] |
| Unknown | 1.03 [0.84 – 1.26] | 1.09 [0.83 – 1.42] |
| Mean Glucose | ||
| >250 | 2.68 [2.06 – 3.5] | 2.57 [1.76 – 3.75] |
| 200 – 250 | 1.6 [0.82 – 3.12] | 1.87 [1.37 – 2.57] |
| 150 – 199 | 1.00 [0.88 – 1.14] | 1.39 [1.13 – 1.72] |
| Unknown | 0.97 [0.62 – 1.51] | 0.85 [0.24 – 3.00] |
DISCUSSION
We created an AKI risk stratification model using computerized physician order entry and laboratory test data for patients admitted to a hospital with a baseline eGFR greater than 60 mL/min/1.73 m2. Our model showed good cross-validation discrimination performance with adequate calibration. Discrimination was similar to other AKI models which have been created for more specific clinical scenarios with AUC values of 0.74 – 0.77 compared to 0.72 – 0.81 for patients who have undergone coronary artery bypass grafting18–21 and 0.67 for patients who have undergone percutaneous coronary interventions and were exposed to intravenous contrast.34 To our knowledge, this is one of the first general inpatient risk stratification tools for the prediction of hospital-acquired AKI, using recently defined consensus criteria. There remains controversy as to whether the Risk or Injury definitions described in the RIFLE criteria are representative of true AKI. A threshold of 150% of baseline creatinine may be overly sensitive, while a threshold of 200% fails to capture a portion of patients experiencing renal injury. We reported both levels of severity in this study in order to support use of either threshold.
AKI has numerous etiologies and contributing factors and risk stratification models must account for detailed knowledge of patients. Another barrier has been the perception that detailed acute and chronic clinical diagnosis information would be required to generate a risk stratification model with adequate performance. It is difficult to obtain these data for all patient admissions because they are commonly stored in free text in the EHR. Accessing the information requires manual chart review, which is infeasible for large patient cohorts, or sophisticated natural language processing methods, which are not widely used.
We selected medications and laboratory tests that were plausibly associated with AKI by prior research.35 The model revealed a number of medications that were significantly associated with AKI including known nephrotoxins such as amphotericin B, aminoglycosides, cyclosporine, and non-steroidal anti-inflammatory medications. However, the indications for these prescriptions were not included and generally not available as coded data in our EHR. Thus, the odds ratios reported for the association between medications and AKI represent both the risk attributable to the medication directly as well as the risk attributable to the underlying condition for which the medication is prescribed. Angiotensin converting enzyme (ACE) inhibitors appeared to be protective for AKI, which is opposite to the physiologic expectation. It is possible that patients at perceived high risk of AKI had their ACE inhibitors discontinued upon admission, which could account for that finding. The lack of association with computed tomography orders may be related to orders for contrast that did not result in contrast administration during a radiology study. This limitation is being addressed in our local institution by modifying computerized physician order entry and operational processes to ensure contrast media are ordered as medications and dispensed by pharmacy. Both acute and chronic markers of hepatic disease were associated with elevated risk of AKI, but elevated lipase was not. Thrombocytopenia was associated with AKI in the model, and this finding can result from a number of clinical conditions, many of them known to be associated with AKI.
Risk stratification has particular utility for automated medical informatics applications such as providing thresholds for the activation of electronic health record clinical reminders and alerts and risk adjustment for post-marketing medication surveillance applications in hospitals. Examples include restricting clinical reminders to physicians to only those patients at high risk for the outcome. This improves the yield of such reminders, and minimizes reminder fatigue, both of which are known to reduce the impact of such interventions. Among post-marketing medication and medical device surveillance, such models are used to adjust for measured confounding in observational cohorts.36
There are a number of limitations in interpretation and use of the results of this study. This is a single center model, and external validation and/or recalibration in other institutions would improve generalizability.37 Secondly, we limited the analysis to patients who presented to the hospital with a minimum GFR of 60 mL/min/1.73 m2. While patients with reduced GFR are at increased risk for AKI, it is difficult to define which of these patients had hospital-acquired AKI without adequate longitudinal assessment of kidney function. The MDRD equation is known to overestimate GFR among hospitalized patients and among those with a rising serum creatinine trend.38, 39 Thus, the study cohort may contain patients with mild or moderate kidney dysfunction, as the true outpatient baseline eGFR was not universally available. However, patients with normal or mildly elevated kidney function are the most likely to receive contrast dye or nephrotoxic medication administration. A third limitation includes the selection requirement that patients were hospitalized for greater than 48 hours and had multiple serum creatinine measurements. This was required because outpatient baseline creatinine values were not known (a common situation in inpatient care), and this allowed the establishment of an admission baseline for patients. As shown in Table 2, the patients in the resulting cohort are different than the all patient admission cohort, and the risk models should only be used among those patients meeting the inclusion criteria. The use of risk stratification models in clinical practice must be able to operate in such an environment, since ordering a baseline and follow-up serum creatinine on all hospitalized patients is not feasible.
Overall, this study supports the utility of a model using computerized physician order entry and laboratory test results to risk-stratify general hospital admissions for development of AKI. The data requirements of these models allow them to be used in any institution using an electronic health records with computerized physician order entry and electronic laboratory reporting. The models performed well, and categorical risk stratification was able to identify a portion of patients with significantly elevated risk of acute kidney injury. Future work in this area will include efforts to improve model performance by incorporating medication dosing and bar coded medication administration data as well as implementing these models into clinical decision support in our local institution and prospectively evaluating their utility.
Acknowledgments
Michael Matheny is supported by the Veterans Health Administration HSR&D Career Development Award CDA-08-020. The work of Drs. Miller, Peterson, Waitman, Schildcrout, and Denny on this project has been supported in part by NIH grant R01-LM-007995.
APPENDIX
Prediction formula for the probability of an AKI event
The logistic regression model is defined as:
In this equation, each of the B variables is a beta coefficient for a variable in the model. B0 is a special case called the intercept, and represents the risk for the outcome in a case where all the risk factors are not present.
The following table describes each of the risk variables for the AKI Risk and AKI Injury model in beta coefficient form (which is the natural log of the odds ratio) with standard errors (SE). Please note that for each of the clinical associations except for creatinine (which is required) and a bacterial infection (which is assessed by antibiotic use), there are two variables, one is a binary variable for (known – below threshold/known – above threshold) and the other is a binary variable for (not missing/missing). Data that is missing is coded as known – below threshold for the other variable.
It is also important to note that this tool can use accruing data to calculate and re-calculate AKI risk during a hospitalization. Baseline creatinine is fixed in the admission time period, and the demographic imformation is also fixed, but any medication order results in the corresponding medication risk factor being flagged as true. In addition, laboratory values can accrue during the hospitalization. Laboratory rules are determined by evaluating each laboratory threshold against an aggregated value (either peak or mean) over the hospital course prior to an outcome.
| AKI Risk | AKI Injury | |
|---|---|---|
| Risk Factor | Beta Coefficient (SE) | Beta Coefficient (SE) |
| INTERCEPT | −4.13 | −5.23 |
| Demographics | ||
| Female | 0.20 | 0.20 |
| Age 36–45 | 0.01 | 0.12 |
| Age 46–55 | 0.14 | 0.16 |
| Age 56–65 | 0.24 | 0.12 |
| Age >=66 | 0.35 | 0.30 |
| Race (African American) | −0.03 | 0.07 |
| Race (Other) | −0.05 | 0.36 |
| Race (Unknown) | 0.23 | 0.28 |
| Medications | ||
| Amphotericin B | 2.08 | 2.13 |
| Cyclosporine | 1.10 | 0.74 |
| Loop Diuretics | 0.73 | 0.81 |
| Thiazide Diuretics | 0.41 | 0.64 |
| Aminoglycosides | 0.43 | 0.40 |
| NSAID | 0.12 | 0.21 |
| K-Sparing Diuretics | 0.19 | 0.17 |
| Acyclovir | −0.02 | −0.41 |
| Cisplatin | −0.48 | −1.01 |
| CT Scan w/ contrast | −0.08 | −0.17 |
| ARB | −0.04 | −0.24 |
| ACE | −0.22 | −0.36 |
| Clinical Condition Associations (Lab) | ||
| Bacterial Infection (Any Antibiotic Use) | 0.56 | 1.04 |
| Mean Admission Creatinine | −0.32 | −0.62 |
| Myocardial Infarction (Yes / Unknown) | 0.10 / 0.10 | 0.37 / 0.10 |
| Rhabdomyolysis (Yes / Unknown) | −0.02 / 0.01 | −0.07 / −0.28 |
| Acute Hepatitis (Yes / Unknown) | 0.50 / 0.03 | 0.62 / −0.12 |
| Acute Pancreatitis (Yes / Unknown) | −0.17 / −0.11 | −0.20 / −0.15 |
| Hyperammonemia | 0.32 / −0.17 | 0.62 / 0.06 |
| AST/ALT Ratio > 1.5 | 0.62 / 0.01 | 0.55 / −0.13 |
| Thrombocytopenia | 0.57 / −0.17 | 0.75 / 0.00 |
| Leukocytosis | 0.00 / −0.03 | 0.09 / 0.27 |
| Hypercalcemia (corrected) | 0.42 / 0.03 | 0.05 / 0.08 |
| Mean Glucose >250 mg/dL | 0.99 | 0.94 |
| Mean Glucose 200–250 mg/dL | 0.71 | 0.63 |
| Mean Glucose 150–200 mg/dL | 0.49 | 0.33 |
| Mean Glucose Unknown | 0.47 | −0.17 |
Example: Calculation of the risk of AKI Injury for a Hispanic man aged 50 with a mean admission creatinine of 1.4. During the first 48 hours, the patient received a CT scan with contrast, an antibiotic that is not an aminoglycoside, an ACE inhibitor, a thiazide diuretic, and is given loop diuretics. Relevant laboratory tests reveal a mean glucose of 225, leukocytosis, and an albumin-corrected hypercalcemia. The remaining laboratory tests were normal, except that tests for myocardial infarction and rhabdomyolysis were not ordered. In the following equation, brackets identify the variable name and parentheses identify the variable value. The equation includes all of the other variables, but their values are 0, which results in that beta coefficient * the variable value being equal to 0. For this patient: Z = −5.23*(always 1)[intercept] + 0.16*(1)[age 50] + 0.36*(1)[Hispanic] + −0.62*(1.4)[Creatinine] + −0.17*(1)[CT Scan] + 1.04*(1)[antibiotic] + −0.36*(1)[ACE] + 0.64*(1)[Thiazide] + 0.81*(1)[Loop diuretic] + 0.63*(1)[glucose 200–250] + 0.09*(1)[leukocytosis] + 0.05*(1)[hypercalcemia] +0.10*(1)[MI] −0.28*(1)[Rhabdo]= −3.03. Probability of AKI Injury= 1 / ( 1 + exp(−(−3.03))) = 0.046 or 4.6%
REFERENCES
- 1.Uchino S, Kellum JA, Bellomo R, et al. Acute renal failure in critically ill patients: a multinational, multicenter study. JAMA. 2005 Aug 17;294(7):813–818. doi: 10.1001/jama.294.7.813. [DOI] [PubMed] [Google Scholar]
- 2.Hou SH, Bushinsky DA, Wish JB, Cohen JJ, Harrington JT. Hospital-acquired renal insufficiency: a prospective study. Am J Med. 1983 Feb;74(2):243–248. doi: 10.1016/0002-9343(83)90618-6. [DOI] [PubMed] [Google Scholar]
- 3.Brivet FG, Kleinknecht DJ, Loirat P, Landais PJ. Acute renal failure in intensive care units--causes, outcome, and prognostic factors of hospital mortality; a prospective, multicenter study. French Study Group on Acute Renal Failure. Crit Care Med. 1996 Feb;24(2):192–198. doi: 10.1097/00003246-199602000-00003. [DOI] [PubMed] [Google Scholar]
- 4.Liano F, Junco E, Pascual J, Madero R, Verde E. The spectrum of acute renal failure in the intensive care unit compared with that seen in other settings. The Madrid Acute Renal Failure Study Group. Kidney International - Supplement. 1998 May;66:S16–S24. [PubMed] [Google Scholar]
- 5.Metnitz PG, Krenn CG, Steltzer H, et al. Effect of acute renal failure requiring renal replacement therapy on outcome in critically ill patients. Critical Care Medicine. 2002 Sep;30(9):2051–2058. doi: 10.1097/00003246-200209000-00016. [see comment] [DOI] [PubMed] [Google Scholar]
- 6.Turney JH, Marshall DH, Brownjohn AM, Ellis CM, Parsons FM. The evolution of acute renal failure, 956–1988. Quarterly Journal of Medicine. 1990 Jan;74(273):83–104. [PubMed] [Google Scholar]
- 7.Ympa YP, Sakr Y, Reinhart K, Vincent J-L. Has mortality from acute renal failure decreased? A systematic review of the literature. The American Journal of Medicine. 2005;118(8):827. doi: 10.1016/j.amjmed.2005.01.069. [DOI] [PubMed] [Google Scholar]
- 8.Liano F, Pascual J. Epidemiology of acute renal failure: a prospective, multicenter, community-based study. Madrid Acute Renal Failure Study Group. Kidney Int. 1996 Sep;50(3):811–818. doi: 10.1038/ki.1996.380. [DOI] [PubMed] [Google Scholar]
- 9.Wang Y, Cui Z, Fan M. Hospital-Acquired and Community-Acquired Acute Renal Failure in Hospitalized Chinese: A Ten-Year Review. Renal Failure. 2007;29(2):163–168. doi: 10.1080/08860220601095918. [DOI] [PubMed] [Google Scholar]
- 10.Hunt JP, Meyer AA. Predicting survival in the intensive care unit. Current Problems in Surgery. 1997 Jul;34(7):527–599. [PubMed] [Google Scholar]
- 11.Randolph AG, Guyatt GH, Carlet J. Understanding articles comparing outcomes among intensive care units to rate quality of care. Evidence Based Medicine in Critical Care Group. Critical Care Medicine. 1998 Apr;26(4):773–781. doi: 10.1097/00003246-199804000-00032. [DOI] [PubMed] [Google Scholar]
- 12.Topol EJ, Block PC, Holmes DR, Klinke WP, Brinker JA. Readiness for the scorecard era in cardiovascular medicine. American Journal of Cardiology. 1995 Jun 1;75(16):1170–1173. doi: 10.1016/s0002-9149(99)80752-8. [DOI] [PubMed] [Google Scholar]
- 13.Matheny ME, Ohno-Machado L, Resnic FS. Risk-adjusted sequential probability ratio test control chart methods for monitoring operator and institutional mortality rates in interventional cardiology. Am Heart J. 2008 Jan;155(1):114–120. doi: 10.1016/j.ahj.2007.08.022. [DOI] [PubMed] [Google Scholar]
- 14.Esserman L, Belkora J, Lenert L. Potentially ineffective care. A new outcome to assess the limits of critical care. JAMA. 1995 Nov 15;274(19):1544–1551. doi: 10.1001/jama.274.19.1544. [DOI] [PubMed] [Google Scholar]
- 15.Cher DJ, Lenert LA. Method of Medicare reimbursement and the rate of potentially ineffective care of critically ill patients. JAMA. 1997 Sep 24;278(12):1001–1007. [see comment][erratum appears in JAMA 1998 Jun 17;279(23):1876] [PubMed] [Google Scholar]
- 16.Mendez-Tellez PA, Dorman T. Predicting patient outcomes, futility, and resource utilization in the intensive care unit: the role of severity scoring systems and general outcome prediction models.[comment] Mayo Clinic Proceedings. 2005 Feb;80(2):161–163. doi: 10.4065/80.2.161. [DOI] [PubMed] [Google Scholar]
- 17.McCullough PA, Adam A, Becker CR, et al. Risk Prediction of Contrast-Induced Nephropathy. The American Journal of Cardiology. 2006;98(6, Supplement 1):27. doi: 10.1016/j.amjcard.2006.01.022. [DOI] [PubMed] [Google Scholar]
- 18.Chertow GM, Lazarus JM, Christiansen CL, et al. Preoperative renal risk stratification. Circulation. 1997 Feb 18;95(4):878–884. doi: 10.1161/01.cir.95.4.878. [DOI] [PubMed] [Google Scholar]
- 19.Fortescue EB, Bates DW, Chertow GM. Predicting acute renal failure after coronary bypass surgery: cross-validation of two risk-stratification algorithms. Kidney International. 2000 Jun;57(6):2594–2602. doi: 10.1046/j.1523-1755.2000.00119.x. [DOI] [PubMed] [Google Scholar]
- 20.Aronson S, Fontes ML, Miao Y, Mangano DT. Risk index for perioperative renal dysfunction/failure: critical dependence on pulse pressure hypertension. Circulation. 2007 Feb 13;115(6):733–742. doi: 10.1161/CIRCULATIONAHA.106.623538. [DOI] [PubMed] [Google Scholar]
- 21.Wijeysundera DN, Karkouti K, Dupuis JY, et al. Derivation and validation of a simplified predictive index for renal replacement therapy after cardiac surgery. JAMA. 2007 Apr 25;297(16):1801–1809. doi: 10.1001/jama.297.16.1801. [DOI] [PubMed] [Google Scholar]
- 22.FitzHenry F, Peterson JF, Arrieta M, Waitman LR, Schildcrout JS, Miller RA. Medication administration discrepancies persist despite electronic ordering. J Am Med Inform Assoc. 2007 Nov-Dec;14(6):756–764. doi: 10.1197/jamia.M2359. Epub 2007 Aug 2021. [DOI] [PMC free article] [PubMed] [Google Scholar]
- 23.Levey AS, Greene T, Kusek J, Beck GL. A simplified equation to predict GFR from serum creatinine. J Am Soc Nephrol. 2000;11:155A. Abstract. [Google Scholar]
- 24.Bellomo R, Ronco C, Kellum JA, Mehta RL, Palevsky P. Acute renal failure - definition, outcome measures, animal models, fluid therapy and information technology needs: the Second International Consensus Conference of the Acute Dialysis Quality Initiative (ADQI) Group. Crit Care. 2004 Aug;8(4):R204–R212. doi: 10.1186/cc2872. Epub 2004 May 2024. [DOI] [PMC free article] [PubMed] [Google Scholar]
- 25.Roe MT, Peterson ED, Li Y, et al. Relationship Between Risk Stratification by Cardiac Troponin Level and Adherence to Guidelines for Non-ST-Segment Elevation Acute Coronary Syndromes. Arch Intern Med. 2005 Sep 12;165(16):1870–1876. doi: 10.1001/archinte.165.16.1870. 2005. [DOI] [PubMed] [Google Scholar]
- 26.Newall N, Oo AY, Palmer ND, et al. Intermediate and high peri-operative cardiac enzyme release following isolated coronary artery bypass surgery are independently associated with higher one-year mortality. J Cardiothorac Surg. 2006;1:20. doi: 10.1186/1749-8090-1-20. [DOI] [PMC free article] [PubMed] [Google Scholar]
- 27.Vanholder R, Sever MS, Erek E, Lameire N. Rhabdomyolysis. J Am Soc Nephrol. 2000 Aug 1;11(8):1553–1561. doi: 10.1681/ASN.V1181553. 2000. [DOI] [PubMed] [Google Scholar]
- 28.Banks PA. Practice guidelines in acute pancreatitis. Am J Gastroenterol. 1997 Mar;92(3):377–386. [PubMed] [Google Scholar]
- 29.Lemeshow S, Hosmer DW., Jr A review of goodness of fit statistics for use in the development of logistic regression models. Am J Epidemiol. 1982 Jan;115(1):92–106. doi: 10.1093/oxfordjournals.aje.a113284. [DOI] [PubMed] [Google Scholar]
- 30.Hanley JA, McNeil BJ. The meaning and use of the area under a receiver operating characteristic (ROC) curve. Radiology. 1982 Apr;143(1):29–36. doi: 10.1148/radiology.143.1.7063747. [DOI] [PubMed] [Google Scholar]
- 31.Harrell FE, Lee KL, Mark DB. Multivariable Prognostic Models: Issues in Developing Models, Evaluating Assumptions and Adequacy, and Measuring and Reducing Errors. Statistics in Medicine. 1996;15(4):361–387. doi: 10.1002/(SICI)1097-0258(19960229)15:4<361::AID-SIM168>3.0.CO;2-4. [DOI] [PubMed] [Google Scholar]
- 32.Molinaro AM, Simon R, Pfeiffer RM. Prediction error estimation: a comparison of resampling methods. Bioinformatics. 2005 Aug 1;21(15):3301–3307. doi: 10.1093/bioinformatics/bti499. [DOI] [PubMed] [Google Scholar]
- 33.Pepe MS, Feng Z, Huang Y, et al. Integrating the predictiveness of a marker with its performance as a classifier. Am J Epidemiol. 2008 Feb 1;167(3):362–368. doi: 10.1093/aje/kwm305. [DOI] [PMC free article] [PubMed] [Google Scholar]
- 34.Mehran R, Aymong ED, Nikolsky E, et al. A simple risk score for prediction of contrast-induced nephropathy after percutaneous coronary intervention: development and initial validation. J Am Coll Cardiol. 2004 Oct 6;44(7):1393–1399. doi: 10.1016/j.jacc.2004.06.068. [DOI] [PubMed] [Google Scholar]
- 35.Schetz M, Vanhorebeek I, Wouters PJ, Wilmer A, Van den Berghe G. Tight blood glucose control is renoprotective in critically ill patients. J Am Soc Nephrol. 2008 Mar;19(3):571–578. doi: 10.1681/ASN.2006101091. [DOI] [PMC free article] [PubMed] [Google Scholar]
- 36.Matheny ME, Ohno-Machado L, Resnic FS. Monitoring device safety in interventional cardiology. J Am Med Inform Assoc. 2006 Mar-Apr;13(2):180–187. doi: 10.1197/jamia.M1908. [DOI] [PMC free article] [PubMed] [Google Scholar]
- 37.Matheny ME, Ohno-Machado L, Resnic FS. Discrimination and calibration of mortality risk prediction models in interventional cardiology. J Biomed Inform. 2005 Oct;38(5):367–375. doi: 10.1016/j.jbi.2005.02.007. [DOI] [PubMed] [Google Scholar]
- 38.Poggio ED, Wang X, Greene T, Van Lente F, Hall PM. Performance of the Modification of Diet in Renal Disease and Cockcroft-Gault Equations in the Estimation of GFR in Health and in Chronic Kidney Disease. J Am Soc Nephrol. 2005 Feb 1;16(2):459–466. doi: 10.1681/ASN.2004060447. 2005. [DOI] [PubMed] [Google Scholar]
- 39.Poggio ED, Nef PC, Wang X, et al. Performance of the Cockcroft-Gault and modification of diet in renal disease equations in estimating GFR in ill hospitalized patients. American Journal of Kidney Diseases. 2005 Aug;46(2):242–252. doi: 10.1053/j.ajkd.2005.04.023. [DOI] [PubMed] [Google Scholar]
- 40.Taber SS, Mueller BA. Drug-Associated Renal Dysfunction. Critical Care Clinics. 2006;22(2):357. doi: 10.1016/j.ccc.2006.02.003. [DOI] [PubMed] [Google Scholar]
- 41.Prins JM, Buller HR, Kuijper EJ, Tange RA, Speelman P. Once versus thrice daily gentamicin in patients with serious infections. Lancet. 1993 Feb 6;341(8841):335–339. doi: 10.1016/0140-6736(93)90137-6. [see comment] [DOI] [PubMed] [Google Scholar]
- 42.Hatala R, Dinh TT, Cook DJ. Single daily dosing of aminoglycosides in immunocompromised adults: a systematic review. Clinical Infectious Diseases. 1997 May;24(5):810–815. doi: 10.1093/clinids/24.5.810. [see comment] [DOI] [PubMed] [Google Scholar]
- 43.Hock R, Anderson RJ. Prevention of drug-induced nephrotoxicity in the intensive care unit. J Crit Care. 1995 Mar;10(1):33–43. doi: 10.1016/0883-9441(95)90029-2. [DOI] [PubMed] [Google Scholar]
- 44.Whelton A. Nephrotoxicity of nonsteroidal anti-inflammatory drugs: physiologic foundations and clinical implications. Am J Med. 1999 May 31;106(5B):13S–24S. doi: 10.1016/s0002-9343(99)00113-8. [DOI] [PubMed] [Google Scholar]
- 45.Tran DD, Oe PL, de Fijter CW, van der Meulen J, Cuesta MA. Acute renal failure in patients with acute pancreatitis: prevalence, risk factors, and outcome. Nephrol Dial Transplant. 1993;8(10):1079–1084. [PubMed] [Google Scholar]
- 46.Walsh TJ, Hiemenz JW, Seibel NL, et al. Amphotericin B lipid complex for invasive fungal infections: analysis of safety and efficacy in 556 cases. Clinical Infectious Diseases. 1998 Jun;26(6):1383–1396. doi: 10.1086/516353. [see comment] [DOI] [PubMed] [Google Scholar]
- 47.Perazella MA. Drug-induced renal failure: update on new medications and unique mechanisms of nephrotoxicity. Am J Med Sci. 2003 Jun;325(6):349–362. doi: 10.1097/00000441-200306000-00006. [DOI] [PubMed] [Google Scholar]
- 48.Perez-Valdivieso JR, Bes-Rastrollo M, Monedero P, de Irala J, Lavilla FJ. Prognosis and serum creatinine levels in acute renal failure at the time of nephrology consultation: an observational cohort study. BMC Nephrol. 2007 Sep 26;8:14. doi: 10.1186/1471-2369-8-14. [DOI] [PMC free article] [PubMed] [Google Scholar]
- 49.Nash K, Hafeez A, Hou S. Hospital-acquired renal insufficiency. American Journal of Kidney Diseases. 2002 May;39(5):930–936. doi: 10.1053/ajkd.2002.32766. [DOI] [PubMed] [Google Scholar]
- 50.Mehta RL, Pascual MT, Soroko S, et al. Spectrum of acute renal failure in the intensive care unit: the PICARD experience. Kidney International. 2004 Oct;66(4):1613–1621. doi: 10.1111/j.1523-1755.2004.00927.x. [DOI] [PubMed] [Google Scholar]
- 51.McCullough PA, Adam A, Becker CR, et al. Risk prediction of contrast-induced nephropathy. Am J Cardiol. 2006 Sep 18;98(6A):27K–36K. doi: 10.1016/j.amjcard.2006.01.022. Epub 2006 Feb 2023. [DOI] [PubMed] [Google Scholar]
- 52.McCullough PA, Wolyn R, Rocher LL, Levin RN, O'Neill WW. Acute renal failure after coronary intervention: incidence, risk factors, and relationship to mortality. Am J Med. 1997 Nov;103(5):368–375. doi: 10.1016/s0002-9343(97)00150-2. [DOI] [PubMed] [Google Scholar]
- 53.Thadhani R, Pascual M, Bonventre JV. Acute renal failure. N Engl J Med. 1996 May 30;334(22):1448–1460. doi: 10.1056/NEJM199605303342207. [DOI] [PubMed] [Google Scholar]
- 54.Novis BK, Roizen MF, Aronson S, Thisted RA. Association of preoperative risk factors with postoperative acute renal failure. Anesth Analg. 1994 Jan;78(1):143–149. doi: 10.1213/00000539-199401000-00023. [DOI] [PubMed] [Google Scholar]