Abstract
Hematopoietic stem cells (HSCs) reside in a perivascular niche but the location remains controversial1. HSCs are rare and few can be found in thin tissue sections2,3 or upon live imaging4, making it difficult to comprehensively localize dividing and non-dividing HSCs. We discovered that α-catulinGFP/+ was expressed by only 0.02% of bone marrow hematopoietic cells, including virtually all HSCs. One in 3.5 α-catulin-GFP+c-kit+ cells gave long-term multilineage reconstitution of irradiated mice, indicating that α-catulin-GFP+c-kit+ cells contain HSCs with a purity comparable to the best markers available. We were able to optically clear the bone marrow to perform deep confocal imaging, making it possible to image thousands of α-catulin-GFP+c-kit+ cells and to digitally reconstruct large segments of bone marrow. The distribution of α-catulin-GFP+c-kit+ cells indicated that HSCs were more common in central marrow than near bone surfaces and in the diaphysis relative to the metaphysis. Nearly all HSCs contacted Leptin Receptor+ and Cxcl12high niche cells. Approximately 85% of HSCs were within 10μm of a sinusoidal blood vessel. Most HSCs were distant from arterioles, transition zone vessels, and bone surfaces. This was true of Ki-67+ dividing HSCs and Ki-67− non-dividing HSCs. Dividing and non-dividing HSCs thus reside mainly in perisinusoidal niches with Leptin Receptor+Cxcl12high cells throughout the bone marrow.
Adult hematopoietic stem cells (HSCs) reside in a perivascular niche in the bone marrow in which Leptin Receptor+ (LepR+) perivascular stromal cells and endothelial cells secrete factors that promote their maintenance5–9. Nearly all of the cells that express high levels of Scf or Cxcl12 in the bone marrow are LepR+ 10. Conditional deletion of Scf from LepR+ cells and endothelial cells eliminates all quiescent and serially-transplantable HSCs from adult bone marrow11. The perivascular niche cells we identified based on LepR expression have also been identified by others based on their expression of high levels of Cxcl125,12,13, low levels of the Nestin-GFP transgene14,15, PDGFR10,16, and Prx-1-Cre8.
Established elements of the HSC niche localize primarily around sinusoids in bone marrow including HSCs2,3,17, LepR+ stromal cells6, Angiopoietin-1-expressing stromal cells18,19, Scf-expressing stromal cells6, Cxcl12high stromal cells5,12,20 and mesenchymal stem/stromal cells10,18,20. Moreover, sinusoidal endothelial cells are functionally important for hematopoiesis after myeloablation21. HSCs have also been suggested to reside in a hypoxic niche22 and the most hypoxic region of the bone marrow is around sinusoids23. Nonetheless, HSC niches have also been suggested to localize near bone surfaces or around arterioles24.
It has been suggested that dividing HSCs reside in a niche that is spatially distinct from quiescent HSCs24. However, dividing HSCs are even more rare than non-dividing HSCs making it difficult to find significant numbers of those cells within tissue sections. HSC imaging throughout the bone marrow is limited by the inability of even multiphoton microscopy to penetrate more than 150μm into bone marrow4. Optical clearing techniques have enabled deep imaging of various tissues25,26, including hematopoietic progenitors in embryos27, but have not been used to image rare stem cells or to digitally reconstruct bone marrow.
Gene expression profiling showed that α-catulin is highly restricted in its expression to HSCs3. α-catulin encodes a protein with homology to α-catenin that has been suggested to function as a cytoskeletal linker28. By quantitative real time RT-PCR (qRT-PCR) we found that α-catulin was expressed at 19±9.3 (mean±SD) fold higher levels in CD150+CD48−Lin−Sca-1+c-kit+ (CD150+CD48−LSK) HSCs as compared to unfractionated bone marrow cells.
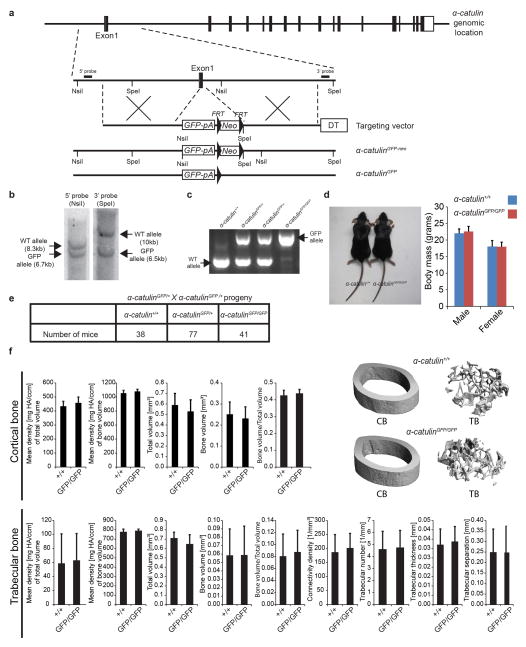
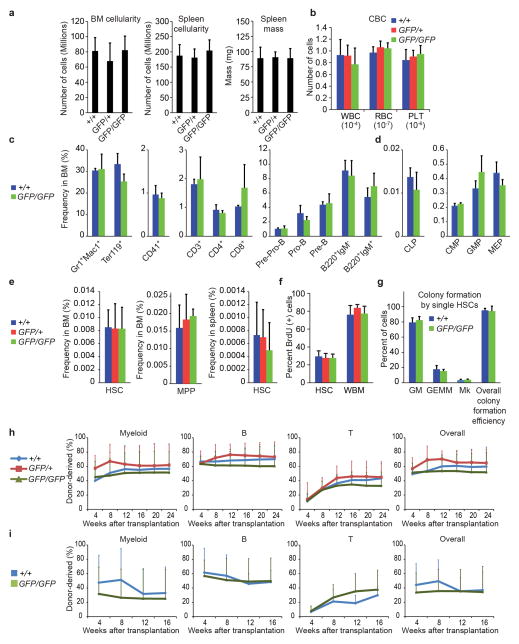
To assess α-catulin expression in detail we knocked GFP into the first exon of α-catulin in frame with the start codon (Extended data figure 1a). Although this was predicted to be a loss of function allele, both α-catulinGFP/+ and α-catulinGFP/GFP mice were born and survived into adulthood with expected Mendelian frequencies (Extended data figure 1e). Young adult α-catulinGFP/GFP mice were normal in size and body mass (Extended data figure 1d) as well as bone density and bone volume (Extended data figure 1f) relative to littermate controls. α-catulinGFP/+ and α-catulinGFP/GFP mice exhibited normal hematopoiesis as well as normal HSC frequency, HSC cell cycle kinetics, and normal HSC function upon primary and secondary transplantation into irradiated mice (Extended data figure 2).
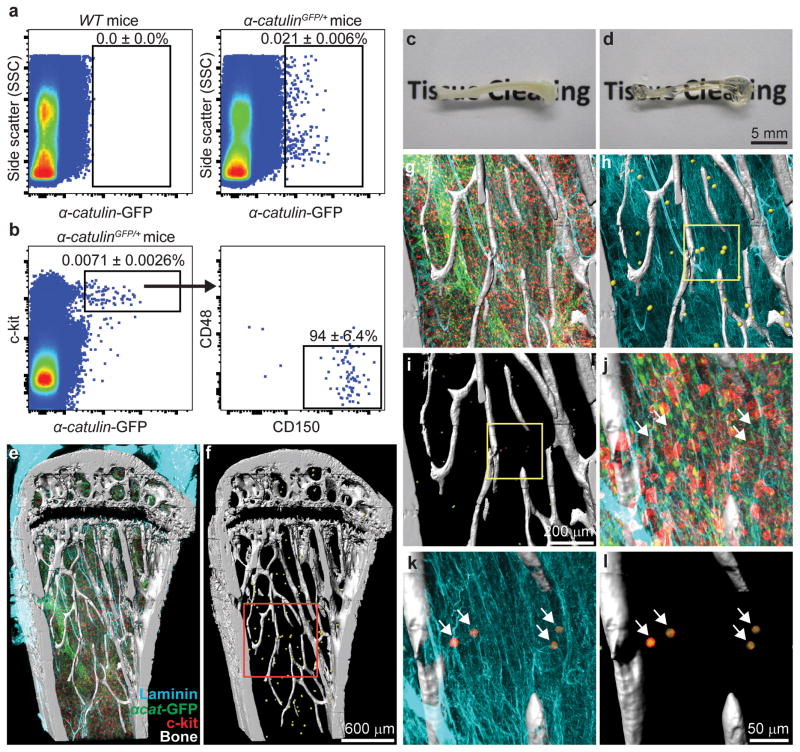
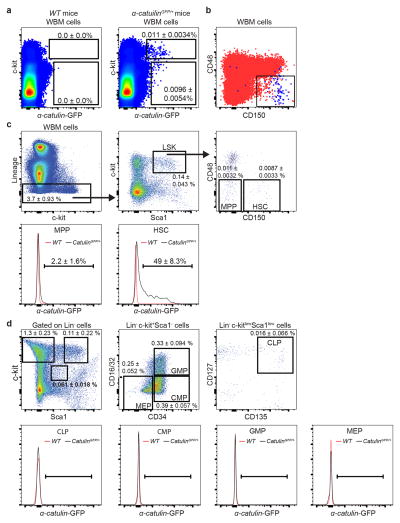
Only 0.021±0.006% of WBM cells in α-catulinGFP/+ mice were α-catulin-GFP+ (Figure 1a). Most of the α-catulin-GFP+ cells were c-kit+ (Extended data figure 3a) and 49±8.3% of CD150+CD48−LSK HSCs were α-catulin-GFP+ (Extended data figure 3c). We did not detect α-catulin-GFP expression among MPPs, CLPs, CMPs, GMPs, or MEPs (Extended data figure 3c–d). α-catulin-GFP+c-kit+ cells appeared to be highly purified HSCs as they represented only 0.007±0.003% of WBM cells and were uniformly CD150+ and CD48− (Figure 1b and Extended data figure 3b).
Figure 1. Deep imaging of α-catulin-GFP+ HSCs in digitally reconstructed bone marrow.
a, Only 0.021±0.006% of α-catulinGFP/+ bone marrow cells were GFP+ (n=14 mice in 11 independent experiments). b, Nearly all α-catulin-GFP+c-kit+ bone marrow cells were CD150+CD48− (n=9 mice in 3 independent experiments; Extended data figure 3b shows ungated cells from this analysis and Extended data figure 5 shows light scatter properties). c–d, A half tibia before (c) and after clearing (d). e–l, Deep imaging of α-catulin-GFP+c-kit+ HSCs in the epiphysis and metaphysis of a half tibia (360 μm thick) showing digital bone surfaces (second harmonic generation, white), as well as blood vessels (laminin, blue), hematopoietic progenitors (c-kit+, red), and α-catulin-GFP+ cells (green). Endothelial cells express α-catulin-GFP but were easily distinguished from α-catulin-GFP+c-kit+ HSCs based on c-kit expression and morphology. In two dimensional projected images of thick specimens, α-catulin-GFP+ cells and c-kit+ cells can appear much more frequent than they actually are because all of the cells from the thick specimens are collapsed into a single optical plane. f) Same as (e), digitally masked to reveal only HSCs and bone. α-catulin-GFP+c-kit+ HSCs are represented by yellow spheres to make them visible at this magnification. g–i) A higher magnification view of the boxed region from panel f. Panel h digitally masks all hematopoietic cells other than HSCs (yellow spheres). Panel i digitally masks blood vessels and hematopoietic cells other than HSCs. j–l) A higher magnification view of the boxed area from panel i (arrows point to α-catulin-GFP+c-kit+ cells). Images are representative of three independent experiments. Supplementary video 1 shows a three dimensional digital reconstruction of bone and bone marrow. The positions of HSCs and other structures can appear to change in thick specimens when magnification is changed due to the rendering perspective for 3 dimensional display of volume data.
To test the function of α-catulin-GFP+ cells we performed long-term competitive reconstitution assays in irradiated mice. One in 37,000 WBM cells gave long-term multilineage reconstitution (Table 1). One in 6.7 α-catulin-GFP+ cells gave long-term multilineage reconstitution (Table 1). In contrast, only 1 in 2,847,000 α-catulin-GFP− bone marrow cells gave long-term multilineage reconstitution (a 77-fold depletion over WBM). The α-catulin-GFP+ fraction of CD150+CD48−LSK cells gave long-term multilineage reconstitution (1 in 3.1 cells) but the α-catulin-GFP− fraction had little HSC activity (1 in 110 cells; Table 1). Therefore, virtually all HSC activity in adult bone marrow is contained within the α-catulin-GFP+ fraction of cells.
Table 1. α-catulin-GFP+ cells were highly enriched for long-term multilineage reconstituting HSCs.
Donor cells were competed against 300,000 recipient WBM cells in irradiated mice. The data reflect means from 2–4 independent experiments per cell population.
| Donor cell population | Donor cell dose | LTMR mice | HSC frequency |
|---|---|---|---|
| Unfractionated bone marrow | 25,000 | 19/27 | 1/37,000 |
| 50,000 | 15/25 | ||
| 100,000 | 21/23 | ||
| 300,000 | 14/14 | ||
|
| |||
| α-catulin-GFP+ | 1 | 2/13 | 1/6.7 |
| 5 | 13/25 | ||
|
| |||
| α-catulin-GFP− | 300,000 | 2/20 | 1/2,847,000 |
|
| |||
| α-catulin-GFP+c-kit+ | 1 | 9/34 | 1/3.5 |
| 5 | 17/23 | ||
| 30 | 14/14 | ||
|
| |||
| α-catulin-GFP−CD150+CD48−Lin−c-kit+Sca1+ | 5 | 2/44 | 1/110 |
|
| |||
| α-catulin-GFP+CD150+CD48−Lin−c-kit+Sca1+ | 5 | 24/30 | 1/3.1 |
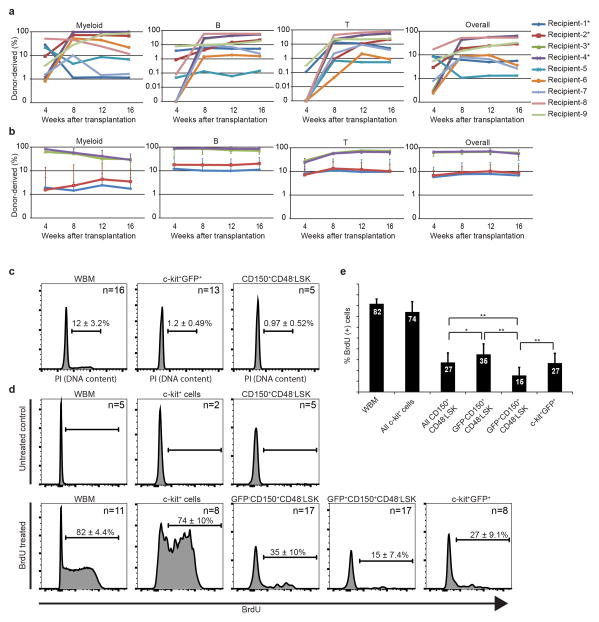
One in 3.5 α-catulin-GFP+c-kit+ cells gave long-term multilineage reconstitution of irradiated primary and secondary recipient mice (Table 1; Extended data figure 4). If HSCs home with near perfect efficiency to engraft hematopoietic tissues then approximately 30% of α-catulin-GFP+c-kit+ cells are HSCs. If a significant fraction of intravenously transplanted HSCs fail to home to hematopoietic tissues, then most α-catulin-GFP+c-kit+ cells may be HSCs. Either way, α-catulin-GFP+c-kit+ cells are comparable in purity to the best HSC markers available.
α-catulin-GFP+c-kit+ cells are quiescent, comparable to CD150+CD48−LSK HSCs, with only 1.2±0.5% of cells in S/G2/M phase of the cell cycle (Extended data figure 4c).
To systematically identify all of the α-catulin-GFP+c-kit+ HSCs within a large segment of bone marrow we implemented a clearing technique25,26, which permitted deep confocal imaging. After antibody staining of half bones or bone marrow plugs from α-catulinGFP/+ mice we cleared the specimens (Figure 1c versus d) then used confocal microscopes to acquire tiled, Z-stacked optical sections throughout the bone marrow to a depth of up to 600 μm.
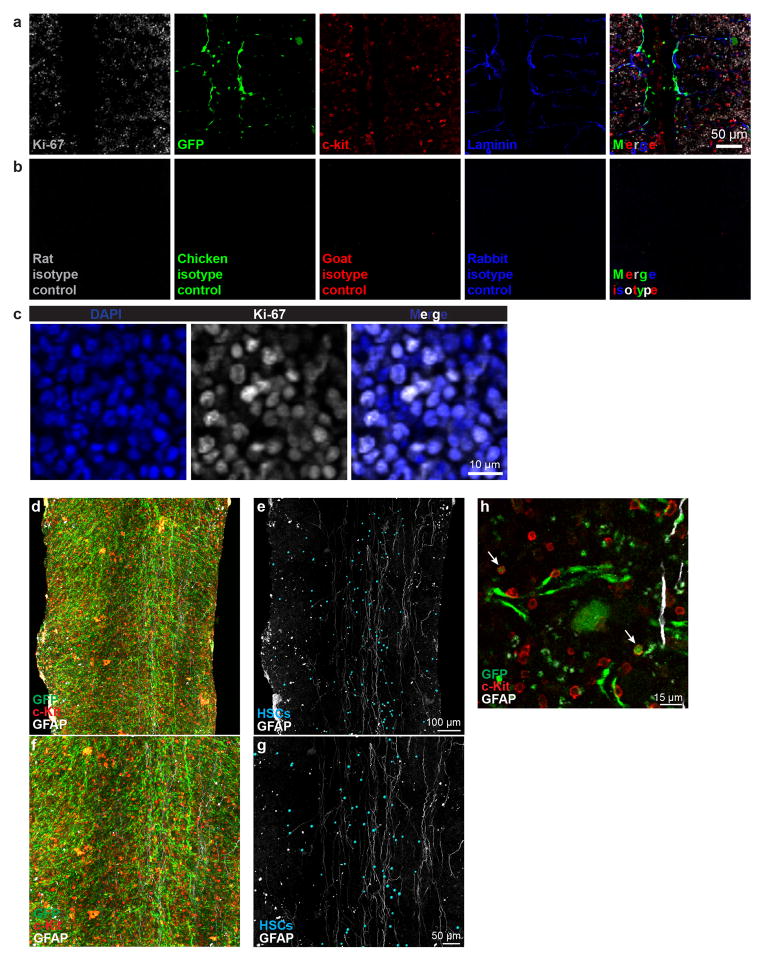
We identified all α-catulin-GFP+c-kit+ cells within large segments of bone marrow (Figure 1e–l). Isotype controls showed low levels of background fluorescence that could readily be distinguished from positive signals (Extended data figure 8a–b). We also prepared videos that animate three-dimensional images of the bone marrow to show HSCs, niche cells, vasculature, and bone surfaces (Supplementary videos 1–3). When thick specimens are collapsed into a single 2 dimensional image, α-catulin-GFP+ cells and c-kit+ cells can appear much more frequent than they actually are because all of the cells from the thick specimens are collapsed into a single 2 dimensional image (e.g. see Extended data figure 7i versus 7j). There are also cases in which an α-catulin-GFP+ cell and a c-kit+ cell are present in different optical planes but appear to be a single α-catulin-GFP+c-kit+ cell when collapsed into a single two dimensional image. For this reason, α-catulin-GFP+c-kit+ cells were individually examined at high magnification in three dimensions to confirm double labeling of single cells.
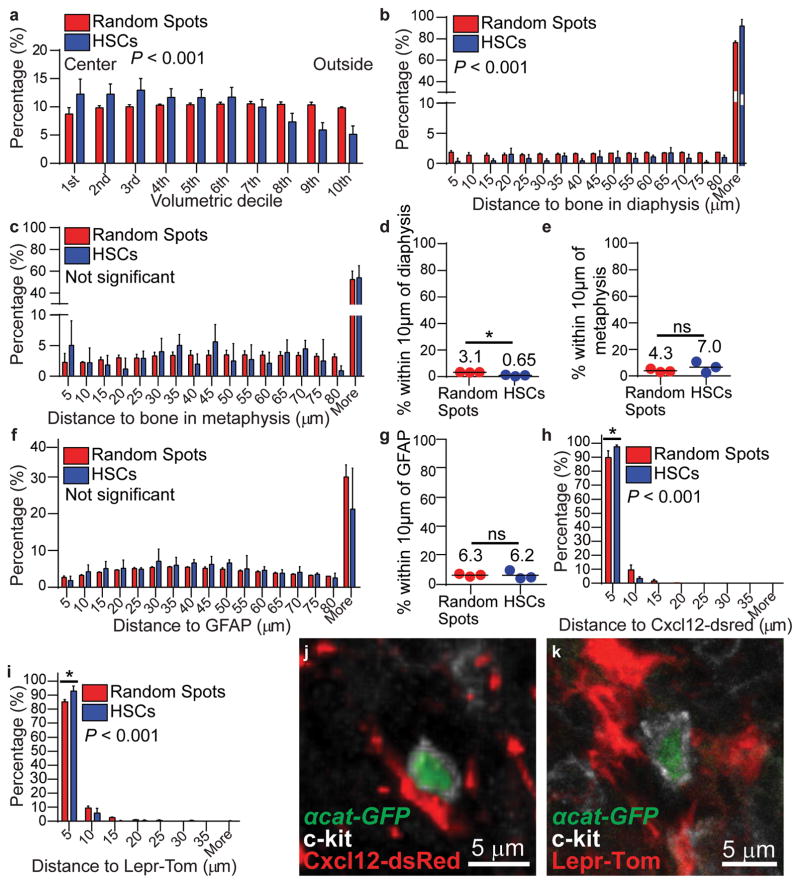
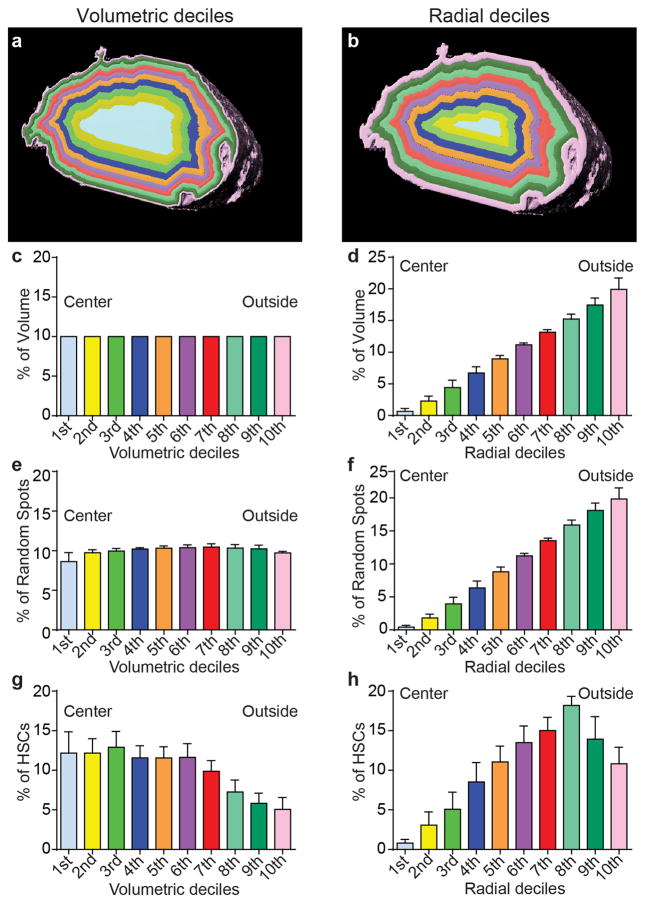
To analyze the location of α-catulin-GFP+c-kit+ HSCs relative to bone surfaces we divided the bone marrow in the tibia diaphysis (shaft) into concentric cylindrical volumes that each encompassed 10% of the marrow volume (Extended data figure 6a). Although HSCs were found throughout the marrow, they were significantly enriched toward the center of the marrow and depleted near the bone surface (Figure 2a, Extended data figure 6g).
Figure 2. HSCs localize adjacent to Cxcl12high and LepR+ niche cells but distant from bone surfaces.
a, The distribution of α-catulin-GFP+c-kit+ HSCs and random spots in concentric cylinders corresponding to equal volumetric deciles from central marrow to endosteal marrow (near the bone surface) from the tibia diaphysis (2977 HSCs in 6 bone marrow plugs (390–550 μm thick) in 6 independent experiments). See Extended data figure 6 for further explanation. Relative to random spots, HSCs were significantly enriched in central marrow. b,c, Distance from HSCs or random spots to the nearest bone surface in the diaphysis (b) or metaphysis (c). d,e, Percentages of all HSCs and random spots within 10μm of a bone surface in the diaphysis (d) or metaphysis (e; b–e show 817 HSCs in the diaphysis and 218 HSCs in the metaphysis of 3 bisected tibias that were 360–400 μm thick). f, Distance to the nearest GFAP+ Schwann cell (n=608 HSCs in bone marrow plugs (430 to 500 μm thick) from the diaphysis of 3 tibias). g, Percentages of all HSCs and random spots within 10μm of a GFAP+ Schwann cell. h, The distance to the nearest Cxcl12high stromal cell (n=596 HSCs in bone marrow plugs (235–450 μm thick) from the diaphysis of 4 tibias). i, Distance to the nearest LepR+ stromal cell in LepR-Cre; tdTomato bone marrow (n=384 HSCs in bone marrow plugs (500 μm thick) from the diaphysis of 3 tibias). j,k, An α-catulin-GFP+c-kit+ cell in apparent contact with a Cxcl12-expressing (j) or a LepR-expressing (k) cell. All data reflect mean±s.d. from at least three independent experiments. The statistical significance of differences in panels a,b,c,f,h,i was assessed by Kolmogorov–Smirnov analysis. The statistical significance of differences in panels d, e, g, h, and i were assessed using Student’s t tests (*, P<0.05).
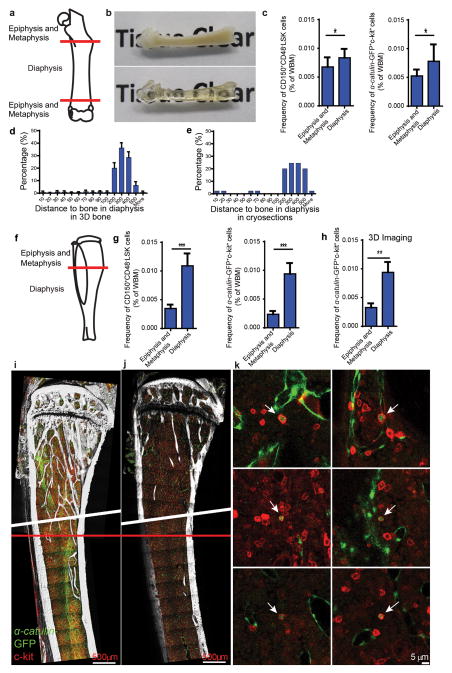
The frequencies of CD150+CD48−LSK HSCs and catulin-GFP+c-kit+ HSCs were both significantly lower in the epiphysis and metaphysis as compared to the diaphysis by flow cytometry in the femur and tibia (using WBM from crushed bones; Extended data figure 7a,c,f,g). Consistent with this, three-dimensional confocal imaging of bisected tibias showed the frequency of α-catulin-GFP+c-kit+ HSCs was significantly lower in the metaphysis as compared to the diaphysis (Extended data figure 7h). Thus, both deep imaging and flow cytometric analysis indicate that HSCs are more enriched in the diaphysis as compared to the metaphysis.
In the diaphysis, α-catulin-GFP+c-kit+ HSCs were significantly less likely than randomly placed spots to localize close to a bone surface (Figure 2b; random spots were distributed throughout areas occupied by hematopoietic cells but excluded from areas occupied by bone or blood vessel lumens). Only 0.65±0.58% of HSCs were within 10μm of a bone surface in the diaphysis (Figure 2d) and 86±6.1% were more than 80μm away (Figure 2b). In the metaphysis, the localization of HSCs relative to bone surfaces did not significantly differ from the distribution of random spots: 7.0±4.1% of HSCs were within 10μm of a bone surface (Figure 2e) and 53±11% were more than 80μm away (Figure 2c). These data are consistent with our observation that fewer than 10% of CD150+CD48−Lineage− HSCs were within 10μm of bone in femur sections2,3.
GFAP+ Schwann cells and nerve fibers clustered in the center of the marrow in the diaphysis (Extended data figure 8d,e). HSCs did not significantly differ from random spots in their distance from GFAP+ cells (Figure 2f). Only 6.2±3.0% of α-catulin-GFP+c-kit+ HSCs were within 10μm of GFAP+ cells in the bone marrow but 28±3.8% were within 30μm (Figure 2f). Thus, HSCs and niche cells rarely have contact with Schwann cells or nerve fibers but a subset of HSCs may be regulated by diffusible factors secreted by Schwann cells29.
HSCs were significantly more likely than random spots to be close to Cxcl12-DsRedhigh stromal cells. 97±1.2% of HSCs were within 5μm of Cxcl12-DsRedhigh stromal cells (Figure 2h). Although Cxcl12high stromal cells represent only 0.3% of WBM cells10, they have long processes that extend throughout the marrow (Suppl. video 2). Consequently, 89±4.9% of random spots were also within 5μm of a Cxcl12-DsRedhigh stromal cell (Figure 2h). 94±2.5% of HSCs appeared to have cell-cell contact with a Cxcl12-DsRedhigh stromal cell (Figure 2j).
93±3.7% of α-catulin-GFP+c-kit+ HSCs were within 5μm of a LepR+ cell (Figure 2i). LepR+ cells were visualized using Lepr-cre; tdTomato mice in these experiments but 99% of Tomato+ bone marrow cells in 8–12 week old Lepr-cre; tdTomato mice also stain with an antibody against LepR10. HSCs were significantly more likely than random spots to be close to LepR+ cells (Figure 2i) and almost always contacted a LepR+ cell (Figure 2k).
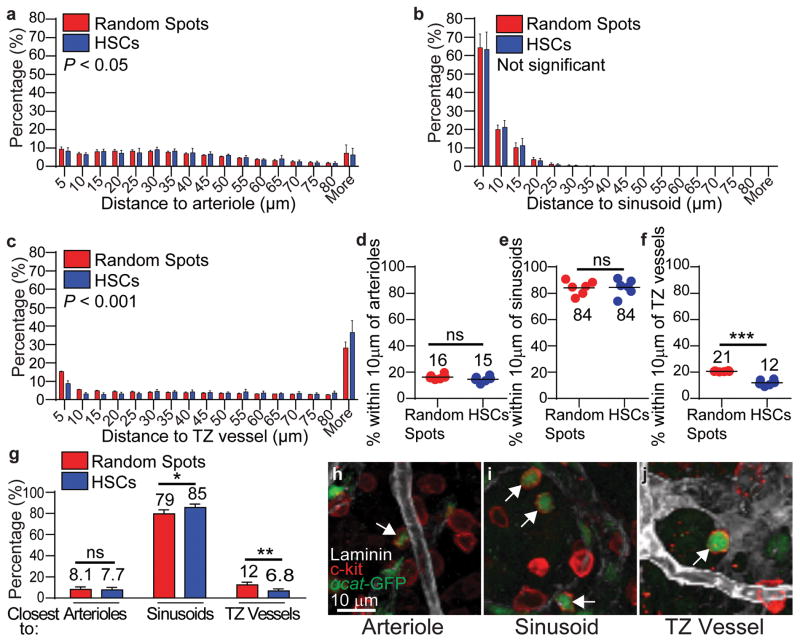
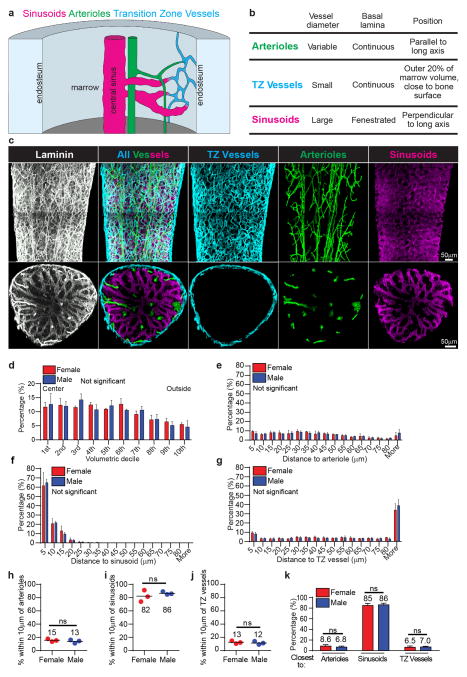
We next imaged the localization of HSCs relative to three kinds of blood vessels in the bone marrow: arterioles, sinusoids, and transition zone capillaries30. We distinguished blood vessels based on anatomical position, size, morphology, and continuity of the basal lamina, visualized using anti-laminin antibody staining (Extended data figure 9a–c). α-catulin-GFP+c-kit+ HSCs significantly differed from random spots in their distance to arterioles: they were slightly less likely than random spots to be within 25μm of an arteriole but slightly more likely than random spots to be 30 to 50μm away (Figure 3a). Only 15±2.3% of HSCs were within 10μm of an arteriole (Figure 3d). In contrast, 84±6.2% of HSCs were within 10μm of a sinusoid (Figure 3e). HSCs did not significantly differ from random spots in their localization relative to sinusoids (Figure 3b), because sinusoids are present throughout the bone marrow.
Figure 3. HSCs localize adjacent to sinusoids but distant from arterioles and transition zone vessels in tibias.
a–c, Distance to the nearest arteriole (a), sinusoid (b), or transition zone vessel (c). d–f, Percentages of all HSCs and random spots within 10μm of an arteriole (d), sinusoid (e), or transition zone vessel (f). g, Percentages of HSCs and random spots that were closest to arterioles, sinusoids, or transition zone vessels. h–j, Representative images of α-catulin-GFP+c-kit+ HSCs (arrows) that localized immediately adjacent to an arteriole (h), a sinusoid (i), or a transition zone vessel (j). All data reflect mean±s.d. from bone marrow plugs (390–550 μm thick) from the diaphysis of 6 tibias. A total of 2977 HSCs were analyzed in 6 independent experiments. In panels a–c the statistical significance was assessed by Kolmogorov–Smirnov analysis. Statistical significance in panels d–g was assessed by Student’s t-tests (*, P<0.05; **, P<0.01; ***, P<0.001).
α-catulin-GFP+c-kit+ HSCs also significantly differed from random spots in their proximity to transition zone blood vessels because they were less likely than random spots to be within 25μm of these vessels (Figure 3c). Only 12±2.1% of HSCs were within 10μm of a transition zone blood vessel (Figure 3f). Since transition zone vessels occupy the outer 20% of bone marrow by volume, the depletion of HSCs near these vessels is consistent with our observation that HSCs are less common near the endosteum (Figure 2a).
Overall, 85±3.1% of α-catulin-GFP+c-kit+ HSCs were closer to sinusoids than other blood vessels (significantly more than random spots; Figure 3g and 3i). Only 7.7±2.3% of HSCs were closest to an arteriole (not significantly different from random spots; Figure 3g and 3h) and 6.8±1.8% were closest to a transition zone vessel (significantly fewer than random spots; Figure 3g and 3j). We have not detected any differences between male and female mice in HSC localization (Extended data figure 9d–k).
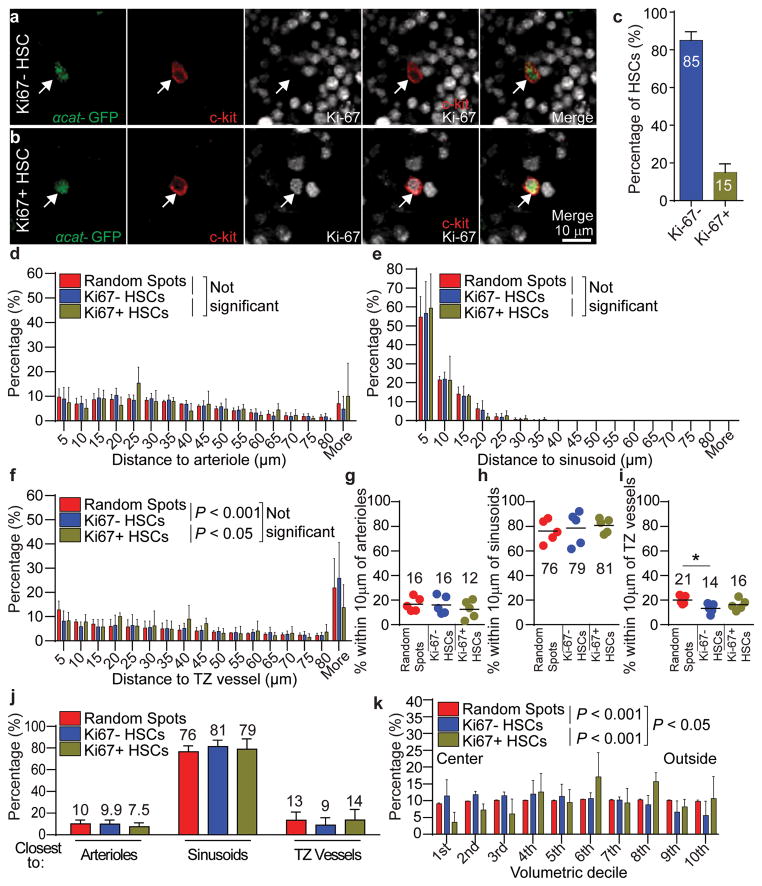
The ability to deep image large segments of bone marrow allowed us to localize much larger numbers of HSCs than prior studies. This allowed us to compare the localization of dividing Ki-67+α-catulin-GFP+c-kit+ HSCs (Figure 4b, c; which accounted for 15±2.0% of HSCs) and non-dividing Ki-67−α-catulin-GFP+c-kit+ HSCs (Figure 4a). Both were most closely associated with sinusoids (Figure 4e): 81±5.9% of Ki-67+α-catulin-GFP+c-kit+ cells and 79±14% Ki-67−α-catulin-GFP+c-kit+ cells were within 10μm of a sinusoid (Figure 4h). Many fewer dividing and non-dividing HSCs were within 10μm of an arteriole (Figure 4d and 4g) or a transition zone vessel (Figure 4f and 4i). None of the differences between dividing and non-dividing HSCs were statistically significant except that dividing HSCs tended to be closer to transition zone vessels.
Figure 4. Dividing and non-dividing HSCs are most closely associated with sinusoids.
a,b, Representative images of a Ki-67−α-catulin-GFP+c-kit+ non-dividing HSC (a, arrow) and a Ki-67+α-catulin-GFP+c-kit+ dividing HSC (b, arrow). c, 15±2.0% of HSCs were Ki-67+. All data reflect mean±s.d. from bone marrow plugs (410–440 μm thick) from the diaphysis of 5 tibias. A total of 2132 HSCs were analyzed in 5 independent experiments. d–f, Distance to the nearest arteriole (d), sinusoid (e), or transition zone vessel (f). g–i, The percentages of all Ki-67− non-dividing HSCs, Ki-67+ dividing HSCs, or random spots within 10μm of an arteriole (g), a sinusoid (h), or a transition zone vessel (i). j, Most Ki-67− non-dividing HSCs and Ki-67+ dividing HSCs were most closely associated with sinusoids. k, The distributions of Ki-67− non-dividing HSCs, Ki-67+ dividing HSCs, and random spots in concentric cylinders corresponding to equal volumetric deciles from central marrow to endosteal (outside) marrow. Non-dividing HSCs were significantly enriched in central marrow while dividing HSCs were significantly enriched toward the endosteum (d–k reflect mean±s.d. from bone marrow plugs from the diaphysis of 5 tibias. A total of 1840 Ki-67− HSCs and 292 Ki-67+ HSCs were analyzed in 5 independent experiments). In panels d–f and k the statistical significance of distribution differences was assessed by Kolmogorov–Smirnov analysis. In panels g–j, statistical significance was assessed by Student’s t-tests (*, P<0.05).
Overall, 81±6.0% of Ki-67−α-catulin-GFP+c-kit+ non-dividing HSCs were most closely associated with sinusoids, 9.0±6.8% with transition zone vessels, and 9.9±3.7% with arterioles (Figure 4j). Ki-67+α-catulin-GFP+c-kit+ dividing HSCs were significantly more likely than Ki-67− α-catulin-GFP+c-kit+ non-dividing HSCs to localize close to the bone surface (Figure 4k).
Based on reconstitution assays (Table 1), at least 30% of α-catulin-GFP+c-kit+ cells are HSCs. Therefore, it is likely that some of the α-catulin-GFP+c-kit+ cells we imaged are not HSCs. If HSCs home to, and engraft, in hematopoietic tissues in competitive transplantation assays with less than perfect efficiency, the HSC purity in this population would be higher than 30%. Even if purity is only 30% and all of the contaminating non-HSCs we imaged were associated with sinusoids, our data would still demonstrate that there are more actual HSCs associated with sinusoids than arterioles or bone surfaces (e.g. subtract 70% from the sinusoid bar in Figure 3g).
Our results are not consistent with the idea that most quiescent HSCs reside in arteriolar niches associated with NG2-CreER-expressing stromal cells24. While Kunisaki et al. concluded that NG2+Nestinhigh cells, not LepR+ cells, express the highest levels of Scf and Cxcl12, the RNAseq data on which this conclusion was based showed that the NestinhighLepR− cells they analyzed were negative for Nestin and positive for Lepr expression (see GSE48764 in the Gene Expression Omnibus24). Thus, their data are consistent with our data in showing that the cells that express Scf and Cxcl12 are LepR+ 10.
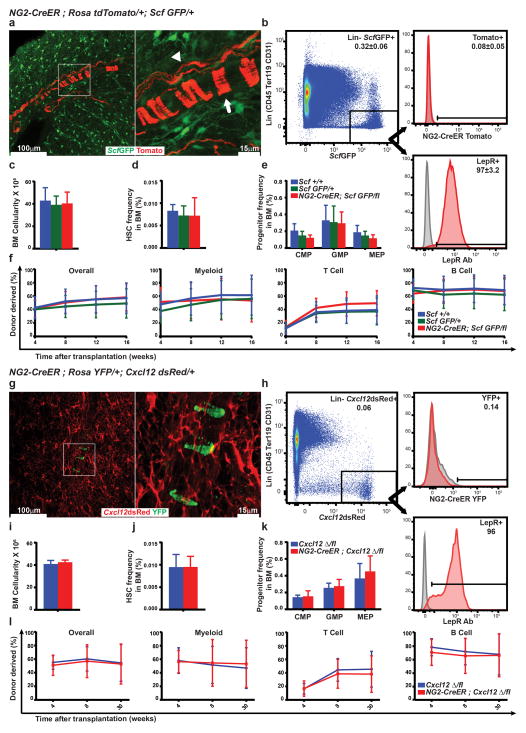
To address this issue directly we generated NG2-CreER; RosatdTomato/+; ScfGFP/+ and NG2-CreER; RosaYFP/+; Cxcl12dsRed/+ mice. While 97% of Scf-GFP+ stromal cells and 96% of Cxcl12-DsRedhigh stromal cells were LepR+, we did not detect any recombination by NG2-CreER in these cells (Extended data figure 10a, b, g, h). We also conditionally deleted Scf or Cxcl12 with NG2-CreER but did not detect any effect on bone marrow cellularity, HSC frequency, hematopoietic progenitor frequency, or bone marrow reconstituting capacity upon transplantation into irradiated mice (Extended data figure 10c–f and i–l). NG2-CreER-expressing cells are therefore not a source of SCF or Cxcl12 for HSC maintenance in the bone marrow.
Our data provide little support for the idea that dividing and non-dividing HSCs reside in spatially distinct niches, with the exception that dividing HSCs were more likely than non-dividing HSCs to localize near the endosteum. Nonetheless, it remains possible that there are distinct perisinusoidal domains for dividing and non-dividing HSCs.
METHODS
Mice
The targeting construct for α-catulinGFP/+ mice was generated by recombineering31. Linearized targeting vector was electroporated into Bruce4 ES cells. Correctly targeted ES cell clones were identified by Southern blotting and injected into C57BL/6-Tyrc-2J blastocysts. The resulting chimeric mice were bred with C57BL/6-Tyrc-2J mice to obtain germline transmission. Then the Frt-Neo-Frt cassette introduced by the targeting vector was removed by mating with Flpe mice32. These mice were backcrossed onto a C57BL/Ka background and germ-line transmission was checked by PCR. C57BL/Ka-Thy-1.1(CD45.2) and C57BL/Ka-Thy-1.2(CD45.1) mice were used in transplant experiments. Male and female mice from eight to twelve weeks old were used for all studies. ScfGFP/+ and Scffl mice6, Cxcl12DsRed/+ and Cxcl12fl mice5, LepR-Cre mice33, Rosa26-CAG-loxp-stop-loxp-tdTomato conditional reporter mice34, Rosa26-loxp-stop-loxp-EYFP conditional reporter mice35, and NG2-CreER mice36 were all previously described. All mice were housed in AAALAC-accredited, specific-pathogen-free animal care facilities at the UT Southwestern Medical Center (UTSW). All procedures were approved by the UTSW Institutional Animal Care and Use Committee.
HSC isolation and flow cytometry
Bone marrow cells were isolated by either flushing the long bones (tibias and femurs), or by crushing the bones using a mortar and pestle in Ca2+ and Mg2+ free Hank’s buffered salt solution (HBSS, Gibco) supplemented with 2% heat inactivated bovine serum (Gibco). Spleen cells were prepared by crushing the spleen between two glass slides. The cells were gently passed through a 25G needle then filtered using a 100 μm mesh to generate a single cell suspension. Viable cell number was calculated using a Vi-Cell cell counter (Beckman Coulter) or by counting manually with a hemocytometer. For HSC identification by flow cytometry, the cells were stained with antibodies against CD150 (TC15-12F12.2), CD48 (HM48-1), Sca1 (E13-161-7), and c-kit (2B8), as well as the following lineage markers: CD42d (1C2), CD2 (RM2-5), CD3 (17A2), CD5 (53-7.3), CD8 (53-6.7), B220 (6B2), Ter119 (TER-119), and Gr1 (8C5). Antibody staining of cell suspensions was always performed at 4°C for 20 minutes. After antibody staining, the cells were stained with the viability dyes 4′,6-diamidino-2-phenylindole (DAPI; 2 μg/ml in PBS) or propidium iodide (PI; 1 μg/ml) to exclude dead cells during flow cytometry. To identify other hematopoietic progenitors (CLPs, CMPs, GMPs and MEPs; see Extended data figure 3) we stained cell suspensions with antibodies against CD34 (RAM34), CD127 (Il7Rα, A7R34), CD16/32 (FcγR, 93), Sca1 (E13-161-7), c-kit (2B8) and the lineage markers listed above. Stains that involved anti-CD34 antibody were conducted for 90 minutes on ice. To identify myeloid cells, erythrocytes, megakaryocytes, T cells, B cell progenitors and B cells the following antibodies were used: anti-Gr1 (8C5), anti-CD11b (Mac1, M1-70), anti-Ter119 (TER-119), anti-CD41(MWReg30), anti-CD3 (17A2), anti-CD4 (GK1.5), anti-CD8 (53-6.7), anti-B220 (6B2), anti-IgM (II/41), anti-CD24 (M1/69), and anti-CD43 (1B11). For extended data figure 10, Ter119 (TER-119), CD45 (30-F11), and CD31 (MEC13.3) antibodies were used to mark erythrocytes, nucleated hematopoietic cells, and endothelial cells respectively. Goat anti-mouse Leptin Receptor biotinylated antibody (BAF497, Fisher Scientific) and Streptavidin-BV421 (405226, Biolegend) were used to mark LepR+ cells. Antibodies were conjugated to one of the following dyes depending on the experiment and cell population: PE-Cy5, PerCP-eFluor710, PE-Cy7, PE, APC, APCeFluor 780, APC-H7, PerCP-Cy5.5, eFluor 660, Alexa Fluor 700, PE-Cy5.
Colony formation in methylcellulose
Individual HSCs were sorted into methylcellulose culture medium (3434, Stemcell Technologies) in 96 well plates (one cell/well). After sorting the plates were kept at 37°C in a cell culture incubator with 6.5% CO2 and constant humidity for 14 days. Then colonies were counted and identified based on size and morphology using an Olympus IX81 inverted microscope.
Bone marrow preparation from metaphysis and diaphysis for FACS analysis
To compare bone marrow from the epiphysis/metaphysis to the diaphysis, the metaphysis was separated from the diaphysis using scissors at the point where the central sinus branches (see Extended data figure 7). Then each segment of bone was crushed using a mortar and pestle and small bone fragments were suspended in staining medium (Ca2+ and Mg2+-free Hank’s buffered salt solution (HBSS, Gibco) supplemented with 2% heat inactivated bovine serum (Gibco)) and gently triturated until no marrow was visibly attached to the bone. The cell suspension was filtered through a 100μm mesh to obtain a single cell suspension. The cell suspensions were then analyzed to determine cellularity and HSC frequency.
Competitive reconstitution assays in irradiated mice
Adult recipient mice were administered a minimum lethal dose of radiation using an XRAD 320 X-ray irradiator (Precision X-Ray) to deliver two doses of 540 rads at least 3 hours apart. Cells were transplanted by injection into the retro-orbital venous sinus of anesthetized recipient mice. 300,000 recipient whole bone marrow (WBM) cells were transplanted along with the donor cells. In Table 1, HSC frequency was calculated using Extreme Limiting Dilution Analysis37 software (http://bioinf.wehi.edu.au/software/elda/) (2–4 independent experiments per cell population). For secondary transplants, 3 million WBM cells from primary recipient mice were transplanted into irradiated secondary recipient mice. Blood was collected from the tail vein of recipient mice at 4 week intervals after transplantation for at least 16 weeks after transplantation. For analysis of the levels of donor cells in peripheral blood, red blood cells were lysed with ammonium potassium buffer then the remaining cells were stained with antibodies against CD45.1 (A20), CD45.2 (104), CD11b (Mac1, M1-70), Gr-1 (8C5), B220 (6B2), and CD3 (17A2).
Cell cycle analysis
For analysis of DNA content in HSCs and other hematopoietic cells, the cells were isolated by flow cytometry as described above and sorted directly into 70% ethanol then stored at −20°C for at least 24 hours. The cells were washed multiple times with staining medium (see above) then incubated in staining medium containing 50μg/ml propidium iodide (Molecular Probes) for 30 minutes at room temperature and analyzed using a FACSAria or FACSCanto II flow cytometer (BD Biosciences). Data were analyzed using FACSDiva (BD Biosciences) or FlowJo (Tree Star) software. To assess 5-bromo-2′-deoxyuridine (BrdU) incorporation in vivo mice were intraperitoneally injected with a single dose of BrdU (1mg BrdU/10g body mass) then maintained on 0.5mg BrdU/ml drinking water for three days. For analysis of BrdU incorporation into HSCs bone marrow cells were stained with the following antibodies that were selected to survive fixation: anti-CD150-BV421, anti-CD48-AF700, anti-CD2-PE, anti-CD3-PE, anti-CD5-PE, anti-CD8-PE, anti-Ter119-PE, anti-Gr1-PE, anti-Sca1-PerCpCy5.5 and c-kit-APCH7 (BD Biosciences; antibody clones are as described above for HSC isolation and flow cytometry). For isolation of α-catulin-GFP+c-kit+ cells, bone marrow cells were stained with anti-c-kit-APCH7 antibody. After antibody staining, the target cell populations were double sorted to ensure purity, then fixed and stained with an anti-BrdU antibody using the BrdU APC Flow Kit (BD Biosciences) according to the manufacturer’s instructions.
Sorting of α-catulin-GFP+c-kit+ cells to determine cell diameter
Bone marrow cells from a-catulinGFP/+ mice were prepared for flow cytometric analysis as described above. Biotinylated anti-c-kit antibody (2B8 clone, 13-1171-85, eBiosciences) followed by streptavidin-AF647 (S32357, Life Technologies) were used to stain bone marrow cells. α-catulin-GFP+c-kit+ cells were sorted into a drop of staining medium on a slide coated with poly-D-lysine (0.5mg/ml poly-D-lysine in water was used to coat the slides over night at room temperature). Slides were incubated for 45 minutes at 4°C to let the sorted cells attach to the slide surface. Then a 16% PFA stock solution was added gently into the drop of staining medium to achieve a final PFA concentration around 4%. Cells were fixed for 10 minutes at room temperature and washed multiple times with PBS. Then the cells were stained with DAPI (2 μg/ml in PBS), with 0.1% IgePal630 (Sigma) for 30 minutes, followed by multiple washes in PBS. Prolong gold antifade (Life Technologies) was used to mount the cells. An LSM780 confocal microscope (Zeiss) was used to image the cells and Imaris software was used to measure cell diameter.
microCT analysis of bones
Dissected intact femurs from 10–12 week old littermate mice were fixed in 4% PFA overnight at 4°C. Then the bones were washed multiple times with 70% ethanol and stored in 70% ethanol until they were scanned using a Scanco Medical μCT 35 machine at the Texas A&M University Baylor College of Dentistry. The scan was performed with a 3.5 μm voxel size resolution, 55kV, 145μA, and an integration time of 800 ms. Scanco software was used for analysis. A common reference point was determined for all bones scanned based on the growth plate, and trabecular and cortical regions were analyzed for each bone.
PCR genotyping
The following primers were used to genotype a-catulinGFP allele: Cin-G1, 5′-GAAGTAGTGGCACAAGGGTAGGGG-3′; Cin-G2, 5′-GGCCGCGGTACCTGAGAAAC-3′; Cin-G3, 5′-GTTGCCGTCGTCCTTGAAGAAG-3′. Genotyping primers for Cxcl12DsRed mice5 were previously reported.
Immunofluorescence, clearing, microscopy, and analysis
Half bone whole mount tissue preparation for imaging
Freshly dissected tibias from 8–12 week old mice were fixed in cold 4% paraformaldehyde (PFA) in PBS (Affymetrix) for 7–8 hours at 4°C while shaking. The bones were washed with PBS to remove the PFA and cryoprotected in 30% sucrose PBS solution overnight at 4°C while shaking. The bones were embedded in OCT (Fisher) and flash frozen in liquid nitrogen. A Leica cryostat was used to longitudinally bisect the bones. Intact half bone was washed in PBS to remove OCT then processed for staining, clearing and imaging as below.
Bone marrow whole mount plug preparation for imaging
Intact bone marrow plugs from freshly dissected tibias of 8–12 week old mice were extruded from the bone using a PFA filled syringe with a 25G needle and placed directly into 4% PFA solution for 3 hours at room temperature. Fixed plugs were then washed in PBS before being stained, cleared and imaged as below.
Whole mount immunostaining
All staining procedures were performed in Eppendorf tubes on a rotator at room temperature. The staining solution contained 10% DMSO, 0.5% IgePal630 (Sigma), and 5% donkey serum (Jackson Immuno) in PBS. Half bones and plugs were blocked in staining solution containing anti-CD16/32 mouse Fc blocking antibody (BD Biosciences) and 1% BlokhenII (Aves Labs) over night at room temperature. After blocking, half bones were stained for 3 days at room temperature with primary antibodies in staining solution. Then the tissues were washed multiple times in PBS at room temperature for one day and put into staining solution containing secondary antibodies for 3 days followed by a one day wash to remove any unbound secondary antibodies. Antibodies used for whole mount staining included chicken anti-GFP (GFP-1020, Aves Labs), goat anti-c-kit (BAF1356, R&D Systems), rabbit anti-Laminin (ab7463, abcam), rat anti-Ki-67 (SolA15, eBioscience), Alexa Fluor 647-AffiniPure F(ab′)2 Fragment Donkey Anti-Chicken IgY, Alexa Fluor 488-AffiniPure F(ab′)2 Fragment Donkey Anti-Rabbit IgG, AMCA-AffiniPure F(ab′)2 Fragment Donkey Anti-Rabbit Ig, Alexa Fluor 488-AffiniPure F(ab′)2 Fragment Donkey Anti-Rat IgG (all from Jackson ImmunoResearch), and 555 or 488 conjugated donkey anti-goat (A-11055 and A-21432 from Life Technologies). For isotype control staining in Extended data figure 8b, Goat IgG control (BAF108, R&D Systems), Rabbit IgG control (ab27478-100, Abcam), Rat IgG control (012-000-003, Jackson Immuno) and Non-Immune Chicken IgY control (N-1010, Aves Labs) were used along with the secondary antibodies described above. The fixation time of the tissue, using 0.5% IgePal630 and 10% DMSO in the staining solution, and incubation of the tissue for 3 days in both primary and secondary antibodies were critical factors for efficient deep penetration of antibodies throughout the whole mount tissue. For anti-Ki-67 antibody penetration, before the blocking step, treatment of the tissues with 0.05% SDS over-night in PBS was necessary.
Comparison of clearing protocols
Scattering and spherical aberration due to refractive index mismatch limit the maximum depth of penetration of visible light into aqueous tissue to about 100μm38. Optical clearing agents can decrease the amount of scattered light and therefore increases the depth of penetration. Most optical clearing agents work by replacing the low refractive index, aqueous components of the tissue with agents of a higher refractive index to match that of the tissue such as collagen and cell components. Because each tissue has unique properties, such as density of cells and extracellular matrix, the optimum tissue clearing method must be determined empirically. Bone marrow does not have a high lipid content and therefore, unlike brain, is not limited by the opacity of lipids. Therefore clearing methods that remove the lipid with SDS by either electrophoresis39 or passive flow40 were ineffective and had the additional disadvantage of SDS destruction of cell surface epitopes. Bone marrow is very densely packed with cells, which likely explains why optical clearing agents and methods with lower refractive indices such as Sca/eA241, CUBIC42, and Focus Clear39 did not efficiently clear the marrow in our hands. We found Murray’s clear (1:2 Benzyl Alcohol: Benzyl Benzoate or BABB)43 to be the most effective clearing method, but it is only compatible with antibodies conjugated with stable chemical fluorophores, such as the Alexa Fluor dyes. Murray’s clear rapidly quenches fluorescent proteins, so GFP+ cells were identified using an antibody against GFP when performing deep imaging of tissues. For imaging bone marrow cells from Cxcl12dsRed or LepR-Cre; tdTomato mice we used the 3DISCO44 clearing method because THF and DBE preserve endogenous fluorescence better than BABB, although they did not clear the tissue as effectively as Murray’s clear.
Tissue clearing using modified Murray’s clear
All clearing of half bones and bone marrow plugs was performed in Eppendorf tubes on a rotator at room temperature. Immunostained tissues were washed in PBS and dehydrated in either a methanol or ethanol dehydration series then incubated for 3 hours in methanol or overnight in ethanol with several changes of 100% alcohol. The alcohol was then exchanged with BABB. The tissues were incubated in BABB for 3 hours to overnight with several exchanges of fresh BABB. Half bones or bone marrow plugs were mounted in BABB between two cover slips and sealed with silicone (Premium waterproof silicone II clear, General Electric). As previously published26, we found it necessary to clean the BABB of peroxides (which can accumulate as a result of exposure to air and light) by adding 10g of activated aluminum oxide (Sigma) to 40ml of BABB and rotating for at least 1 hour, then centrifuging at 2000xg for 10 minutes to remove the suspended aluminum oxide particles.
Confocal imaging of thick tissue
Three dimensional confocal microscopy of the bone marrow at sub-micron resolution requires specialized equipment. We used both a Zeiss LSM780 and a Leica SP8 resonant scanning confocal. Specifications for the Zeiss LSM780: AxioExaminer upright stand; 405, 488, 561, 594 and 633 nm visible laser lines; internal 32-channel GaAsP detector; Prior OptiScan motorized stage; Coherent Chameleon Vision II pulsed NIR laser for two photon excitation; Zeiss BiG two channel nondescanned detector. Specifications for the Leica: Acousto Optical Beam Splitter, Spectral detection, 8kHz Resonant tandem scanner, HyD hybrid detectors, and 405, 488, 561, 633 nm laser lines. The optimum clearing agent (BABB) for bone marrow has a refractive index of 1.56, similar but not identical to standard immersion oil. Deep imaging also requires a long working distance objective. For the Zeiss LSM780 we found the best available objective was a Zeiss LD LCI Plan-Apo 25x/0.8 multi-immersion objective lens, which has a 570 μm working distance. We used Immersol 518F immersion oil for Zeiss LSM780 imaging. For the Leica SP8, we used an HCX APO L20x/0.95 BABB immersion objective with a 1.95 mm working distance. High resolution imaging of large volumes of thick tissue by acquisition of tiled Z-stacks is very time consuming, thus it was important to optimize the acquisition settings for each microscope to minimize acquisition time while preserving adequate resolution and signal to noise ratio. On the Zeiss LSM780 images were taken at 512X512 pixel resolution with 2 μm Z-steps, pinhole for the internal detector at 47.7 μm. Bone was imaged by second-harmonic generation (SHG) with 850 nm pulsed NIR excitation using the nondescanned detector. On the Leica SP8, images were taken using the resonance scanner using 8X line averaging with the minimum zoom of 1.25X at 812X812 pixel resolution, pinhole at 44.7 μm, and 2μm Z-steps.
Image annotation and analysis
Confocal tiled Z-stack images were rendered in 3 dimensions and analyzed using Bitplane Imaris v7.7.1 software installed on a Dell Precision T7610 64-bit workstation with Dual Intel Xeon Processor E5-2687W v2 (Eight Core HT, 3.4GHz Turbo, 25 MB),128GB RAM, and 16 GB AMD FirePro W9100 graphics card. Individual α-catulin-GFP+c-kit+ HSCs were identified using the Ortho slicer function in Imaris software to visualize digital serial sections of the large 3D image. We identified HSCs as having a round morphology, with GFP throughout the cell, and c-kit expression surrounding the cell surface. These criteria prevented false positive identification of cellular debris or α-catulin-GFP+c-kit− endothelial cells with elongated cell body morphology. HSC coordinates and size were interactively annotated using the Imaris spots function in manual mode. Bone and non-myelinating Schwann cells were segmented based on thresholding of the second harmonic generation (SHG, which detects collagen fibers in bone) or GFAP channels, respectively, using the Imaris surface function. Cortical and trabecular bone were then divided into separate surfaces interactively based on SHG signal and morphology. We used anti-laminin antibodies to immunofluorescently label all of the vasculature within the bone marrow. Arteries, arterioles, and capillaries have continuous basement membranes, which are observable as uniform laminin staining. In contrast, bone marrow sinusoids have a discontinuous fenestrated basement membrane45. Laminin staining of sinusoids clearly demonstrates discontinuous basement membranes, thereby allowing unambiguous identification of sinusoidal vessels in the absence of other markers45. Because we were able to image the entire marrow cavity we were able to trace and digitally label each artery and all of its subsequent branching into smaller arteries and arterioles as they approached the endosteal surface. This is a great advantage of the deep imaging approach that allowed us to unambiguously identify vessels in a way that is not possible in thin sections where the connectivity of vessels cannot be traced.
Near the endosteum, arterioles connect to the smallest diameter vessels of the capillary network that line the endosteum. These capillaries then connect to larger diameter sinusoidal vessels. By carefully following the blood vessel paths in six samples, we determined that in the diaphysis the outer 20% of the marrow by volume contained all of the vessels involved in the transition from arteriole to sinusoid, i.e. the most distal portion of the arterioles, the connecting capillaries, and the initial portion of sinusoids. We identified this region as the transition zone in keeping with published criteria30. Therefore, we used the published morphological characteristics of orientation, location, and basement membrane continuity to subdivide blood vessels within the bone marrow. The Imaris surface function was used to create three distinct digital surfaces corresponding to each type of blood vessel. SHG signal was used to create bone surfaces. Three dimensional distances between HSCs and digital vessel or bone surfaces were calculated using the Imaris Distance Transform Matlab XTension and volumetric decile calculations were performed using a Matlab-based Imaris XTension. The annotated programs, entitled “Visualizing Progressive Zones of Equal Volume in a 3D Tissue (Matlab Extensions for Imaris)” are available for download from the Morrison lab protocols webpage at the CRI website under “More Information” (http://cri.utsw.edu/sean-morrison-laboratory/more-information/).
Random spot generation and insertion
The original 3 dimensional images of the GFP channel in the Imaris format were used to generate random spots for each sample. In a 16 bit Imaris file of the original bone marrow image, 3 dimensional voxels were represented by signal intensity values that ranged between 0 and 65,535. Those signal intensity values were imported into MATLAB using the imreadBF package (http://www.mathworks.com/matlabcentral/fileexchange/32920-imread-for-multiple-life-science-image-file-formats) and the Bio-Formats software (http://www.openmicroscopy.org/site/products/bio-formats). The images were filtered to exclude low-intensity regions that included blood vessel lumens and fat bodies where HSCs were not found and random spots were not generated. The intensity-filtered images, of which the excluded portions were given zero intensity values, were processed with MATLAB’s median filter to remove salt-and-pepper noise. Then the intensity images were converted to binary signals by turning any non-zero intensity value into “one”. Those “one” signals were used to determine the voxel locations that were used to generate random spots. The locations were randomly permuted, and enough random spot coordinates were designated to approximate the random spot distribution (more than 50,000 per bone). The random spot coordinates were transferred to Imaris to generate the random spots, and distances from random spots to cell types or landmarks in the bone marrow were calculated based on the distance transformation files generated using landmark surfaces such as arterioles, sinusoids, transition zone vessels, and bone. We confirmed the randomness of the distribution of the random spots by measuring the frequency of random spots in each percentile of bone marrow volume. Random spots were given a diameter of 6 microns, similar to the observed average HSC diameter.
Statistical methods
To assess whether the distribution of HSCs significantly differed from random spots with respect to particular bone marrow landmarks, we used a normalized 2-sample Kolmogorov–Smirnov test. The 2-sample Kolmogorov–Smirnov test calculates and evaluates the maximum difference between the empirical cumulative distribution functions (ECDFs) of two test groups where each group is a vector of continuous values, which in our case were the distances from HSCs or random spots to particular bone marrow cell types or structures. Since we had multiple biological samples, we normalized them by the following approaches:
HSCs and random spot distances from the same sample were pooled to determine a range of distances, which was then used to generate 100 equal-length bins for each sample so that each bin represented 1% of the distance range for that sample.
For each sample, the number of HSCs or random spots in each bin was determined and normalized to percentages.
The average percentage of HSCs or random spots in each bin was calculated across all samples.
The averaged, binned percentages of HSCs or random spots were used to approximate the probability density functions (PDF), and the ECDFs were calculated based on those approximate PDFs.
MATLAB’s 2-sample Kolmogorov–Smirnov test was used and slightly modified so that it accepted the two normalized ECDFs as inputs. The Kolmogorov–Smirnov p-values were adjusted using the Bonferroni method to account for multiple comparisons.
The data presented in figure panels reflect multiple independent experiments performed on different days using tissues from different mice. Sample sizes were not based on power calculations. No randomization or blinding was performed. Variation is always indicated using standard deviation. For analysis of the statistical significance of differences between two groups we first assessed whether variance in the two groups was similar using an F test (it always was) and then two-tailed Student’s t-tests. Single factor ANOVA and two way ANOVA with multiple comparisons tests were used for comparisons among three groups in Extended data figure 2.
Not all samples were suitable for image analysis and those that did not meet the criteria were not analyzed. Occasionally the antibody staining was not strong enough for us to detect HSCs or other landmarks in the deepest part of the bone marrow or the samples were damaged during processing. In these cases the samples were not analyzed. All mice used in our studies were between 8 and 12 weeks old, including both male and female mice. We did not observe any differences in HSC localization among male and female mice (Extended data figure 9d–k), so the data were combined for purposes of analysis. All conclusions were based on data obtained from at least 3 independent experiments involving samples obtained from different mice and processed on different days.
Code availability
Code was written to separate bone marrow into volumetric deciles and to identify the transition zone in the outer 20% of bone marrow. This code is available on the Morrison lab protocols webpage at the CRI website under “More Information” (http://cri.utsw.edu/sean-morrison-laboratory/more-information/).
Extended Data
Extended data figure 1. Generation of α-catulinGFP mice.
a, The targeting strategy to generate the α-catulinGFP allele is shown. The targeting vector was generated by retrieving a genomic fragment of the α-catulin gene, including exon1, from BAC clone RP24-146F11 by recombineering31. The retrieved genomic region was then modified to replace most of the exon1 coding region and the exon1-intron1 junction with an EGFP-bGH-pA-FRT-neo-FRT cassette in frame with the first ATG of α-catulin. The final targeting vector was then linearized and electroporated into C57BL-derived Bruce4 ES cells. b, New NsiI and SpeI sites introduced with the EGFP-bGH-pA-FRT-neo-FRT cassette were used to screen correctly targeted ES cell clones by Southern blotting for 5′ and 3′ probes. Correctly targeted ES cells were used to generate chimeric mice. Upon confirmation of germ-line transmission by PCR, the α-catulinGFP−neo mice were crossed with Flpe mice32, to remove the neomycin resistance cassette. c, PCR genotyping of α-catulin+ (WT) and α-catulinGFP alleles from α-catulin+/+, α-catulinGFP/+ and α-catulinGFP/GFP mice. d, α-catulin+/+ and α-catulinGFP/GFP mice did not show any difference in size or body mass (n=9 α-catulin+/+ and 8 α-catulinGFP/GFP male mice, n=7 α-catulin+/+ and 7 α-catulinGFP/GFP female mice, all were 8–10 weeks old). e, α-catulinGFP/+ and α-catulinGFP/GFP mice were born at mendelian frequencies, survived into adulthood in normal numbers, and were apparently developmentally normal. The statistics reflect mice genotypes at 8–10 weeks of age. f, Cortical and trabecular femur bone (CB and TB) did not show any statistically significant differences among α-catulin+/+ and α-catulinGFP/GFP mice by microCT (micro Computed Tomography) analysis (6 α-catulinGFP/GFP and 5 α-catulin+/+ controls at 10–12 weeks of age). HA refers to Hydroxyapatite. All data represent mean±s.d. The significance of differences between genotypes was assessed using Student’s t-tests. None were statistical significant.
Extended data figure 2. α-catulinGFP/GFP mice had normal hematopoiesis, normal HSC frequency, and normal HSC function.
a, Hindlimb bone marrow cellularity (n=9 mice for α-catulin+/+,n=4 mice for α-catulinGFP/+ and n=9 mice for α-catulinGFP/GFP genotype) and spleen cellularity (n=6 mice for α-catulin+/+,n=4 mice for α-catulinGFP/+ and n=6 mice for α-catulinGFP/GFP genotype), spleen mass (7 mice for α-catulin+/+,n=4 mice for α-catulinGFP/+ and n=7 mice for α-catulinGFP/GFP genotype). b, White blood cell (WBC), red blood cell (RBC) and platelet (PLT) counts per microliter of peripheral blood from 8–12 week old α-catulin+/+, α-catulinGFP/+, and α-catulinGFP/GFP mice (n=9 mice/genotype). c,d, Frequencies of mature hematopoietic cells and progenitors in the bone marrow of 8–12 week old α-catulin+/+ and α-catulinGFP/GFP mice (Pre-ProB cells were B220+sIgM−CD43+CD24−; ProB cells were B220+sIgM−CD43+CD24+; Pre-B cells were B220+sIgM−CD43−; common lymphoid progenitors (CLPs) were Lin−c-kitlowSca1lowCD127+CD135+; common myeloid progenitors (CMPs) were Lin−c-kit+Sca1−CD34+CD16/32−; granulocyte-macrophage progenitors (GMPs) were Lin−c-kit+Sca1−CD34+CD16/32+; and megakaryocyte-erythroid progenitors (MEPs) were Lin−c-kit+Sca1−CD34−CD16/32− (n=3 mice/genotype). e, Bone marrow CD150+CD48−LSK HSC frequency, bone marrow CD150−CD48−LSK MPP frequency (n=12 mice/genotype in 12 independent experiments), and spleen HSC frequency (n=3 mice/genotype in 3 experiments). f, Percentage of HSCs and whole bone marrow cells that incorporated a 3 day pulse of BrdU in vivo (n=6 α-catulin+/+, 9 α-catulinGFP/+, and 7 α-catulinGFP/GFP 8–12 week old mice in 3 independent experiments). g, Colony formation by HSCs in methylcellulose cultures (GM means granulocyte-macrophage colonies, GEMM means granulocyte-erythroid-macrophage-megakaryocyte colonies, Mk means megakaryocyte colonies; (n=5 mice/genotype in 5 independent experiments). h, Reconstitution of irradiated mice by 300,000 donor bone marrow cells from 8–12 week old α-catulin+/+, α-catulinGFP/+, or α-catulinGFP/GFP mice competed against 300,000 recipient bone marrow cells (n=4 donor mice and 16 recipient mice for α-catulin+/+, n=3 donor mice and 9 recipient mice for α-catulinGFP/+, and n=4 donor mice and 18 recipients for α-catulinGFP/GFP in 3 independent experiments). i, Serial transplantation of 3 million WBM cells from primary recipient mice shown in panel d into irradiated secondary recipient mice (n=4 primary α-catulin+/+ recipients were transplanted into 17 secondary recipients and n=6 primary α-catulinGFP/GFP recipients were transplanted into 20 secondary recipients). All data represent mean±s.d. The statistical significance of differences between genotypes was assessed using Student’s t-tests or ANOVAs. None were significant.
Extended data figure 3. α-catulin-GFP expression among hematopoietic cells is highly restricted to HSCs.
a, The frequency of α-catulin-GFP+ bone marrow cells in negative control α-catulin+/+ (WT) mice and α-catulinGFP/+ mice (n=14 mice per genotype in 11 independent experiments). In all cases in this figure percentages refer to the frequency of each population as a percentage of WBM cells. b, α-catulin-GFP+ckit+ cells from Figure 1b are shown (blue dots) along with all other bone marrow cells in the same sample (red dots). c, CD150+CD48−LSK HSCs express α-catulin-GFP but CD150−CD48−LSK MPPs do not (n=17 mice in 12 independent experiments). A minority of the α-catulin-GFP+ckit+ cells had high forward scatter, lacked reconstituting potential, and were gated out when flow cytometrically isolating HSCs and when identifying HSCs during imaging (see Extended data figure 5 for further explanation). d, Lin−c-kitlowSca1lowCD127+CD135+ common lymphoid progenitors (CLPs), Lin−c-kit+Sca1−CD34+CD16/32− cells common myeloid progenitors (CMPs), Lin−c-kit+Sca1−CD34+CD16/32+ granulocyte-macrophage progenitors (GMPs), and Lin−c-kit+Sca1−CD34−CD16/32− megakaryocyte-erythroid progenitors (MEPs) did not express α-catulin-GFP. α-catulinGFP/+ and control cell populations had similar levels of background GFP signals that accounted for fewer than 1% of the cells in each population (n=9 mice/genotype in 2 independent experiments).
Extended data figure 4. α-catulin-GFP+ckit+ bone marrow cells are highly enriched for HSC activity and are quiescent.
a, Competitive reconstitution assays in which one donor α-catulin-GFP+ckit+GFP+ bone marrow cell was transplanted along with 300,000 recipient bone marrow cells into irradiated recipient mice. Each line represents one of the nine mice (out of 34 transplanted; see Table 1) that were long-term multilineage reconstituted by donor cells. b, Three million WBM cells from primary recipient mice 1–4 from panel a (indicated by an asterisk) were transplanted into secondary recipient mice (7 secondary recipients/primary recipient-1, 4 secondary recipients/primary recipient-2, 3 secondary recipients/primary recipient-3, 3 secondary recipients/primary recipient-4 for a total of 17 secondary recipients). Each line shows the average (±s.d.) levels of donor cell reconstitution in secondary recipient mice from each primary donor. c, DNA content of WBM cells, α-catulin-GFP+ckit+ HSCs, and CD150+CD48−LSK HSCs. While 11.5% of WBM cells had greater than 2N DNA content (in S/G2/M phases of the cell cycle), only around 1% of α-catulin-GFP+ckit+ HSCs or CD150+CD48−LSK HSCs had greater than 2N DNA content. d, BrdU incorporation into WBM cells, c-kit+ cells, α-catulin-GFP− CD150+CD48−LSK cells, α-catulin-GFP+CD150+CD48−LSK HSCs, and α-catulin-GFP+ckit+ HSCs after 3 days of continuous BrdU administration (BrdU treated). Untreated negative control mice are also shown. e, Percentage of BrdU+ cells in each cell population. In each panel, the number of mice used for analysis (without being pooled) is indicated. All data reflect mean±s.d. from 2 to 5 independent experiments. Statistical significance was assessed using Students t-tests (*, P<0.05; **, P<0.01).
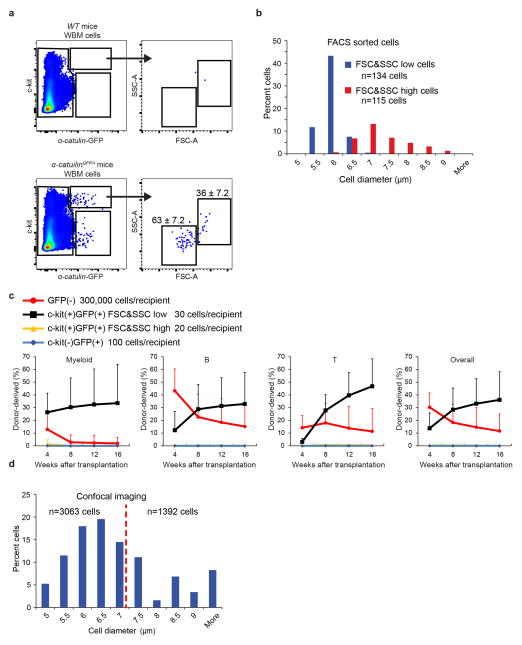
Extended data figure 5. All HSC activity resides among α-catulin-GFP+ckit+ cells with low forward and side scatter.
a, Most α-catulin-GFP+ckit+ cells (63±7.2%) had low forward and side scatter but a distinct minority population (36±7.2%) had higher forward and side scatters that were not typical of HSCs. b, We sorted the low scatter and the high scatter α-catulin-GFP+ckit+ cell populations gated in panel a and measured their diameters (3 independent experiments). c, Competitive reconstitution assays in irradiated mice revealed that all HSC activity resided in the low scatter cell fraction. For each recipient mouse, the indicated donor cells (based on the number of cells from each population contained within 300,000 bone marrow cells) were transplanted into irradiated mice along with 300,000 recipient bone marrow cells (mean±s.d. from 2 independent experiments with 20 total recipient mice in the GFP(−) group, 14 total recipient mice in the c-kit(+)GFP(+) FSC&SSC low group, 11 total recipient mice in the c-kit(+)GFP(+) FSC&SSC high group and 9 total recipient mice in the c-kit(−)GFP(+) group). d, The size distribution of all α-catulin-GFP+ckit+ cells identified by confocal microscopy in bone marrow plugs from the tibia diaphysis (6 bones analyzed in 6 independent experiments). In keeping with the flow cytometry data, the largest 40% of imaged cells were not considered HSCs, excluding all cells with diameter larger than 7 μm.
Extended data figure 6. HSCs are enriched in the central marrow and depleted near the endosteum in the diaphysis.
a,b, The distribution of HSCs from the central marrow to the endosteum can be determined by drawing concentric cylinders that correspond to equal volumetric deciles from the center of the marrow to the endosteum (a) or to equal radial deciles from the center to the endosteum (b). c,d, Each volumetric decile (as in a) contains 10% of the marrow volume (c). However, cylinders based on radial deciles (as in b), contain successively larger volumes of marrow as they approach the endosteum because the circumference of the cylinders becomes larger (d). e,f, The distribution of random spots among volumetric deciles (a) is nearly equal because each cylinder contains an equal marrow volume (e). However, the number of random spots per cylinder based on radial deciles (b) increases from the center to the endosteum as cylinder volume increases (f). g, When we plotted our HSC localization data by volumetric deciles (as in Figure 2a), HSC were enriched toward the central marrow. h, When we plotted our HSC localization data by radial deciles, the number of HSCs per cylinder increased toward the endosteum as cylinder volume increased, similar to random spots.
Extended data figure 7. HSC density is higher in the diaphysis as compared to the metaphysis.
a, Schematic of a femur showing the separation of epiphysis/metaphysis from diaphysis. We divided metaphysis from diaphysis at the point where the central sinus branched (see red line in panels a,f and i). This is also the point at which the density of trabecular bone declines moving into the diaphysis. b, A bisected femur before and after clearing. c, The frequency of CD150+CD48−LSK cells and α-catulin-GFP+c-kit+ cells by flow cytometry in the epiphysis/metaphysis versus diaphysis of femurs (n=9 mice in 2 independent experiments). Note that bone marrow cells were extracted from crushed bones. d, The distance (μm) from α-catulin-GFP+c-kit+ cells to the nearest bone surface in the femur diaphysis based on deep imaging (n=368 cells in 3 bisected femurs). e, The distance (μm) from α-catulin-GFP+c-kit+ cells to the nearest bone surface in the femur diaphysis based on analysis of thin (7 μm) sections (n=45 cells). f, Schematic of a tibia showing the separation of epiphysis/metaphysis from diaphysis (red line). g, The frequency of CD150+CD48−LSK cells and α-catulin-GFP+c-kit+ cells by flow cytometry in the epiphysis/metaphysis versus diaphysis of tibias (n=9 mice in 2 independent experiments). h, The frequency of α-catulin-GFP+c-kit+ cells in the tibia epiphysis/metaphysis versus diaphysis based on deep confocal imaging (n=3 bisected tibias in 3 independent experiments). i, Deep imaging of a bisected tibia showing the separation of metaphysis and diaphysis (red line) where the central sinus branches. Note that these tibias were digitally reconstructed from two different imaging sessions, above and below the diagonal white line. This image shows a 349 μm thick specimen collapsed into 2 dimensions. Note that this causes α-catulin-GFP+ cells and c-kit+ cells to appear much more frequent than they actually were because all of the cells from the thick specimen were collapsed into a single 2 dimensional optical plane for presentation. j, For comparison purposes, a single 2 μm thick optical slice from the tibia in panel i. k, High magnification images of single α-catulin-GFP+c-kit+ cells from the same tibia. Note that α-Catulin-GFP is also expressed by sinusoidal endothelial cells but these cells are easily distinguished from HSCs because the endothelial cells lack c-kit expression and have a very different morphology. Statistical significance was assessed using Students t-tests (*, P<0.05; ** P<0.01; ***, P<0.001).
Extended data figure 8. c-kit and α-Catulin-GFP staining do not reflect autofluorescence or background staining and GFAP+ non-myelinating Schwann cells tend to localize in the center of the marrow.
a, 4-color confocal analysis of a bone marrow plug from a tibia diaphysis stained with primary and secondary antibodies against Ki-67, α-catulin-GFP, c-kit, and laminin. A 2 μm optical section is shown from a thick specimen to illustrate typical staining. b, Negative control in which a bone marrow plug from a tibia diaphysis was stained with isotype control and secondary antibodies then imaged under the same conditions as shown in panel a. c, Ki-67 staining was largely or exclusively nuclear, co-localizing with DAPI. Low (d–g) magnification images of bone marrow plugs from tibia diaphysis stained with antibodies against α-catulin-GFP, c-kit, and GFAP. GFAP+ non-myelinating Schwann cells are associated with nerve fibers that run longitudinally along the central bone marrow, where innervated arterioles are located24. α-catulin-GFP+c-kit+ cells were identified and annotated with blue spheres using the Imaris spot function in panels e and g. Note that the blue spheres are larger than the actual HSCs because at their actual size, HSCs would be extremely difficult to see at this magnification. Since the HSCs are represented as large blue spheres, they appear more dense than they actually are. For clarity, other hematopoietic cells and endothelial cells are not shown in panels e and g. h, A higher magnification image showing two α-catulin-GFP+c-kit+ cells (arrows) and their localization relative to GFAP positive glia (white) and α-catulin-GFP+ endothelial cells (green). The images in panels d–g show a 505 μm thick specimen. This causes α-catulin-GFP+ cells and c-kit+ cells to appear much more frequent than they actually were because all of the cells from the thick specimen were collapsed into a single 2 dimensional optical plane for presentation. Note as well that because these were thick specimens, there were cases in which an α-catulin-GFP+ cell and a c-kit+ cell were present in different optical planes such that they appeared to be a single α-catulin-GFP+c-kit+ cell when collapsed into a single 2 dimensional image. For this reason, α-catulin-GFP+c-kit+ cells cannot be reliably identified in low magnification 2 dimensional projected images. In all cases, cells that we identified as α-catulin-GFP+c-kit+ were manually examined at high magnification in 3 dimensions to confirm double labeling of single cells, as shown in panel h. Note as well that few HSCs were closely associated with nerve fibers in these images when they were examined at high magnification and in three dimensions.
Extended data figure 9. Bone marrow blood vessel types can be distinguished based upon vessel diameter, continuity of basal lamina, morphology, and position, and we could not detect any difference in the distribution of HSCs in the bone marrow of male and female mice.
a,b, Schematic (a) and properties (b) of blood vessels in the bone marrow. Blood enters the marrow through arterioles that branch as they become smaller in diameter and approach the endosteum, where they connect to smaller diameter transition zone capillaries near the bone surface. These transition zone capillaries connect to the large diameter sinusoids that feed blood into the central sinuous through which it leaves the bone marrow in venous circulation. c, Each type of blood vessel was distinguished based on vessel diameter, continuity of basal lamina, morphology, and position then color coded using published criteria17,30,46,47. To create distinct digital surfaces associated with each type of blood vessel we first designated all laminin-stained blood vessels in the outer 20% of the marrow volume (adjacent to the endosteum) as transition zone vessels (blue). Arterioles were identified and manually traced in the remaining 80% of marrow volume based on high intensity laminin staining, continuous basal lamina, and morphology. Remaining blood vessels with low intensity laminin staining, fenestrated basal lamina, large diameter, and sinusoidal morphology were designated sinusoids. The longitudinal images (top) show bone marrow plugs that were 550 μm thick and the cross-sectional images (bottom) were 49 μm thick. d, The distribution of α-catulin-GFP+c-kit+ cells in concentric cylinders corresponding to equal volumetric deciles from central marrow to endosteal marrow (near the bone surface) in bone marrow plugs from the tibia diaphysis of male and female mice. e,f,g, The distance from α-catulin-GFP+c-kit+ cells in male or female mice to the nearest arteriole (e), sinusoid (f), or transition zone vessel (g) in tibia based on deep imaging. h,i,j, The percentage of α-catulin-GFP+c-kit+ cells within 10 μm of arterioles (h), sinusoids (i) and transition zone vessels (j) in the tibias of male versus female mice. k, The percentage of α-catulin-GFP+c-kit+ cells closest to arterioles, sinusoids, or transition zone vessels in the tibias of male versus female mice. These data show mean±s.d. for a total of 1345 α-catulin-GFP+c-kit+ cells from 3 female tibias and 1632 α-catulin-GFP+c-kit+ cells from 3 male tibias. The statistical significance of differences were assessed using Kolmogorov–Smirnov tests in panels d–g and Student’s t tests in panels h–k. None of the differences were statistically significant.
Extended data figure 10. We were not able to detect any expression of NG2-CreER in Scf or Cxcl12 expressing cells and conditional deletion of Scf or Cxcl12 using NG2-CreER did not affect HSC frequency or hematopoiesis.
a, A 20 μm optical section from a 390 μm thick cleared bone marrow plug from the tibia diaphysis of an NG2-CreER; RosatdTomato/+; ScfGFP/+ mouse (image is representative of bones from 4 mice). The image shows rare Tomato+ periartieriolar smooth muscle cells (arrow) as well as glia associated with nerve fibers (arrowhead); however, we were unable to detect Scf expression by any of these cells. b, Representative flow cytometry plots showing the percentage of Scf-GFP+ stromal cells that were positive for Tomato expression (reflecting recombination by NG2-CreER) or LepR antibody staining (mean±SD from 4 mice in 3 independent experiments). Scf-GFP+ stromal cells were uniformly positive for LepR expression but negative for NG2-CreER recombination. c,d,e,f, Conditional deletion of Scf in NG2-CreER; ScfGFP/fl mice had no effect on bone marrow cellularity (c), HSC frequency (d), CMP, GMP, or MEP frequency (e) or bone marrow reconstituting capacity upon transplantation into irradiated mice (f) (n=5 mice/genotype in 5 independent experiments with 4–5 recipient mice/donor in each experiment). g, A 20 μm optical section from the diaphysis of a 130 μm thick cleared half tibia from a NG2-CreER; RosaYFP/+; Cxcl12dsRed/+ mouse. The image shows rare YFP+ periartieriolar smooth muscle cells; however, we were unable to detect Cxcl12 expression by these cells. h, Representative flow cytometry plots showing the percentage of Cxcl12-DsRed+ stromal cells that were positive for YFP expression (reflecting recombination by NG2-CreER) or LepR antibody staining. Cxcl12-DsRed+ stromal cells were uniformly positive for LepR expression but negative for NG2-CreER. i,j,k,l, Conditional deletion of Cxcl12 in NG2-CreER; Cxcl12−/fl mice had no effect on bone marrow cellularity (i), HSC frequency (j), CMP, GMP, or MEP frequency (k) or bone marrow reconstituting capacity upon transplantation into irradiated mice (l) (n=4 mice/genotype in 4 independent experiments with 4–5 recipient mice/donor in each experiment).
Supplementary Material
A segment of tibia was fixed, stained with antibodies against c-kit (red), α-catulin-GFP (white), and laminin (green), then cleared and imaged. Bone was imaged as second harmonic generation (gray). Endothelial cells were α-catulin-GFP+ and HSCs were α-catulin-GFP+c-kit+. To show the spatial relationship between HSCs and bone, blood vessels and other hematopoietic cells were masked, then laminin staining was unmasked to show the relationship between HSCs and blood vessels.
A bone marrow plug from the tibia of a Cxcl12DsRed/+; α-catulinGFP/+ mouse was stained with antibodies against GFP (green) and c-kit (white). Hematopoietic progenitors are c-kit+ (white), HSCs are α-catulin-GFP+c-kit+ (green and white), and Cxcl12high stromal cells are DsRed+ (red). To make it possible to see examples of interactions between HSCs and Cxcl12high stromal cells, all channels 20–30μm beyond the spot of interest were occasionally masked.
A bone marrow plug from the tibia of a α-catulinGFP/+ mouse was stained with antibodies against GFP (green), c-kit (red), and laminin (white). Hematopoietic progenitors are c-kit+ (red), HSCs are α-catulin-GFP+c-kit+ (green and red), and blood vessels are marked by laminin (white). Hematopoietic cells other than HSCs are masked throughout most of the video to make it possible to see HSCs throughout the marrow. Note that HSCs tend to localize in the central marrow around sinusoids that are dimly stained for laminin. The α-catulin-GFP signal from c-kit negative endothelial cells was also masked for clarity.
Acknowledgments
S.J.M. is a Howard Hughes Medical Institute (HHMI) Investigator, the Mary McDermott Cook Chair in Pediatric Genetics, the director of the Hamon Laboratory for Stem Cells and Cancer, and a Cancer Prevention and Research Institute of Texas Scholar. J.G.P is a National Science Foundation Graduate Research Fellow. M.M.M. was supported by a National Research Service Award from NIH. This work was supported by the NIH NHLBI (HL097760) and NIH Shared Instrumentation grant NIH S10RR029731. We thank K. Correll and M. Gross for mouse colony management; N. Loof and the Moody Foundation Flow Cytometry Facility; and Abhijit Bugde of the UT Southwestern Live Cell Imaging Facility; and Ying Liu from the Baylor College of Dentistry microCT facility. We also gratefully acknowledge Bitplane customer support, especially Daniel Miranda and Arvonn Tully, Zeiss customer support, especially Sven Terclavers, and Leica application specialists Larry Smith and Haridas Pudavar.
Footnotes
AUTHOR STATEMENT
M.A., K.K., M.M., J.G.P., and S.J.M. conceived various aspects of the project, designed, and interpreted experiments. M.A. found α-catulin is highly restricted in expression to HSCs, made, and characterized the α-catulinGFP/+ mice. Experiments were performed by M.A., K.K., M.M.M., J.G.P., C.N.I., and H.O. with technical assistance from C.J.. The confocal imaging and three dimensional rendering protocols were developed by M.A., K.K., M.M.M., and K.L.P.. Z.Z. and J.G.P. performed computational image analysis. The manuscript was written by M.A., K.K., M.M.M, J.G.P., Z.Z. and S.J.M..
The authors declare no competing financial interests.
References
- 1.Morrison SJ, Scadden DT. The bone marrow niche for haematopoietic stem cells. Nature. 2014;505:327–334. doi: 10.1038/nature12984. [DOI] [PMC free article] [PubMed] [Google Scholar]
- 2.Kiel MJ, Radice GL, Morrison SJ. Lack of evidence that hematopoietic stem cells depend on N-cadherin-mediated adhesion to osteoblasts for their maintenance. Cell Stem Cell. 2007;1:204–217. doi: 10.1016/j.stem.2007.06.001. [DOI] [PubMed] [Google Scholar]
- 3.Kiel MJ, Yilmaz OH, Iwashita T, Terhorst C, Morrison SJ. SLAM Family Receptors Distinguish Hematopoietic Stem and Progenitor Cells and Reveal Endothelial Niches for Stem Cells. Cell. 2005;121:1109–1121. doi: 10.1016/j.cell.2005.05.026. [DOI] [PubMed] [Google Scholar]
- 4.Celso CL, et al. Live-animal tracking of individual haematopoietic stem/progenitor cells in their niche. Nature. 2009;457:92–96. doi: 10.1038/nature07434. [DOI] [PMC free article] [PubMed] [Google Scholar]
- 5.Ding L, Morrison SJ. Haematopoietic stem cells and early lymphoid progenitors occupy distinct bone marrow niches. Nature. 2013;495:231–235. doi: 10.1038/nature11885. [DOI] [PMC free article] [PubMed] [Google Scholar]
- 6.Ding L, Saunders TL, Enikolopov G, Morrison SJ. Endothelial and perivascular cells maintain haematopoietic stem cells. Nature. 2012;481:457–462. doi: 10.1038/nature10783. [DOI] [PMC free article] [PubMed] [Google Scholar]
- 7.Kobayashi H, et al. Angiocrine factors from Akt-activated endothelial cells balance self-renewal and differentiation of haematopoietic stem cells. Nature Cell Biology. 2010;12:1046–1056. doi: 10.1038/ncb2108. [DOI] [PMC free article] [PubMed] [Google Scholar]
- 8.Greenbaum A, et al. CXCL12 in early mesenchymal progenitors is required for haematopoietic stem-cell maintenance. Nature. 2013;495:227–230. doi: 10.1038/nature11926. [DOI] [PMC free article] [PubMed] [Google Scholar]
- 9.Poulos MG, et al. Endothelial Jagged-1 is necessary for homeostatic and regenerative hematopoiesis. Cell Rep. 2013;4:1022–1034. doi: 10.1016/j.celrep.2013.07.048. [DOI] [PMC free article] [PubMed] [Google Scholar]
- 10.Zhou BO, Yue R, Murphy MM, Peyer JG, Morrison SJ. Leptin-receptor-expressing mesenchymal stromal cells represent the main source of bone formed by adult bone marrow. Cell Stem Cell. 2014;15:154–168. doi: 10.1016/j.stem.2014.06.008. [DOI] [PMC free article] [PubMed] [Google Scholar]
- 11.Oguro H, Ding L, Morrison SJ. SLAM Family Markers Resolve Functionally Distinct Subpopulations of Hematopoietic Stem Cells and Multipotent Progenitors. Cell Stem Cell. 2013;13:102–116. doi: 10.1016/j.stem.2013.05.014. [DOI] [PMC free article] [PubMed] [Google Scholar]
- 12.Sugiyama T, Kohara H, Noda M, Nagasawa T. Maintenance of the hematopoietic stem cell pool by CXCL12-CXCR4 chemokine signaling in bone marrow stromal cell niches. Immunity. 2006;25:977–988. doi: 10.1016/j.immuni.2006.10.016. [DOI] [PubMed] [Google Scholar]
- 13.Omatsu Y, Seike M, Sugiyama T, Kume T, Nagasawa T. Foxc1 is a critical regulator of haematopoietic stem/progenitor cell niche formation. Nature. 2014;508:536–540. doi: 10.1038/nature13071. [DOI] [PubMed] [Google Scholar]
- 14.Mendez-Ferrer S, et al. Mesenchymal and haematopoietic stem cells form a unique bone marrow niche. Nature. 2010;466:829–834. doi: 10.1038/nature09262. [DOI] [PMC free article] [PubMed] [Google Scholar]
- 15.Kunisaki Y, et al. Arteriolar niches maintain haematopoietic stem cell quiescence. Nature. 2013;502:637–643. doi: 10.1038/nature12612. [DOI] [PMC free article] [PubMed] [Google Scholar]
- 16.Morikawa S, et al. Prospective identification, isolation, and systemic transplantation of multipotent mesenchymal stem cells in murine bone marrow. J Exp Med. 2009;206:2483–2496. doi: 10.1084/jem.20091046. [DOI] [PMC free article] [PubMed] [Google Scholar]
- 17.Nombela-Arrieta C, et al. Quantitative imaging of haematopoietic stem and progenitor cell localization and hypoxic status in the bone marrow microenvironment. Nature Cell Biology. 2013;15:533–543. doi: 10.1038/ncb2730. [DOI] [PMC free article] [PubMed] [Google Scholar]
- 18.Sacchetti B, et al. Self-renewing osteoprogenitors in bone marrow sinusoids can organize a hematopoietic microenvironment. Cell. 2007;131:324–336. doi: 10.1016/j.cell.2007.08.025. [DOI] [PubMed] [Google Scholar]
- 19.Zhou BO, Ding L, Morrison SJ. Hematopoietic stem and progenitor cells regulate the regeneration of their niche by secreting Angiopoietin-1. eLife. 2015;4 doi: 10.7554/eLife.05521. [DOI] [PMC free article] [PubMed] [Google Scholar]
- 20.Omatsu Y, et al. The essential functions of adipo-osteogenic progenitors as the hematopoietic stem and progenitor cell niche. Immunity. 2010;33:387–399. doi: 10.1016/j.immuni.2010.08.017. [DOI] [PubMed] [Google Scholar]
- 21.Hooper AT, et al. Engraftment and reconstitution of hematopoiesis is dependent on VEGFR2-mediated regeneration of sinusoidal endothelial cells. Cell Stem Cell. 2009;4:263–274. doi: 10.1016/j.stem.2009.01.006. [DOI] [PMC free article] [PubMed] [Google Scholar]
- 22.Parmar K, Mauch P, Vergilio JA, Sackstein R, Down JD. Distribution of hematopoietic stem cells in the bone marrow according to regional hypoxia. Proceedings of the National Academy of Sciences USA. 2007;104:5431–5436. doi: 10.1073/pnas.0701152104. [DOI] [PMC free article] [PubMed] [Google Scholar]
- 23.Spencer JA, et al. Direct measurement of local oxygen concentration in the bone marrow of live animals. Nature. 2014;508:269–273. doi: 10.1038/nature13034. [DOI] [PMC free article] [PubMed] [Google Scholar]
- 24.Kunisaki Y, et al. Arteriolar niches maintain haematopoietic stem cell quiescence. Nature. 2013;502:637–643. doi: 10.1038/nature12612. [DOI] [PMC free article] [PubMed] [Google Scholar]
- 25.Dodt HU, et al. Ultramicroscopy: three-dimensional visualization of neuronal networks in the whole mouse brain. Nature Methods. 2007;4:331–336. doi: 10.1038/nmeth1036. [DOI] [PubMed] [Google Scholar]
- 26.Becker K, Jahrling N, Saghafi S, Weiler R, Dodt HU. Chemical clearing and dehydration of GFP expressing mouse brains. PLoS One. 2012;7:e33916. doi: 10.1371/journal.pone.0033916. [DOI] [PMC free article] [PubMed] [Google Scholar]
- 27.Yokomizo T, et al. Whole-mount three-dimensional imaging of internally localized immunostained cells within mouse embryos. Nature Protocols. 2012;7:421–431. doi: 10.1038/nprot.2011.441. [DOI] [PMC free article] [PubMed] [Google Scholar]
- 28.Janssens B, Staes K, van Roy F. Human alpha-catulin, a novel alpha-catenin-like molecule with conserved genomic structure, but deviating alternative splicing. Biochimica et Biophysica Acta. 1999;1447:341–347. doi: 10.1016/s0167-4781(99)00170-0. [DOI] [PubMed] [Google Scholar]
- 29.Yamazaki S, et al. Nonmyelinating schwann cells maintain hematopoietic stem cell hibernation in the bone marrow niche. Cell. 2011;147:1146–1158. doi: 10.1016/j.cell.2011.09.053. [DOI] [PubMed] [Google Scholar]
- 30.Li XM, Hu Z, Jorgenson ML, Slayton WB. High levels of acetylated low-density lipoprotein uptake and low tyrosine kinase with immunoglobulin and epidermal growth factor homology domains-2 (Tie2) promoter activity distinguish sinusoids from other vessel types in murine bone marrow. Circulation. 2009;120:1910–1918. doi: 10.1161/CIRCULATIONAHA.109.871574. [DOI] [PMC free article] [PubMed] [Google Scholar]
- 31.Liu P, Jenkins NA, Copeland NG. A highly efficient recombineering-based method for generating conditional knockout mutations. Genome Res. 2003;13:476–484. doi: 10.1101/gr.749203. [DOI] [PMC free article] [PubMed] [Google Scholar]
- 32.Rodriguez CI, et al. High-efficiency deleter mice show that FLPe is an alternative to Cre-loxP. Nature Genetics. 2000;25:139–140. doi: 10.1038/75973. [DOI] [PubMed] [Google Scholar]
- 33.Mignone JL, Kukekov V, Chiang AS, Steindler D, Enikolopov G. Neural stem and progenitor cells in nestin-GFP transgenic mice. Journal of Comparative Neurology. 2004;469:311–324. doi: 10.1002/cne.10964. [DOI] [PubMed] [Google Scholar]
- 34.Madisen L, et al. A robust and high-throughput Cre reporting and characterization system for the whole mouse brain. Nature Neuroscience. 2010;13:133–140. doi: 10.1038/nn.2467. [DOI] [PMC free article] [PubMed] [Google Scholar]
- 35.Srinivas S, et al. Cre reporter strains produced by targeted insertion of EYFP and ECFP into the ROSA26 locus. BMC Dev Biol. 2001;1:4. doi: 10.1186/1471-213X-1-4. [DOI] [PMC free article] [PubMed] [Google Scholar]
- 36.Zhu X, et al. Age-dependent fate and lineage restriction of single NG2 cells. Development. 2011;138:745–753. doi: 10.1242/dev.047951. [DOI] [PMC free article] [PubMed] [Google Scholar]
- 37.Hu Y, Smyth GK. ELDA: extreme limiting dilution analysis for comparing depleted and enriched populations in stem cell and other assays. Journal of Immunological Methods. 2009;347:70–78. doi: 10.1016/j.jim.2009.06.008. [DOI] [PubMed] [Google Scholar]
- 38.Zhu D, Larin KV, Luo Q, Tuchin VV. Recent progress in tissue optical clearing. Laser Photon Rev. 2013;7:732–757. doi: 10.1002/lpor.201200056. [DOI] [PMC free article] [PubMed] [Google Scholar]
- 39.Chung K, et al. Structural and molecular interrogation of intact biological systems. Nature. 2013;497:332–337. doi: 10.1038/nature12107. [DOI] [PMC free article] [PubMed] [Google Scholar]
- 40.Yang B, et al. Single-cell phenotyping within transparent intact tissue through whole-body clearing. Cell. 2014;158:945–958. doi: 10.1016/j.cell.2014.07.017. [DOI] [PMC free article] [PubMed] [Google Scholar]
- 41.Hama H, et al. Scale: a chemical approach for fluorescence imaging and reconstruction of transparent mouse brain. Nature Neuroscience. 2011;14:1481–1488. doi: 10.1038/nn.2928. [DOI] [PubMed] [Google Scholar]
- 42.Susaki EA, et al. Whole-brain imaging with single-cell resolution using chemical cocktails and computational analysis. Cell. 2014;157:726–739. doi: 10.1016/j.cell.2014.03.042. [DOI] [PubMed] [Google Scholar]
- 43.Becker K, Jahrling N, Saghafi S, Dodt HU. Immunostaining, dehydration, and clearing of mouse embryos for ultramicroscopy. Cold Spring Harb Protoc. 2013;2013:743–744. doi: 10.1101/pdb.prot076521. [DOI] [PubMed] [Google Scholar]
- 44.Erturk A, et al. Three-dimensional imaging of solvent-cleared organs using 3DISCO. Nature Protocols. 2012;7:1983–1995. doi: 10.1038/nprot.2012.119. [DOI] [PubMed] [Google Scholar]
- 45.Inoue S, Osmond DG. Basement membrane of mouse bone marrow sinusoids shows distinctive structure and proteoglycan composition: a high resolution ultrastructural study. Anatomical Record. 2001;264:294–304. doi: 10.1002/ar.1166. [DOI] [PubMed] [Google Scholar]
- 46.Draenert K, Draenert Y. The vascular system of bone marrow. Scanning Electron Microscopy. 1980:113–122. [PubMed] [Google Scholar]
- 47.Kopp HG, Hooper AT, Avecilla ST, Rafii S. Functional heterogeneity of the bone marrow vascular niche. Annals of the New York Academy of Sciences. 2009;1176:47–54. doi: 10.1111/j.1749-6632.2009.04964.x. [DOI] [PMC free article] [PubMed] [Google Scholar]
Associated Data
This section collects any data citations, data availability statements, or supplementary materials included in this article.
Supplementary Materials
A segment of tibia was fixed, stained with antibodies against c-kit (red), α-catulin-GFP (white), and laminin (green), then cleared and imaged. Bone was imaged as second harmonic generation (gray). Endothelial cells were α-catulin-GFP+ and HSCs were α-catulin-GFP+c-kit+. To show the spatial relationship between HSCs and bone, blood vessels and other hematopoietic cells were masked, then laminin staining was unmasked to show the relationship between HSCs and blood vessels.
A bone marrow plug from the tibia of a Cxcl12DsRed/+; α-catulinGFP/+ mouse was stained with antibodies against GFP (green) and c-kit (white). Hematopoietic progenitors are c-kit+ (white), HSCs are α-catulin-GFP+c-kit+ (green and white), and Cxcl12high stromal cells are DsRed+ (red). To make it possible to see examples of interactions between HSCs and Cxcl12high stromal cells, all channels 20–30μm beyond the spot of interest were occasionally masked.
A bone marrow plug from the tibia of a α-catulinGFP/+ mouse was stained with antibodies against GFP (green), c-kit (red), and laminin (white). Hematopoietic progenitors are c-kit+ (red), HSCs are α-catulin-GFP+c-kit+ (green and red), and blood vessels are marked by laminin (white). Hematopoietic cells other than HSCs are masked throughout most of the video to make it possible to see HSCs throughout the marrow. Note that HSCs tend to localize in the central marrow around sinusoids that are dimly stained for laminin. The α-catulin-GFP signal from c-kit negative endothelial cells was also masked for clarity.


