

Summary
Malaria in malaria‐naïve adults is associated with an inflammatory response characterized by expression of specific activation markers on innate immune cells. Here, we investigate activation and adhesion marker expression, and cytokine production in monocytes from children presenting with cerebral malaria (CM, n = 36), severe malarial anaemia (SMA, n = 42) or uncomplicated malaria (UM, n = 66), and healthy aparasitemic children (n = 52) in Blantyre, Malawi. In all malaria groups, but particularly in the two severe malaria groups, monocyte expression of CD11b, CD11c, CD18, HLA‐DR and CD86, and percentages of TNF‐α‐ and IL‐6‐producing monocytes were lower than in healthy controls, while expression of CD11a, TLR2 and TLR4 was lower in children with severe malaria compared with controls. These levels mostly normalized during convalescence, but percentages of cytokine‐producing monocytes remained suppressed in children with SMA. In all malaria groups, especially the SMA group, a greater proportion of monocytes were loaded with haemozoin than among controls. In a P. falciparum hyperendemic area, monocytes in children with acute symptomatic malaria have reduced expression of adhesion molecules and activation markers and reduced inflammatory cytokine production. This immune suppression could be due to accumulation of haemozoin and/or previous exposure to P. falciparum.
Keywords: integrins, monocytes, toll‐like receptors and cytokines
Introduction
The acquisition of protective immunity against malaria requires repeated infections over a number of years 1. Particularly, during the early stages of a malaria infection, innate immunity, involving monocytes and other immune cells, plays a crucial role in controlling parasite growth rate 2. Monocytes are precursors of macrophages and dendritic cells. Their main functions are phagocytosis, antigen presentation and cytokine production 3. Pro‐inflammatory cytokines, such as TNF‐α and IL‐6 which are produced by monocytes among other cells, are elevated in severe malaria and appear to be important for controlling infection 4. However, their excessive production has been linked to immunopathogenesis in malaria 5, 6.
Also implicated in immunity and pathogenesis of malaria are the adhesion molecules which are particularly important in the sequestration of parasitized red blood cells to vascular endothelium 7. During inflammation, upregulation of adhesion molecule expression serves to enhance cell‐to‐cell interactions and transmission of signals that direct effector functions. The major adhesion molecule families involved in leucocyte trafficking, activation and differentiation are the integrins, selectins (L‐selectin, E‐selectin, and P‐selectin) and immunoglobulin super‐family members 8.
The integrins are a large family of αβ‐heterodimers. Integrins incorporating β2 (CD18) are restricted to leucocytes and all are expressed on monocytes. CD11a, b and c all combine with CD18 to form different integrins. They bind a variety of ligands including ICAM‐1 and ICAM‐2 which are expressed by endothelial cells. Endothelial ICAM‐1 is a key factor in cytoadherence of malaria‐parasitized red blood cells 9.
HLA‐DR and CD86 are expressed on monocytes and serve as activation markers. While HLA‐DR is critical for cognate interactions associated with peptide presentation to αβ‐CD4+ T cells, CD86 is key for accessory signalling 10. Monocytes also express Toll‐like receptors (TLRs) which are pattern‐recognition receptors (PRRs) that recognize pathogen‐associated molecular patterns (PAMPs) including microbial pathogens, virulence factors and intracellular protozoan parasites 11. TLRs are involved in the initial activation of the innate immune system 12 and are capable of recognizing a wide range of microbial components including bacterial lipopolysaccharides (LPS), lipopeptides, and glycolipids, unmethylated bacterial DNA and viral nucleic acids 11.
P. falciparum‐derived glycosylphosphatidylinositol (GPI) is known to induce potent TNF‐α responses in macrophages 13. Recognition of these membrane components from P. falciparum is mediated by TLR‐2, and to a lesser extent, TLR‐4 14 and microparticles produced by infected red blood cells are also known to induce immune responses through the recognition of TLR‐4 15. TLR‐9, expressed particularly in either dendritic cells or B cells, but also at low levels on monocytes, T cells and NK cells 16, recognizes P. falciparum haemozoin 17, with DNA bound to proteins or nucleosomes being the true parasite ligand for TLR‐9 16, 18, 19, 20. TLR and other immune signalling pathways may be subject to downregulation following stimulation. Before the discovery of TLRs, it was known that stimulation with endotoxin (lipopolysaccharide, LPS), now known to be the major ligand of TLR‐4, induces tolerance to restimulation, both in vitro and in vivo 21.
During the intraerythrocytic life cycle of P. falciparum, haemoglobin is degraded but the parasite is unable to catabolize haem, which aggregates forming an insoluble polymer called malarial pigment or haemozoin 22. Neutrophils, monocytes and resident macrophages ingest haemozoin and haemozoin‐containing parasitized erythrocytes. Phagocytosis of haemozoin by monocytes has been shown to have both stimulatory effects, including induction of pro‐inflammatory cytokines 23, and inhibitory effects, including reduced phagocytosis and oxidative burst 24, and reduced expression of CD11c 25.
We conducted this study to explore expression of CD11a, CD11b, CD11c, CD18, HLA‐DR, CD86, TLR‐2 and TLR‐4 and production of TNF‐α and IL‐6 by monocytes in Malawian children presenting with different clinical forms of malaria.
Materials and Methods
Study population
For the first study, participants were children admitted with malaria to Queen Elizabeth Central Hospital (QECH), and medically well children attending surgical outpatient clinics at QECH and Beit Cure International Hospital, both in Blantyre. Demographic and clinical features of the participants have been reported before 26. In brief, children were enrolled during the rainy season (November 2005 to April 2006) after obtaining informed consent from the parent or guardian. Each child was examined by a research nurse and/or clinical officer, baseline demographic data were recorded, and a peripheral blood sample was collected.
The children were assessed for level of consciousness using the Blantyre Coma Score (BCS) on admission and during intensive clinical care. Over forty children were prospectively enrolled into each of the four clinical groups defined by diagnoses of CM, SMA, UM or healthy controls (Table S1). Malaria was defined as a clinical syndrome without an apparent alternative cause, in the presence of P. falciparum asexual parasites on blood film microscopy.
Children presenting with CM had a BCS of 2/5 or less at admission and 4 h later, while children in all other groups had a score of 5/5 at both times. Those presenting with SMA had a blood haemoglobin concentration of 5 g/dL or less, and all other children had a haemoglobin concentration above this level. Children who tested positive for HIV infection were excluded from the study and were referred to the antiretroviral therapy clinic.
Expression of surface markers on peripheral blood monocytes and proportion of haemozoin‐loaded monocytes were investigated. Following exclusions, 113 children with malaria (54 with UM, 30 with SMA, 29 with CM) and 42 healthy controls were recruited. Of the children with malaria, 73 (34 UM, 21 SMA and 18 CM) were successfully followed up a month after treatment.
For the second study, a further set of 41 children were recruited from November 2006 to February 2007 from the same health centres as the first set (Table S2) and using the same criteria: 12 with UM, 12 with SMA, 7 with CM and 10 healthy controls. Percentages of TNF‐α‐ and IL‐6‐producing monocytes were determined. Fourteen of thirty‐one (45%) children with malaria (6 UM, 4 SMA and 4 CM) were aparasitaemic when followed up a month after treatment. Convalescence data were only collected from well and aparasitaemic children.
Ethics review and approval
Ethical approval for the study was obtained from College of Medicine Research and Ethics Committee (COMREC) and Ethics Committee of the Liverpool School of Tropical Medicine, UK. Written informed consent was obtained from the parent or guardian of every child before the child was recruited into the study. A 5‐mL venous blood sample was taken at the time of recruitment and in convalescence. Blood was collected in EDTA anticoagulant for immunophenotyping and heparin for cytokine production.
HIV, malaria parasite and haemozoin tests
HIV testing was performed using two rapid tests; Determine HIV1/HIV2 (Abbott Laboratories, Japan) and Unigold (Trinity Biotech, Dublin), according to the manufacturers’ instructions. Malaria parasitaemia was determined by thick and thin blood films. Reading of the slides for malaria parasites and for haemozoin (performed for the first group only) was according to standard procedures 27.
Immunophenotyping
For each sample, 25 μL of EDTA blood was mixed with 1 μL of three directly conjugated antibodies: a FITC‐conjugated antibody (anti‐CD11a, anti‐CD18, anti‐HLA‐DR, anti‐CD86), a PE‐conjugated antibody (anti‐CD11b, anti‐CD11c, anti‐TLR‐2, anti‐TLR‐4) and anti‐CD14‐APC. Samples were incubated for 15 min in the dark at room temperature. About 500 μL of 1× FACS lysing solution (Becton Dickinson, Franklin Lakes, NJ, USA) was added to each tube and incubated in the dark for 10 min at room temperature. Cells were washed twice with 2 mL of PBS and fixed with 100 μL PBS/1% formaldehyde. Data were acquired on a BD FACSCalibur flow cytometer and analysed using cellquest pro software (San Jose, CA, USA) as shown in Figure 4.
Figure 4.
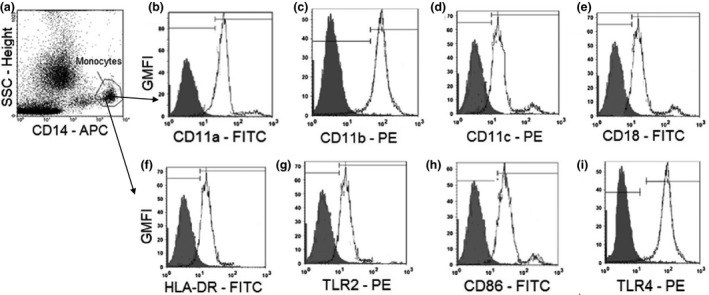
Gating strategy for determining the monocyte population in the side‐scatter/CD14 plot (a), the geometric mean fluorescent intensity (GMFI) values for monocyte surface markers CD11a (b), CD11b (c), CD11c (d), CD18 (e), activation marker HLR‐DR (f), Toll‐like receptor 2 (g), activation marker CD86 (h) and TLR‐4 (i) expressed on monocytes. The grey histograms represent the GMFI of the isotype controls, and the white histogram represents the GMFI of the different surface and activation markers.
Detection of TNF‐α‐ and IL‐6‐producing monocytes by flow cytometry
An aliquot of 1 mL of heparin blood was mixed with 10 μL of 100 μg/mL LPS and 10 μL of 1 μg/mL Brefeldin A (BFA). The mixture was vortexed and incubated at 37°C, 5% CO2 for 4 h in loose‐capped tubes. A negative control, containing 1 mL of blood from the same patient but without any LPS added, was also vortexed and incubated under the same condition. An aliquot of 50 μL of stimulated and unstimulated blood was labelled with 2 μL of anti‐CD14‐APC and incubated in the dark at room temperature for 15 min. 2 mL of 1× FACS lysis solution was added to each tube, vortexed and incubated in the dark for 10 min. Tubes were centrifuged at 1600 rpm and 4°C for 5 min, the supernatant aspirated and 500 μL of 1× FACS Perm (Becton Dickinson) added to each tube which was then incubated in the dark for 10 min. Cells were then washed with 2 mL of PBS/0·5% bovine serum albumin (BSA). Four microlitres of PE‐conjugated anti‐TNF‐α or anti‐IL‐6 was added to each tube. Each tube was vortexed and incubated for 30 min in the dark at room temperature, washed with 2 mL of PBS/0·5% BSA and the cells fixed with 200 μL PBS/1% formaldehyde. Data were acquired and analysed on a FACSCalibur instrument within an hour. We monitored the calibration of our flow cytometer a minimum of once per week using calibrite beads and fascomp software (both Becton Dickinson).
Data were analysed using cell quest software (Becton Dickinson). The gating procedure was conducted as shown in Fig. 1. Samples were gated on monocytes by side scattered light and CD14 expression. Results were expressed as the percentage of cytokine‐producing cells in the CD14+ cell population. The following formula was used for calculating the percentage of cytokine‐producing monocytes:
Figure 1.
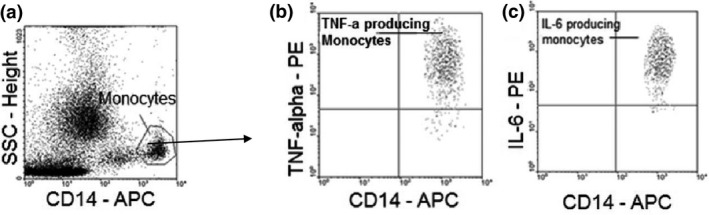
Gating strategy for determining the monocyte population in the side‐scatter/CD14 plot (a) the proportion of TNF‐alpha‐producing (b) and IL‐6‐producing (c) monocytes.
(S = stimulated and U = unstimulated cell cultures).
Data analysis
Statistical tests were performed using graphpad prism version 6.01 for Windows (GraphPad Software, San Diego California USA). A P value of <0·05 was considered statistically significant at 95% level of confidence. The Kruskal–Wallis test was used to compare the geometric mean fluorescent intensity (GMFI) values for the markers CD11a, CD11b, CD11c, CD18, TLR‐2, TLR‐4, HLA‐DR and CD86 on monocytes, the percentage of TNF‐α‐ and IL‐6‐producing monocytes and the percentage of haemozoin‐loaded monocytes in different clinical groups. Wilcoxon‐matched pairs test was used to determine the statistical significance of the differences in GMFI values or percentage of cytokine‐producing monocytes observed during acute infection and in convalescence for each clinical type of malaria.
Results
Clinical malaria is characterized by low expression of integrins on monocytes
During acute malaria, the mean expression levels of integrins CD11a, CD11b, CD11c and CD18 were significantly lower than in controls for each clinical form of malaria, with the exception of CD11a in UM (Fig. 2a–d). Integrin expression levels significantly recovered in convalescence, except for CD11b expression, which only increased in children with SMA, and CD11c, which decreased in convalescence among children with UM (Fig. 2a–d).
Figure 2.
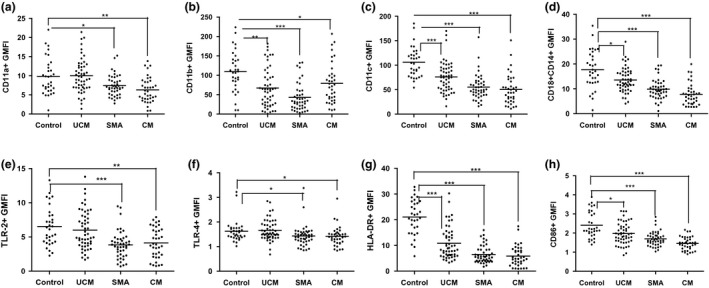
(a to h): Medians (10th and 90th percentiles) of geometric mean florescence intensity (GMFI) of CD11a (a), CD11b (b), CD11c (c), CD18 (d), TLR‐2 (e), TLR‐4 (f), HLA‐DR (g) and CD86 (h) expressions on monocytes from children presenting with UCM, SMA and CM, compared to monocytes from healthy aparasitaemic children. ***P < 0·0001, **P < 0·001, *P < 0·05.
Clinical malaria is characterized by low expression of TLRs, HLA‐DR and CD86 on monocytes
Mean expression of TLR‐2 and TLR‐4 was significantly lower in children with acute CM and SMA compared with healthy controls (Fig. 2e,f), while HLA‐DR and CD86 expression was significantly lower in all three malaria groups (Fig. 2g,h). In convalescence, the expression of TLR‐2 and TLR‐4 was lower in all three clinical forms of malaria compared to levels observed in acute disease, but this difference was only significant in the UM group. In contrast, expression of CD86 increased significantly in convalescence in all malaria groups and the expression was similar to those observed in healthy controls (Fig. 3h). Although the expression of HLA‐DR in convalescence of all three clinical malaria types was significantly higher than that observed in acute disease, the convalescence expression levels were still lower, though not significantly, than those observed in healthy controls (Fig. 3g).
Figure 3.
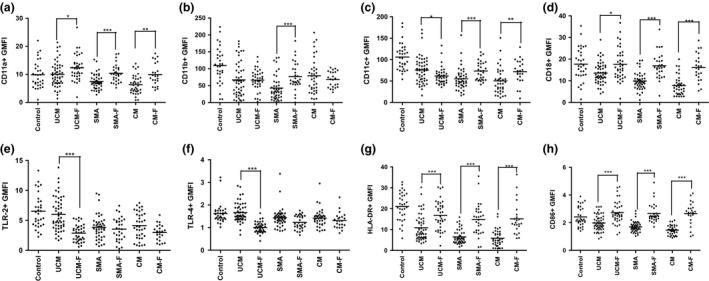
(a to h): Medians (10th and 90th percentiles) of geometric mean florescence intensity (GMFI) of CD11a (a), CD11b (b), CD11c (c), CD18 (d), TLR‐2 (e), TLR‐4 (f), HLA‐DR (g) and CD86 (h) expression on monocytes in children acute malaria (UCM, SMA and CM) and at follow‐up during convalescence (UCM‐F, SMA‐F and CM‐F), compared with monocytes from healthy aparasitaemic children. ***P < 0·0001, **P < 0·001, *P < 0·05.
Acute malaria is characterized by a low proportion of TNF‐α‐ and IL‐6‐producing monocytes
During acute malaria, percentages of TNF‐α‐ and IL‐6‐producing monocytes in all clinical groups were significantly lower than in controls (Fig. 5a,b), with children with CM having the lowest percentage. In convalescence, there was a marked recovery of TNF‐α‐ and IL‐6‐producing monocytes in children with CM, but for those with SMA, the percentage remained low.
Figure 5.
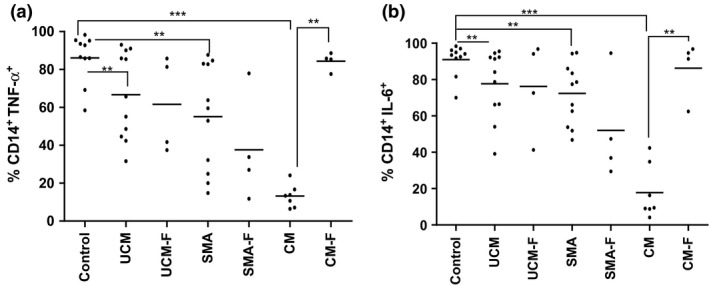
(a to b): Medians (10th and 90th percentiles) of percentage of TNF‐α‐ (a) and IL‐6‐producing monocytes (b) in children presenting with acute disease (UCM, SMA and CM) and at follow‐up during convalescence (UCM‐F, SMA‐F and CM‐F), compared with monocytes from healthy aparasitaemic children. ***<0·0001, **P < 0·001, *P < 0·05.
High percentages of monocytes are loaded with haemozoin in SMA compared with other forms of malaria
In all forms of malaria, haemozoin was visible in a proportion of circulating monocytes by light microscopy (Table S1). Children with SMA had a higher median percentage of haemozoin‐loaded monocytes (17·5%) compared with those with CM (10·0%; P = 0·03) and UM (4·0%; P < 0·01).
Discussion
We analysed the expression of different activation and adhesion markers and percentages of cytokine‐producing monocytes in Malawian children presenting with different clinical forms of P. falciparum malaria. Expression of most integrins and adhesion markers was reduced significantly during acute malaria especially in children presenting with acute SMA and CM who had the highest proportion of haemozoin‐loaded monocytes, when compared with controls or convalescent levels. Proportions of cytokine‐producing monocytes were also reduced in acute infection of all clinical types of malaria, with the lowest percentages observed for children with CM. Most results normalized in convalescence with the notable exception of pro‐inflammatory cytokine‐producing cells in SMA, and TLR‐2 and TLR‐4 expression during convalescence from all forms of malaria. In all patient groups, a higher proportion of monocytes were loaded with haemozoin than in controls.
Clinical malaria has been characterized by the presence of highly activated circulating T‐cell subsets in a number of studies 5, 28, 29, 30, 31, and we have previously reported the same finding among children in the present study 26. This is consistent with the concept that stimulation of immune effector cells by products from malaria infection results in the release of pro‐inflammatory cytokines responsible for clearing parasites from the circulation 5, 30. Our finding of low expression of integrins, TLRs and activation markers HLA‐DR and CD86, on monocytes during acute malaria, is indicative of a contrasting immunosuppressive effect. However, unlike in the case of TLRs, in which the expression is even lower in convalescence, the expression of the activation markers HLA‐DR and CD86 is higher in convalescence compared to the expression in acute disease, suggesting that the activation markers recover faster from immunosuppressive effect that the integrins.
Ingestion of haemozoin could well be the underlying reason for our observations in monocytes. As mentioned, haemozoin is a product of malaria infection that accumulates in phagocytic cells, including monocytes, and has been implicated in both stimulatory and inhibitory immunological effects 23. These differential effects are likely to be dependent on the time course of exposure to haemozoin and could vary depending on prior malaria exposure and in vitro compared with in vivo exposure.
Expression of MHC class II (HLA‐DP, HLA‐DQ and HLA‐DR) and CD11c, but not CD11b, has been shown to decrease in monocytes in vitro 48 h following phagocytosis of haemozoin 25. In contrast, in another study with a 2 h time course, in vitro exposure of leucocytes to isolated malaria pigment from ruptured schizonts resulted in upregulation of CD11b/CD18 on monocytes. The earliest response detected 10 min after exposure to malaria pigment, with a plateau reached at 60 min, followed by a decline at 90 min 32. Both studies were conducted on blood collected from naïve nonexposed adults.
The global low expression of all surface markers examined in the present study, including CD11a, CD11b, CD11c and CD18, could be due to the much longer time course involved. Using samples from children with clinical malaria, monocytes are exposed to malaria‐parasitized red cells and haemozoin for several days prior to the development of clinical symptoms and presentation at hospital. In addition, prior exposure to P. falciparum could prime the immunosuppressive effects observed. In contrast, expression of CD11a/CD18 on lymphocytes has been shown to increase in Sudanese children with uncomplicated malaria 33. This could be because, unlike monocytes, lymphocytes do not accumulate haemozoin.
The marked depression of TLR‐2 compared with TLR‐4 expression in acute severe malaria (CM and SMA) could be the result of downregulation of TLR‐2 secondary to binding by P. falciparum GPI 14, 34. Low expression of TLR‐2, TLR‐4 and CD86 in acute SMA and CM is consistent with the results of a study 35 assessing the effect of P. falciparum macrophage migration inhibitory factor (PfMIF) on monocyte function. This indicates another possible mechanism of monocyte immune suppression to account for our findings. PfMIF is released during malaria and appears to modulate monocyte function, suppressing signalling through TLRs.
In contrast with our findings, Thai adults with severe and mild malaria had raised monocyte TLR‐2 expression, compared with controls, but there was no significant difference in TLR‐4 expression 36. In another study, expression of TLR‐2 or TLR‐4 on monocytes from malaria‐naïve volunteers did not change significantly following 24 h of in vitro stimulation with P. falciparum lysate 37. In a recent study of P. falciparum malaria infection in malaria‐naïve volunteers, monocyte HLA‐DR and CD86 expressions were increased at the time when parasitaemia was detected on thick blood film, prior to drug treatment 38.
All three studies involved clinical material from adults who were naïve to malaria, in contrast to our study among African children with malaria in a P. falciparum hyperendemic area. Repeated prior exposure to P. falciparum in our age group and setting may account for these reported differences in TLR expression. Immune signalling pathways, including those involving TLRs, are subject to modulation by various mechanisms, most commonly downregulation following stimulation. Stimulation with lipopolysaccharide, the main TLR‐4 ligand, induces tolerance to restimulation 39. Thus, the observation that the expression of both TLR‐2 and TLR‐4 in convalescence of all malaria types was even lower than that observed in acute infection could be a result of such tolerance which could take longer than 30 days to dissipate.
The low frequencies of TNF‐α‐ and IL‐6‐producing monocytes in children with malaria in our study contrast with the presence of activated lymphocyte subsets in malaria with high expression of CD69 26, 28. It is likely that these monocytes were already anergic and refractory to further stimuli when stimulated in vitro. Ingestion of haemozoin by monocytes over several days may well have contributed to this refractory state. This is in contrast to enhanced TNF‐α production by monocytes following 1–2 h in vitro stimulation with haemozoin 39.
Notably, the fraction of TNF‐α‐ and IL‐6‐producing monocytes in CM was lower than in SMA. One month into convalescence, the percentages in CM children had recovered and were the same as present in controls. In contrast, these percentages were still low in convalescent children with SMA. This sustained suppression of inflammatory cytokine production among children with SMA may contribute to the increased susceptibility of such children to bacteraemia with nontyphoidal strains of Salmonella 40. Inflammatory Th1 cytokines, including TNF‐α, are important for protection against nontyphoidal Salmonella 41, 42. While the clinical association between invasive nontyphoidal Salmonella disease and malaria has been known for a long time 43, this association is most evident in SMA compared with other forms of malaria 44.
Our findings support the concept of immune suppression of monocyte function among African children with malaria, and this may be secondary to phagocytosis of haemozoin. The findings also indicate that monocyte characteristics following exposure to malaria differ depending on the population studied, transmission intensity, prior exposure to P. falciparum, patient age and clinical form of malaria. Factors that affect monocyte haemozoin content and length of exposure to haemozoin may account for these differences.
Author contributions
CAM, WLM, MTD and MEM conceived the study. WLM, CAM, CLM and ENG performed the investigations. WLM, CAM analysed the data. WLM, MEM and CAM wrote the report. CAM oversaw the research. All authors reviewed the report.
Funding
This work was supported by a PhD studentship from the Gates Malaria Partnership (to WLM) which received support from the Bill and Melinda Gates Foundation, a Wellcome Trust Research Fellowship [grant number 067902/Z/02/Z to C.A.M.], a Wellcome Trust Programme Grant [grant number 074124/Z/04/Z to M.E.M.] and a Clinical Research Fellowship from GlaxoSmithKline to C.A.M.
Supporting information
Table S1. Medians (range) of demographic, clinical and haematological values of participants in first study to characterise expression of monocytes surface markers in different clinical presentations of malaria and in healthy controls.
Table S2. Medians (range) of demographic, clinical and haematological values of participants in second to determine the proportion of cytokine‐producing monocytes in different clinical presentations of malaria and in healthy controls.
Acknowledgement
We thank the parents, guardians and children who participated in this study, and the staff at Queen Elizabeth Central Hospital and Beit Cure International Hospital for their assistance. Specifically, we would like to thank Grace Mwimaniwa, Meraby Mfunsani and Paul Pensulo for collecting blood samples from the participants, and Steve Graham, Elizabeth Molyneux and Terrie Taylor for clinical assistance in the recruitment of the study participants.
Disclosures: C.A.M. is the recipient of a Clinical Research Fellowship from GlaxoSmithKline.
References
- 1. Langhorne J, Ndungu FM, Sponaas AM & Marsh K. Immunity to malaria: more questions than answers. Nat Immunol 2008; 9: 725–732. [DOI] [PubMed] [Google Scholar]
- 2. Smith TG, Ayi K, Serghides L, McAllister CD & Kain KC. Innate immunity to malaria caused by Plasmodium falciparum. Clin Invest Med 2002; 25: 262–272. [PubMed] [Google Scholar]
- 3. Yang J, Zhang L, Yu C, Yang XF & Wang H. Monocyte and macrophage differentiation: circulation inflammatory monocyte as biomarker for inflammatory diseases. Biomark Res 2014; 2: 1–9. [DOI] [PMC free article] [PubMed] [Google Scholar]
- 4. Lyke KE, Burges R, Cissoko Y et al Serum levels of the proinflammatory cytokines interleukin‐1 beta (IL‐1beta), IL‐6, IL‐8, IL‐10, tumor necrosis factor alpha, and IL‐12(p70) in Malian children with severe Plasmodium falciparum malaria and matched uncomplicated malaria or healthy controls. Infect Immun 2004; 72: 5630–5637. [DOI] [PMC free article] [PubMed] [Google Scholar]
- 5. Riley EM. Is T‐cell priming required for initiation of pathology in malaria infections? Immunol Today 1999; 20: 228–233. [DOI] [PubMed] [Google Scholar]
- 6. Artavanis‐Tsakonas K, Tongren JE & Riley EM. The war between the malaria parasite and the immune system: immunity, immunoregulation and immunopathology. Clin Exp Immunol 2003; 133: 145–152. [DOI] [PMC free article] [PubMed] [Google Scholar]
- 7. Mackintosh CL, Beeson JG & Marsh K. Clinical features and pathogenesis of severe malaria. Trends Parasitol 2004; 20: 597–603. [DOI] [PubMed] [Google Scholar]
- 8. Smith CW. 3. Adhesion molecules and receptors. J Allergy Clin Immunol 2008; 2(Suppl): S375–S379. [DOI] [PubMed] [Google Scholar]
- 9. Chakravorty SJ & Craig A. The role of ICAM‐1 in Plasmodium falciparum cytoadherence. Eur J Cell Biol 2005; 84: 15–27. [DOI] [PubMed] [Google Scholar]
- 10. Van Gool SW, Vandenberghe P, de Boer M & Ceuppens JL. CD80, CD86 and CD40 provide accessory signals in a multiple‐step T‐cell activation model. Immunol Rev 1996; 153: 47–83. [DOI] [PubMed] [Google Scholar]
- 11. Takeda K, Kaisho T & Akira S. Toll‐like receptors. Annu Rev Immunol 2003; 21: 335–376. [DOI] [PubMed] [Google Scholar]
- 12. Hopkins PA & Sriskandan S. Mammalian Toll‐like receptors: to immunity and beyond. Clin Exp Immunol 2005; 140: 395–407. [DOI] [PMC free article] [PubMed] [Google Scholar]
- 13. Schofield L, Vivas L, Hackett F, Gerold P, Schwarz RT & Tachado S. Neutralizing monoclonal antibodies to glycosylphosphatidylinositol, the dominant TNF‐alpha‐inducing toxin of Plasmodium falciparum: prospects for the immunotherapy of severe malaria. Ann Trop Med Parasitol 1993; 87: 617–626. [DOI] [PubMed] [Google Scholar]
- 14. Krishnegowda G, Hajjar AM, Zhu J et al Induction of proinflammatory responses in macrophages by the glycosylphosphatidylinositols of Plasmodium falciparum: cell signaling receptors, glycosylphosphatidylinositol (GPI) structural requirement, and regulation of GPI activity. J Biol Chem 2005; 280: 8606–8616. [DOI] [PMC free article] [PubMed] [Google Scholar]
- 15. Couper KN, Barnes T, Hafalla JCR et al Parasite‐Derived Plasma Microparticles Contribute Significantly to Malaria Infection‐Induced Inflammation through Potent Macrophage Stimulation. PLoS Pathog 2010; 6: e1000744. [DOI] [PMC free article] [PubMed] [Google Scholar]
- 16. Wu X, Gowda NM, Kumar S & Gowda DC. Protein‐DNA complex is the exclusive malaria parasite component that activates dendritic cells and triggers innate immune responses. J Immunol 2010; 184: 4338–4348. [DOI] [PMC free article] [PubMed] [Google Scholar]
- 17. Coban C, Ishii KJ, Uematsu S et al Pathological role of Toll‐like receptor signalling in cerebral malaria. Int Immunol 2007; 19: 67–79. [DOI] [PubMed] [Google Scholar]
- 18. Parroche P, Lauw FN, Goutagny N et al Malaria haemozoin is immunologically inert but radically enhances innate responses by presenting malaria DNA to Toll‐like receptor 9. Proc Natl Acad Sci USA 2007; 104: 1919–1924. [DOI] [PMC free article] [PubMed] [Google Scholar]
- 19. Wu X, Gowda NM & Gowda DC. Plasmodium falciparum: differential merozoite dose requirements for maximal production of various inflammatory cytokines. Exp Parasitol 2011; 127: 202–207. [DOI] [PMC free article] [PubMed] [Google Scholar]
- 20. Gowda NM & Wu X. Gowda DC The Nucleosome (Histone‐DNA Complex) Is the TLR9‐Specific Immunostimulatory Component of Plasmodium falciparum That Activates DCs. PLoS One 2011; 6: e20398. [DOI] [PMC free article] [PubMed] [Google Scholar]
- 21. Chow JC, Young DW, Golenbock DT, Christ WJ & Gusovsky F. Toll‐like receptor‐4 mediates lipopolysaccharide‐induced signal transduction. J Biol Chem 1999; 274: 10689–10692. [DOI] [PubMed] [Google Scholar]
- 22. Goldberg DE. Hemoglobin degradation in Plasmodium‐infected red blood cells. Semin Cell Biol 1993; 4: 355–361. [DOI] [PubMed] [Google Scholar]
- 23. Schwarzer E, Skorokhod OA, Barrera V & Arese P. Hemozoin and the human monocyte–a brief review of their interactions. Parassitologia 2008; 50: 143–145. [PubMed] [Google Scholar]
- 24. Schwarzer E, Turrini F, Ulliers D, Giribaldi G, Ginsburg H & Arese P. Impairment of macrophage functions after ingestion of Plasmodium falciparum‐infected erythrocytes or isolated malarial pigment. J Exp Med 1992; 176: 1033–1041. [DOI] [PMC free article] [PubMed] [Google Scholar]
- 25. Schwarzer E, Alessio M, Ulliers D & Arese P. Phagocytosis of the malarial pigment, haemozoin, impairs expression of major histocompatibility complex class II antigen, CD54, and CD11c in human monocytes. Infect Immun 1998; 66: 1601–1606. [DOI] [PMC free article] [PubMed] [Google Scholar]
- 26. Mandala WL, Msefula CL, Gondwe EN et al Lymphocyte Perturbations in Malawian Children with Severe and Uncomplicated Malaria. Clin Vaccine Immunol 2016; 23: 95–103. [DOI] [PMC free article] [PubMed] [Google Scholar]
- 27. Rebelo M, Shapiro HM, Amaral T, Melo‐Cristino J & Hänscheid T. Haemozoin detection in infected erythrocytes for Plasmodium falciparum malaria diagnosis—Prospects and limitations. Acta Trop 2012; 123: 58–61. [DOI] [PubMed] [Google Scholar]
- 28. Hviid L, Kurtzhals JA, Adabayeri V et al Perturbation and proinflammatory type activation of V delta 1(+) gamma delta T cells in African children with Plasmodium falciparum malaria. Infect Immun 2001; 69: 3190–3196. [DOI] [PMC free article] [PubMed] [Google Scholar]
- 29. Worku S, Bjorkman A, Troye‐Blomberg M, Jemaneh L, Farnert A & Christensson B. Lymphocyte activation and subset redistribution in the peripheral blood in acute malaria illness: distinct gammadelta+ T cell patterns in Plasmodium falciparum and P. vivax infections. Clin Exp Immunol 1997; 108: 34–41. [DOI] [PMC free article] [PubMed] [Google Scholar]
- 30. Schofield L & Grau GE. Immunological processes in malaria pathogenesis. Nat Rev Immunol 2005; 5: 722–735. [DOI] [PubMed] [Google Scholar]
- 31. Boeuf PS, Loizon S, Awandare GA et al Insights into deregulated TNF and IL‐10 production in malaria: implications for understanding severe malarial anaemia. Malar J 2012; 11: 253. [DOI] [PMC free article] [PubMed] [Google Scholar]
- 32. Pichyangkul S, Saengkrai P, Yongvanitchit K, Heppner DG, Kyle DE & Webster HK. Regulation of leukocyte adhesion molecules CD11b/CD18 and leukocyte adhesion molecule‐1 on phagocytic cells activated by malaria pigment. Am J Trop Med Hyg 1997; 57: 383–388. [DOI] [PubMed] [Google Scholar]
- 33. Elhassan IM, Hviid L, Satti G et al Evidence of endothelial inflammation, T cell activation, and T cell reallocation in uncomplicated Plasmodium falciparum malaria. Am J Trop Med Hyg 1994; 51: 372–379. [DOI] [PubMed] [Google Scholar]
- 34. Nebl T, De Veer MJ & Schofield L. Stimulation of innate immune responses by malarial glycosylphosphatidylinositol via pattern recognition receptors. Parasitology 2005; 130(Suppl): S45–S62. [DOI] [PubMed] [Google Scholar]
- 35. Cordery DV, Kishore U, Kyes S et al Characterization of a Plasmodium falciparum macrophage‐migration inhibitory factor homologue. J Infect Dis 2007; 195: 905–912. [DOI] [PMC free article] [PubMed] [Google Scholar]
- 36. Loharungsikul S, Troye‐Blomberg M, Amoudruz P et al Expression of toll‐like receptors on antigen‐presenting cells in patients with falciparum malaria. Acta Trop 2008; 105: 10–15. [DOI] [PubMed] [Google Scholar]
- 37. McCall MB, Netea MG, Hermsen CC et al Plasmodium falciparum infection causes proinflammatory priming of human TLR responses. J Immunol 2007; 179: 162–171. [DOI] [PubMed] [Google Scholar]
- 38. Teirlinck AC, Roestenberg M, Bijker EM, Hoffman SL, Sauerwein RW & Scholzen A. Plasmodium falciparum Infection of Human Volunteers Activates Monocytes and CD16+ Dendritic Cells and Induces Upregulation of CD16 and CD1c Expression. Infect Immun 2015; 83: 3732–3739. [DOI] [PMC free article] [PubMed] [Google Scholar]
- 39. Prato M, Giribaldi G, Polimeni M, Gallo V & Arese P. Phagocytosis of hemozoin enhances matrix metalloproteinase‐9 activity and TNF‐alpha production in human monocytes: role of matrix metalloproteinases in the pathogenesis of falciparum malaria. J Immunol 2005; 175: 6436–6442. [DOI] [PubMed] [Google Scholar]
- 40. MacLennan CA & Levine MM. Invasive nontyphoidal Salmonella disease in Africa: current status. Expert Rev Anti Infect Ther 2013; 5: 443–446. [DOI] [PubMed] [Google Scholar]
- 41. MacLennan C, Fieschi C, Lammas DA et al Interleukin‐12 and/or interleukin‐23 are key cytokines for immunity against salmonella in humans. J Infect Dis 2004; 190: 1755–1757. [DOI] [PubMed] [Google Scholar]
- 42. Mastroeni P, Arena A, Costa GB, Liberto MC, Bonina L & Hormaeche CE. Serum TNF alpha in mouse typhoid and enhancement of a Salmonella infection by anti‐TNF alpha antibodies. Microb Pathog 1991; 11: 33–38. [DOI] [PubMed] [Google Scholar]
- 43. Mabey DC, Brown A & Greenwood BM. Plasmodium falciparum malaria and Salmonella infections in Gambian children. J Infect Dis 1987; 155: 1319–1321. [DOI] [PubMed] [Google Scholar]
- 44. Bronzan RN, Taylor TE, Mwenechanya J et al Bacteremia in Malawian children with severe malaria: prevalence, etiology, HIV coinfection, and outcome. J Infect Dis 2007; 195: 895–904. [DOI] [PubMed] [Google Scholar]
Associated Data
This section collects any data citations, data availability statements, or supplementary materials included in this article.
Supplementary Materials
Table S1. Medians (range) of demographic, clinical and haematological values of participants in first study to characterise expression of monocytes surface markers in different clinical presentations of malaria and in healthy controls.
Table S2. Medians (range) of demographic, clinical and haematological values of participants in second to determine the proportion of cytokine‐producing monocytes in different clinical presentations of malaria and in healthy controls.