

Abstract
Rodents are strongly attracted to the taste(s) of maltodextrins. A first step toward discovery of the underlying genes involves identifying phenotypic differences among inbred strains of mice. To do this, we used 5-s brief-access tests and 48-h 2-bottle choice tests to survey the avidity for the maltodextrin, Maltrin M040, of mice from 8 inbred strains (129S1/SvImJ, A/J, CAST/EiJ, C57BL/6J, NOD/ShiLTJ, NZO/HlLtJ, PWK/PhJ, and WSB/EiJ). In brief-access tests, the CAST and PWK strains licked significantly less maltodextrin than equivalent concentrations of sucrose, whereas the other strains generally licked the 2 carbohydrates equally. Similarly, in 2-bottle choice tests, the CAST and PWK strains drank less 4% maltodextrin than 4% sucrose, whereas the other strains had similar intakes of these 2 solutions; the CAST and PWK strains did not differ from the C57, NOD, or NZO strains in 4% sucrose intake. In sum, we have identified strain variation in maltodextrin perception that is distinct from variation in sucrose perception. The phenotypic variation characterized here will aid in identifying genes responsible for maltodextrin acceptance. Our results identify C57 × PWK mice or NZO × CAST mice as informative crosses to produce segregating hybrids that will expose quantitative trait loci underlying maltodextrin acceptance and preference.
Key words: 2-bottle choice test, brief-access tests, Collaborative Cross, gustometer, maltodextrin
Rodents and other mammals avidly ingest maltodextrins such as Maltrin M040, Maltrin 200, and Polycose (Sclafani and Xenakis 1984; Feigin et al. 1987; Sclafani and Mann 1987; Sclafani et al. 1987a; Formaker et al. 1998). It is unclear why because they are not sweet (Vigorito et al. 1987; Somenarain and Jakinovich 1990; Giza et al. 1991; Ackroff et al. 1993; Plata-Salamán et al. 1993; Sako et al. 1994; Rehnberg et al. 1996; Treesukosol et al. 2009; Zukerman et al. 2009; Treesukosol and Spector 2012) or starchy (Sclafani et al. 1987b; Ramirez 1991a, 1991b).
The goal of the present study was to create the groundwork to identify the genetic mechanisms underlying maltodextrin taste perception. The most efficient approach to discover the genes involved in any complex trait involves identifying inbred strains of mice that differ in phenotype (Hegmann and Possidente 1981; Tordoff 2008). To this end, we used brief-access tests and 48-h 2-bottle choice tests to survey the avidity for maltodextrin of 8 inbred mouse strains that are founders of the Collaborative Cross. These 8 strains capture 90% of the genetic variation of the mouse genome, and they are a particularly useful entry point for genetic analyses because large panels of inbred strains and diversity outbred strains have been derived from them (Collaborative Cross Consortium 2012; Panthier and Montagutelli 2012; Threadgill and Churchill 2012; Welsh et al. 2012). We used both 5-s brief-access tests and 48-h 2-bottle choice tests because each has its advantages: The brief-access tests are considered “purer” measures of orosensory influences, being less sullied by postingestive factors than are long-term choice tests; the long-term two-bottle choice tests tend to be more sensitive and are easier to conduct, which is an important consideration for genetic studies (see Tordoff 2008). Finally, we were interested in strain differences in the response to maltodextrin, so we also tested the mice with sucrose solutions, hoping to discover carbohydrate-specific strain differences (i.e., strain differences in response to maltodextrin that are not identical to strain differences in response to sucrose).
Materials and methods
Experiments followed the guidelines outlined in the National Research Council’s Guide for the Care and Use of Laboratory Animals, 8th edition. Protocols were approved by the Monell Chemical Senses Center Institutional Animal Care and Use Committee.
Mice
Groups of 7-week old mice (n = 12–18) from each of the following strains were obtained from The Jackson Laboratory: A/J, CAST/EiJ, C57BL/6J, NOD/ShiLTJ, NZO/HlLtJ, PWK/PhJ, WSB/EiJ, and 129S1/SvImJ (N = 132). All mice were individually housed in plastic tub-style cages (26.5cm × 17cm × 12cm) with stainless-steel grid lids and aspen wood shavings (NEPCO) scattered on the floor. The mice were maintained in a vivarium at 23°C on a 12:12h light/dark cycle with lights off at 7:00 PM. The mice ate pelleted AIN-76A diet (Dyets no. 100000) and drank deionized water. Because of equipment limitations, the mice were tested in 2–3 replications of 6 mice per strain, with each replication including an equal number of representatives of each strain. Mice began testing 1 week after their arrival in the animal facility. All mice were tested individually.
Brief-access tests
Procedure
Maltodextrin and sucrose acceptance were assessed using 5-s brief-access tests following a protocol designed to elicit licking responses to hedonically positive taste compounds, as described in detail elsewhere (Taruno et al. 2013). The mice were first water-deprived for 22.5h and then placed in a mouse gustometer (MS160; DiLog Instruments) and allowed uninterrupted access for 30min to a drinking spout that contained deionized water. The mice were then returned to their home cages and given water for 1h. On the following day, the same training procedure was repeated except the shutter allowing access to water was closed every 5 s for 7.5 s, and the session lasted only 20min. Gustometer training with deionized water continued each day until each mouse initiated at least 5 licking bouts during the training session. A licking bout was defined as one or more licks when the shutter door was open. After reaching the 5 licking bouts criterion, the mice were given a rest day where they received free access to food and water for 24h.
All mice received 3 test sessions with Maltrin M040 (Essex Grain) and 3 test sessions with sucrose (S9378; Sigma) in alternating order for a total of 6 test sessions. Rodents respond differently to different maltodextrins (e.g., Sclafani et al. 1987a) so the type of maltodextrin to test was an important design consideration. We chose to use Maltrin M040 as a representative maltodextrin for 3 reasons: First, although much previous work has used Polycose, this is no longer manufactured. Second, in contrast to Maltrin 200, Maltrin M040 has minimal sugar content (i.e., ~1.1% sugar) which minimizes the possibility that this provides a confounding chemosensory cue. Third, Maltrin M040 is relatively inexpensive and easy to obtain.
Only one test session was performed on each day. Twenty-four hours prior to each test, the mice were food- and water-restricted such that they received 1g of AIN-76A diet and 2mL of deionized water. Each test session consisted of 15min of 5-s exposures to 5 concentrations of maltodextrin or sucrose (0%, 2%, 4%, 8%, and 16%) presented in quasi-random order (i.e., a concentration appeared once and only once in every series of 5 solution presentations). The only exception to this was that the session began with a single presentation of the 16% concentration in order to kindle the mouse’s interest in the drinking spout. After the session, the mice were allowed to recover with free access to food and water for 24h.
Statistical analyses
The mean number of licks in response to each maltodextrin and sucrose concentration made by each mouse was obtained by averaging the number of licks made during identical 5-s exposures. These values for individual mice were then used in a 3-way ANOVA with factors of strain, carbohydrate (maltodextrin and sucrose) and concentration (0%, 2%, 4%, 8%, and 16%), which is reported in the results section. Although this experimental design included 3 factors, the 3-way ANOVA interaction term was not useful because it takes into account comparisons that are not meaningful (i.e., it compares sucrose licks and maltodextrin licks at unmatched concentrations among strains). Therefore, to aid with interpretation, we isolated significant interactions using 2-way ANOVAs (carbohydrate × concentration and strain × carbohydrate) followed by Tukey’s post hoc tests to identify differences between pairs of means.
To provide a global measure of avidity across all concentrations of sucrose and maltodextrin, we derived a value akin to “area under the curve:” The average number of licks at each solution spout (i.e., 2%, 4%, 6%, and 16% combined) was subtracted from the average number of licks at the water spout. Significant differences between the response to sucrose and maltodextrin were identified using t-tests for each strain.
The significance threshold for all statistical tests was set at P < 0.05. Performance of the A/J and 129 strains (n = 12 per strain) was poor, and thus their gustometer data are not presented. In addition, 13 mice from the other strains were excluded from analyses; One NOD mouse died <24h after it arrived in our facility, one CAST mouse escaped, and 11 mice did not lick one or more concentration of maltodextrin or sucrose (2 NOD, 3 NZO, 3 PWK, and 3 WSB). Thus strain means were based on 15–18 mice from 6 strains. Four mice did not lick one concentration of 1 solution during 1 test (1 CAST, 1 NZO, and 2 PWK) and in these cases, the group average was used to replace the missing value.
Two-bottle choice tests
Procedure
After completion of brief-access tests, all mice were given approximately 1 week with free access to food and water. They then received three 48-h choice tests with 2 graduated drinking tubes, which allowed measurements to be made to the nearest 0.1mL. During the first test, both drinking tubes (i.e., both the “water” and “solution” tube) contained deionized water to assess baseline drinking behavior. During the second test, the “water” tube contained deionized water and the “solution” tube contained 4% maltodextrin. During the third test, the “water” tube contained water and the “solution” tube contained 4% sucrose. Every 24h, the fluid volumes remaining were recorded, and the tube positions were switched to control for side preferences. We used only a single, relatively low, concentration of each carbohydrate for these tests to be well above detection threshold (see Tordoff and Ellis 2013) but to lessen the possibility that postingestive and carry-over effects might influence the outcomes of these tests (see Sclafani and Ackroff 2014).
Statistical analyses
The change in volume in a drinking tube was considered to be the mouse’s fluid intake. Solution intakes were obtained by calculating intakes from the “solution” tube. Total fluid intakes were obtained by adding together the intakes from both drinking tubes. Preference scores were calculated as intake of the solution divided by total intake, and expressed as a percentage. Solution intakes as a percentage of habitual water intake (%HWI) were calculated based on the intake of taste solution divided by total water intake during the test with 2 bottles of water (Tordoff 2010). These values were compared using 2-way ANOVAs with factors of strain and solution. Significant interactions were followed by Tukey’s post hoc tests to identify differences between pairs of means. Average strain weights and water intakes were compared using 1-way ANOVAs. Significant omnibus tests were followed by Tukey’s post hoc tests. Values presented in the text are means ± SEs.
Results
Brief-access tests
There were marked differences among strains in licking responses to both carbohydrates, and these depended on concentration [strain × carbohydrate × concentration, F(4, 20) = 2.02, P < 0.01]. All strains differed in their responses to maltodextrin and sucrose although there were differences among the strains in the concentrations that differed (see Table 1 for omnibus results, and Figure 1 for post hoc results). Integrated lick responses (i.e., “areas under the curve”) were strain- and carbohydrate-dependent: The C57, CAST, PWK, and WSB strains licked significantly less maltodextrin than sucrose; the NOD and NZO strains licked equally to the 2 carbohydrates (see bar graphs in Figure 1).
Table 1.
Brief-access tests: group sizes and results of 2-way ANOVAs for each strain
| Strain | Group sizes | Carbohydrates | Concentration | Carbohydrate × concentration |
|---|---|---|---|---|
| C57 | 18 | F(1, 34) = 3.72, P = 0.0621 | F(4, 136) = 142.4, P < 0.0001 | F(4, 136) = 8.42, P < 0.0001 |
| CAST | 17 | F(1, 32) = 17.9, P = 0.0002 | F(4, 128) = 103.3, P < 0.0001 | F(4, 128) = 4.41, P = 0.0023 |
| NOD | 15 | F(1, 28) = 2.84, P = 0.1031 | F(4, 112) = 113.0, P < 0.0001 | F(4, 112) = 9.33, P < 0.0001 |
| NZO | 15 | F(1, 28) = 0.53, P = 0.4714 | F(4, 112) = 43.31, P < 0.0001 | F(4, 112) = 6.03, P = 0.0002 |
| PWK | 15 | F(1, 28) = 46.2, P < 0.0001 | F(4, 112) = 78.61, P < 0.0001 | F(4, 112) = 11.0, P < 0.0001 |
| WSB | 15 | F(1, 28) = 8.74, P = 0.0063 | F(4, 112) = 51.34, P < 0.0001 | F(4, 112) = 3.16, P = 0.0167 |
Figure 1.

Licking responses of 6 strains of male mice to 0%, 2%, 4%, 8%, and 16% maltodextrin and sucrose. Symbols are means (ns = 15–18); vertical lines are SEs. Within each panel (i.e., each strain), licking means sharing the same letters did not differ significantly (P < 0.05). Bar graphs show the area under the curve for sucrose (black) and maltodextrin (green). *, P < 0.05, **, P < 0.01 relative to response to sucrose.
Despite large strain differences in body weight (Table 2), all strains licked water and 2% sucrose equally (see Table 3 for omnibus results, and Figure 2 for post hoc results). At all concentrations of maltodextrin (2–16%), the PWK strain had the lowest lick rates and the NOD strain had the highest lick rates (Figure 2). In contrast, the C57 strain licked 4% sucrose less than did all other strains, and less 8% and 16% sucrose than did the NOD strain (Figure 2). There was no relationship between average strain body weight and licks for water, maltodextrin, or sucrose (all rs < 0.6, all ps > 0.05; data not shown).
Table 2.
Summary of body weights and water intakes of 8 strains of mice
| Strain | Brief-access test | 2-Bottle choice test | |
|---|---|---|---|
| Weight, g | Weight, g | Water intakes, mL/d | |
| 129 | 22±1b | 25±1b | 4.16±1a,b |
| A/J | 21±1b | 23±0b | 3.86±1a,b |
| C57 | 22±0b | 24±0b | 4.66±1b,c |
| CAST | 13±0a | 15±0a | 3.79±1a,b |
| NOD | 24±0b | 28±0b | 5.73±1c |
| NZO | 35±1c | 43±2c | 9.24±2d |
| PWK | 14±0a | 16±0a | 3.02±0a |
| WSB | 14±0a | 16±0a | 3.03±0a |
Mice were aged 54–58 days prior to brief-access tests and 82–96 days prior to 2-bottle tests. Water intakes refer to total intakes from 2 bottles when both contained water. Weights and intakes showing the same letters do not significantly differ.
Table 3.
Brief-access tests: results of 2-way ANOVAs for each carbohydrate
| Carbohydrate | Strain | Concentration | Strain × concentration |
|---|---|---|---|
| Sucrose | F(5, 89) = 6.62, P < 0.0001 | F(4, 356) = 723.5, P < 0.0001 | F(4, 356) = 3.40, P < 0.0001 |
| Maltodextrin | F(5, 89) = 10.6, P < 0.0001 | F(4, 356) = 88.5, P < 0.0001 | F(4, 356) = 1.96, P = 0.0087 |
Figure 2.

Licking rates of 6 strains of male mice to 0%, 2%, 4%, 8%, and 16% maltodextrin and sucrose. Bars are means (ns = 15–18); vertical lines are SEs. Within each panel (i.e., maltodextrin or sucrose), strains and solutions sharing the same letters did not differ significantly (P < 0.05).
Two-bottle choice tests
There were significant strain × carbohydrate interactions for all measures (Intake, Percent Preference, %HWI) during the 2-bottle choice tests (see Table 4 for omnibus results). During the 48-h test with a choice between 2 bottles of water, total intakes differed among the strains [strain × water intake, F(7, 110) = 68.6, P < 0.0001] in close correspondence with their body weights, which also differed at the beginning of 2-bottle testing [strain × weight, F(7, 119) = 43.4, P < 0.001] (Table 2). The NZO strain drank significantly more water than did the other strains, and the PWK and WSB strains drank significantly less water than did the other strains. The CAST, A/J, 129, and C57 strains had intakes that were intermediate between the 2 extremes formed by the NZO and PWK + WSB groups. Water consumption did not differ between the C57 and NOD strains, or between the CAST, A/J, or 129 strains.
Table 4.
Two-bottle choice tests: results of 2-way ANOVAs for intakes, percent preference, and %HWI measures
| 2-Bottle choice measure | Strain | Carbohydrate | Strain × carbohydrate |
|---|---|---|---|
| Intake | F(7, 110) = 29.8, P < 0.0001 | F(2, 220) = 290.0, P < 0.0001 | F(14, 220) = 25.8, P < 0.0001 |
| Percent preference | F(7, 103) = 5.65, P < 0.0001 | F(2, 206) = 357.7, P < 0.0001 | F(14, 206) = 7.00, P < 0.0001 |
| %HWI | F(7, 103) = 10.5, P < 0.0001 | F(1, 103) = 14.2, P = 0.0003 | F(7, 103) = 7.18, P < 0.0001 |
During the 48-h test with a choice between water and 4% maltodextrin, the CAST, PWK, and WSB strains drank significantly less 4% maltodextrin than did the 129, C57, NOD, and NZO strains; maltodextrin intakes of the A/J strain did not differ from those of any other strain (Figure 3A).
Figure 3.
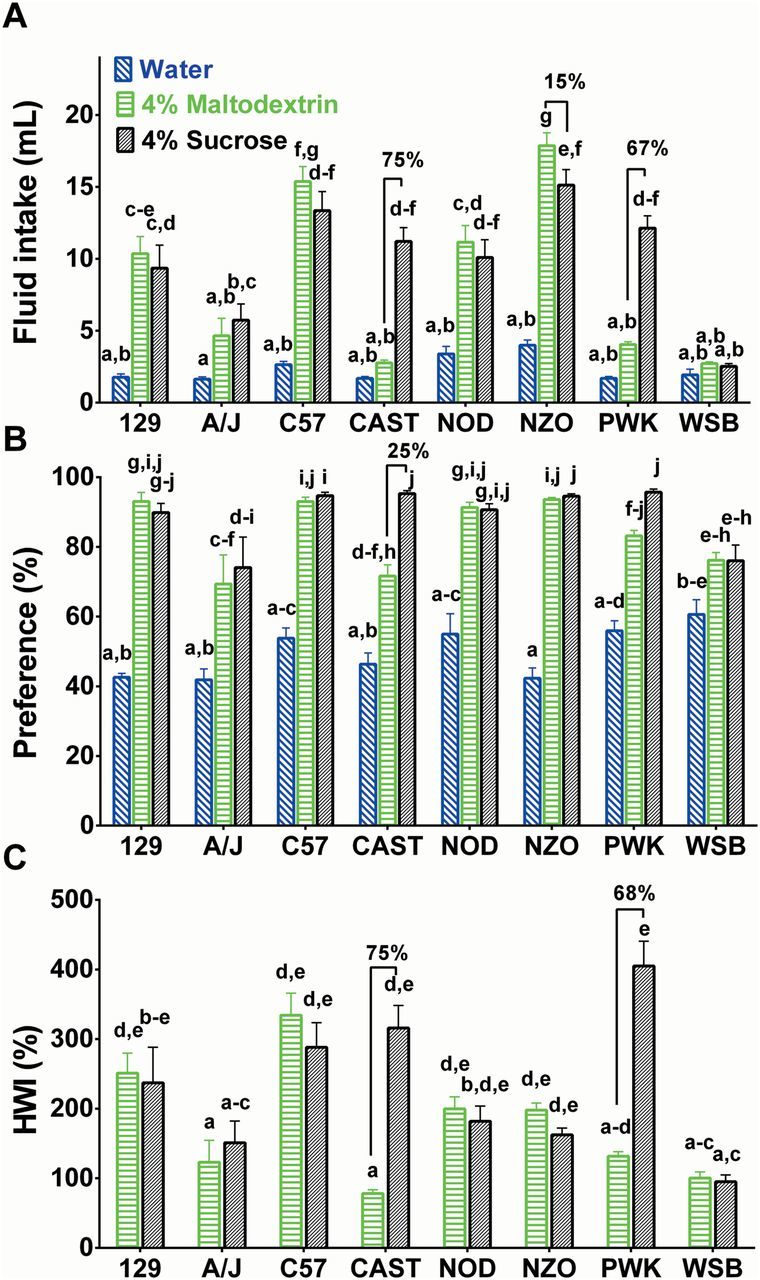
Three measures describing the avidity of 8 strains of mice for water, 4% maltodextrin, and 4% sucrose. Two-bottle choice intakes (A), preference scores (B), and %HWI scores (C) of 8 mouse strains. The water intakes shown in panel A are the average intakes from the “solution” tube when both tubes contained water. Symbols are means (ns = 12–18). Within each panel, strains and solutions sharing the same letters did not differ significantly (P < 0.05). Significant percent differences for maltodextrin and sucrose within each strain are shown above the letters.
During the 48-h test with a choice between water and 4% sucrose, the WSB strain drank 73–83% less 4% sucrose than did all the other strains except the A/J strain (Figure 3A). In contrast to what was found with 4% maltodextrin, the CAST and PWK strains drank significantly more 4% sucrose than did the WSB strain (Figure 3A).
Heavier strains (see Table 2 for average strain weights) drank more water (r = 0.69, P = 0.01) and maltodextrin (r = 0.89, P < 0.01), but not sucrose (r = 0.01, P > 0.05; data not shown). To determine whether these relationships could account for the strain differences we made the same comparisons using preference scores and increases from habitual water intakes (%HWI scores), which involve different corrections for body size and other contributors to nonspecific fluid intake. Both of these measures were generally consistent with “raw” carbohydrate intakes (Figure 3B,C), although there were a few differences. Most strains had preference scores for one or both carbohydrates that were higher than 85%, suggesting that variability among strains may have been constricted by a ceiling effect. All strains showed significant preferences for 4% maltodextrin and 4% sucrose over water (Figure 3B). However, the CAST strain was the only strain that showed a significantly stronger preference for 4% sucrose than for 4% maltodextrin (the CAST strain showed a 25% higher preference for sucrose compared with maltodextrin).
Irrespective of the metric used, the CAST and PWK strains displayed a greater avidity for 4% sucrose than for 4% maltodextrin (Figure 3). The NZO strain had the highest intake of both 4% sucrose and 4% maltodextrin, and the WSB strain had the lowest intake of both carbohydrates. There was no difference in 4% sucrose intake between the C57, NZO, CAST, and PWK strains, yet the CAST and PWK drank significantly less 4% maltodextrin than did the C57 and NZO strains.
Discussion
We measured the behavioral responses of 8 inbred mouse strains to the maltodextrin, Maltrin M040, and to sucrose. In 5-s brief access tests, there were marked strain differences in licking for 2–8% maltodextrin relative to the equivalent concentrations of sucrose. The CAST and PWK strains licked significantly less maltodextrin than sucrose whereas the C57, NZO, NOD, and WSB strains responded similarly to these concentrations of the 2 carbohydrates. All strains except the CAST strain licked less 16% maltodextrin than 16% sucrose. Thus, the strain differences were concentration-dependent but, nevertheless, over all concentrations combined, the CAST and PWK strains licked less maltodextrin than sucrose; the other strains did not. This pattern of results was recapitulated in the 48-h 2-bottle choice tests: the CAST and PWK strains drank ~70% less 4% maltodextrin than 4% sucrose whereas the other strains drank similar quantities of 4% maltodextrin and 4% sucrose. We conclude that the CAST and PWK strains have a muted behavioral response to maltodextrin relative to the other strains tested.
Mouse strains have been categorized as “sweet-sensitive” or “sweet-hyposensitive” based on the haplotype of a region of the Tas1r3 gene (Reed et al. 2004; Tordoff et al. 2008b). Five of the strains tested here have the sweet-sensitive haplotype (C57, CAST, NOD, PWK, and WSB) and 3 have the sweet-hyposensitive haplotype (129, A/J, and NZO). There was no clear relationship between Tas1r3 haplotype and behavioral responses to sucrose in either the brief-access tests or the 2-bottle choice tests. For example, contrary to expectations, 4% sucrose intakes were highest in the “sweet-hyposensitive” NZO strain and lowest in the “sweet-sensitive” WSB strain. Clearly, factors other than Tas1r3 haplotype can determine the response to sweeteners (see also Glendinning et al. 2005b).
Rats can distinguish between sweet and maltodextrin compounds by taste (Bonacchi et al. 2008). Moreover, maltodextrin detection does not require the T1R2 + T1R3 sweet receptor (Treesukosol et al. 2009; Zukerman et al. 2009; Treesukosol et al. 2011; Treesukosol and Spector 2012). However, it does involve other elements of the canonical G protein-coupled receptor (GPCR) taste transduction cascade: The behavioral response to maltodextrin is attenuated or eliminated by genetic ablation of alpha-gustducin (Gnat3), TRPM5, ITPR3, CALHM1, and P2X2 + P2X3 (Glendinning et al. 2005a; Damak et al. 2006; Sclafani et al. 2007; Taruno et al. 2013; Tordoff and Ellis 2013; Sclafani and Ackroff 2014). These findings indicate that maltodextrin is most likely detected by a GPCR. This could be as of yet unidentified or a known GPCR that has not yet been implicated in maltodextrin taste.
To our knowledge, this is the first concerted attempt to survey maltodextrin acceptance in several mouse strains, although there is work in rats (Tordoff et al. 2008a; Tordoff 2010). Several studies have compared the C57 and 129 mouse strains (Bachmanov et al. 2001; Sclafani 2006; Johnson et al. 2010). Johnson et al. (2010) and Sclafani (2006) found that these 2 strains licked maltodextrin solutions similarly, and Bachmanov et al. (2001) reported that the C57 and 129 strains showed similar intakes of 0.003% and 30% Polycose solutions (when corrected for differences in body weight). However, Sclafani (2006) found that the C57 strain had a stronger preference for dilute Polycose (0.5%, 1%, 2%, and 4%) than did the 129 strain. Thus, the findings are not entirely consistent, most likely because experience with other taste solutions can influence intake and preference of maltodextrins (see Sclafani 2006).
The study reported here was designed to reduce the potential effects of experience as much as practical but this goal was balanced against budgetary constraints and the need to gain the maximum information possible from as few mice as possible. To this end, we conducted brief-access tests before 2-bottle choice tests so as to minimize the contribution of postingestive effects. Furthermore, only one, low concentration of each carbohydrate was used for 2-bottle choice tests to limit carry-over effects between maltodextrin and sucrose. Despite these precautions, it will require additional studies to ensure that prior exposure to maltodextrin had no effects on the responses to sucrose.
A concern when performing 2-bottle choice tests with highly preferred solutions is that measures of acceptability can be influenced by factors unrelated to taste. For example, bigger animals drink more (of everything) and simply adjusting intakes for body weight or body size is unsatisfactory (Bachmanov et al. 2002; Tordoff et al. 2007a, 2007b). For taste solutions that have low or moderate hedonic valence, preference ratios (i.e., solution intake/total intake) appear to provide a relatively unbiased measure but, as the present results show, for strongly preferred solutions such as sucrose and maltodextrin, a ceiling on preference scores restricts the expression of differences observed with raw intakes. In other work, we have advocated using the percent of habitual water intake (%HWI) score to compare responses to such taste solutions across strains because this both adjusts for general factors (i.e., the motivation to drink water) and has no statistical limit on intakes (see Tordoff et al. 2008a). The relative merits of each measure are debatable but moot for the present work because all 3 measures—raw solution intakes, preference scores, and %HWI scores—revealed similar effects, namely that (i) the CAST and PWK strains responded avidly to 4% sucrose but not to 4% maltodextrin, (ii) the WSB and, to a lesser extent, A/J strains had lower responses to both carbohydrates than did the other strains, and (iii) the 129, C57, NOD, and NZO strains responded similarly to both carbohydrates. The implication is that these differences are biologically significant as well as being statistically significant.
Some of the strains tested here have rarely been used for taste studies, and, to our knowledge, there has been no previous work to examine the responses of the WSB strain to carbohydrate solutions. Our findings are intriguing: In brief-access tests, the WSB strain responded to high concentrations of maltodextrin and sucrose, but in 48-h tests, it drank no more 4% maltodextrin or 4% sucrose than water. This is particularly surprising because the WSB strain has a “sweet-sensitive” Tas1r3 haplotype. Perhaps this strain lacks sensitivity to low concentrations of both carbohydrates because of a mutation influencing a common component of carbohydrate taste transduction or motivation. More likely, however, is a general avoidance of all taste solutions because in a survey of 40 strains, the WSB strain had the lowest preferences for several concentrations of sodium chloride and sodium lactate (Tordoff et al. 2007b), and it ranked among the lowest for preferences of calcium chloride and calcium lactate (Tordoff et al. 2007a). The A/J strain also had tepid responses to both maltodextrin and sucrose [a finding apparently discrepant with Lewis et al. (2005)] but, in contrast to the WSB strain, it ranked near the middle in responses to sodium and calcium solutions (Tordoff et al. 2007a, 2007b). It would be interesting to know how these strains respond to other tastes, both nutritive and nonnutritive.
The 8 strains of mice we compared here are founders of the Collaborative Cross. This is an ambitious project to generate ~1000 genetically defined inbred strains with combinations of genes inherited from the founders (Churchill et al. 2004). The founders include representatives from 3 Mus musculus subspecies, and together they have been calculated to capture 90% of the genetic variation of the mouse genome (Panthier and Montagutelli 2012). It is not entirely unexpected, then, that these 8 strains capture variation in maltodextrin perception that is distinct from variation in sucrose perception. This specificity suggests that there are strain differences in maltodextrin-specific transduction pathways, with an obvious possibility being differences in the structure of the maltodextrin taste receptor(s). Irrespective of the precise mechanism, our findings provide target strains that can be used to identify the underlying genes. In particular, we suspect that a cross of C57 × PWK mice or NZO × CAST mice, which differ markedly in response to maltodextrin but not sucrose, would likely produce segregating hybrids that could expose quantitative trait loci underlying maltodextrin acceptance (for a review of the approach, see Tordoff 2008). Thus, we have taken the first step toward a genetic analysis of maltodextrin avidity.
Funding
This work was supported by National Institutes of Health (DK-46791 to M.G.T.). Mouse gustometry was performed using equipment belonging to the Monell Phenotyping Core, which is supported, in part, by funding from the National Institute on Deafness and Other Communication Disorders P30 Core (DC011735). R.L.P. was supported by National Institute on Deafness and Other Communication Disorders Training (T32 DC000014).
References
- Ackroff K, Manza L, Sclafani A. 1993. The rat’s preference for sucrose, polycose and their mixtures. Appetite. 21(1):69–80. [DOI] [PubMed] [Google Scholar]
- Bachmanov AA, Tordoff MG, Beauchamp GK. 2001. Sweetener preference of C57BL/6ByJ and 129P3/J mice. Chem Senses. 26(7):905–913. [DOI] [PMC free article] [PubMed] [Google Scholar]
- Bachmanov AA, Reed DR, Beauchamp GK, Tordoff MG. 2002. Food intake, water intake, and drinking spout side preference of 28 mouse strains. Behav Genet. 32(6):435–443. [DOI] [PMC free article] [PubMed] [Google Scholar]
- Bonacchi KB, Ackroff K, Sclafani A. 2008. Sucrose taste but not Polycose taste conditions flavor preferences in rats. Physiol Behav. 95(1–2):235–244. [DOI] [PMC free article] [PubMed] [Google Scholar]
- Churchill GA, Airey DC, Allayee H, Angel JM, Attie AD, et al. et al. 2004. The Collaborative Cross, a community resource for the genetic analysis of complex traits. Nat Genet. 36(11):1133–1137. [DOI] [PubMed] [Google Scholar]
- Collaborative Cross Consortium. 2012. The genome architecture of the Collaborative Cross mouse genetic reference population. Genetics. 190(2):389–401. [DOI] [PMC free article] [PubMed] [Google Scholar]
- Damak S, Rong M, Yasumatsu K, Kokrashvili Z, Perez CA, et al. et al. 2006. Trpm5 null mice respond to bitter, sweet, and umami compounds. Chem Senses. 31(3):253–264. [DOI] [PubMed] [Google Scholar]
- Feigin MB, Sclafani A, Sunday SR. 1987. Species differences in polysaccharide and sugar taste preferences. Neurosci Biobehav Rev. 11(2):231–240. [DOI] [PubMed] [Google Scholar]
- Formaker BK, Kearns CE, Frank ME. 1998. The taste of polycose in hamsters. Chem Senses. 23(6):675–682. [DOI] [PubMed] [Google Scholar]
- Giza BK, Scott TR, Sclafani A, Antonucci RF. 1991. Polysaccharides as taste stimuli: their effect in the nucleus tractus solitarius of the rat. Brain Res. 555(1):1–9. [DOI] [PubMed] [Google Scholar]
- Glendinning JI, Bloom LD, Onishi M, Zheng KH, Damak S, et al. 2005a. Contribution of alpha-gustducin to taste-guided licking responses of mice. Chem Senses. 30(4):299–316. [DOI] [PubMed] [Google Scholar]
- Glendinning JI, Chyou S, Lin I, Onishi M, Patel P, et al. 2005b. Initial licking responses of mice to sweeteners: effects of tas1r3 polymorphisms. Chem Senses. 30(7):601–614. [DOI] [PubMed] [Google Scholar]
- Hegmann JP, Possidente B. 1981. Estimating genetic correlations from inbred strains. Behav Genet. 11(2):103–114. [DOI] [PubMed] [Google Scholar]
- Johnson AW, Sherwood A, Smith DR, Wosiski-Kuhn M, Gallagher M, et al. 2010. An analysis of licking microstructure in three strains of mice. Appetite. 54(2):320–330. [DOI] [PMC free article] [PubMed] [Google Scholar]
- Lewis SR, Ahmed S, Dym C, Khaimova E, Kest B, et al. 2005. Inbred mouse strain survey of sucrose intake. Physiol Behav. 85(5):546–556. [DOI] [PubMed] [Google Scholar]
- Panthier JJ, Montagutelli X. 2012. [The Collaborative Cross, a groundbreaking tool to tackle complex traits]. Med Sci (Paris). 28(1):103–108. [DOI] [PubMed] [Google Scholar]
- Plata-Salamán CR, Scott TR, Smith-Swintosky VL. 1993. Gustatory neural coding in the monkey cortex: the quality of sweetness. J Neurophysiol. 69(2):482–493. [DOI] [PubMed] [Google Scholar]
- Ramirez I. 1991a. Does starch taste like Polycose? Physiol Behav. 50(2):389–392. [DOI] [PubMed] [Google Scholar]
- Ramirez I. 1991b. Thresholds for starch and Polycose are lower than for sucrose in rats. Physiol Behav. 50(4):699–703. [DOI] [PubMed] [Google Scholar]
- Rehnberg BG, MacKinnon BI, Hettinger TP, Frank ME. 1996. Analysis of polysaccharide taste in hamsters: behavioral and neural studies. Physiol Behav. 59(3):505–516. [DOI] [PubMed] [Google Scholar]
- Reed DR, Li S, Huang L, Tordoff MG, Starling-Roney R, et al. et al. 2004. Polymorhphisms in the taste receptor gene (Tas1r3) region are associated with saccharin preference in 30 mouse strains. J Neurosci. 24(4):938–946. [DOI] [PMC free article] [PubMed] [Google Scholar]
- Sako N, Shimura T, Komure M, Mochizuki R, Matsuo R, Yamamoto T. 1994. Differences in taste responses to Polycose and common sugars in the rat as revealed by behavioral and electrophysiological studies. Physiol Behav. 56(4):741–745. [DOI] [PubMed] [Google Scholar]
- Sclafani A. 2006. Enhanced sucrose and Polycose preference in sweet “sensitive” (C57BL/6J) and “subsensitive” (129P3/J) mice after experience with these saccharides. Physiol Behav. 87(4):745–756. [DOI] [PubMed] [Google Scholar]
- Sclafani A, Ackroff K. 2014. Maltodextrin and fat preference deficits in “taste-blind” P2X2/P2X3 knockout mice. Chem Senses. 39(6):507–514. [DOI] [PMC free article] [PubMed] [Google Scholar]
- Sclafani A, Hertwig H, Vigorito M, Sloan H, Kerzner B. 1987a. Influence of saccharide length on polysaccharide appetite in the rat. Neurosci Biobehav Rev. 11(2):197–200. [DOI] [PubMed] [Google Scholar]
- Sclafani A, Mann S. 1987. Carbohydrate taste preferences in rats: glucose, sucrose, maltose, fructose and polycose compared. Physiol Behav. 40(5):563–568. [DOI] [PubMed] [Google Scholar]
- Sclafani A, Nissenbaum JW, Vigorito M. 1987b. Starch preference in rats. Neurosci Biobehav Rev. 11(2):253–262. [DOI] [PubMed] [Google Scholar]
- Sclafani A, Xenakis S. 1984. Sucrose and polysaccharide induced obesity in the rat. Physiol Behav. 32(2):169–174. [DOI] [PubMed] [Google Scholar]
- Sclafani A, Zukerman S, Glendinning JI, Margolskee RF. 2007. Fat and carbohydrate preferences in mice: the contribution of alpha-gustducin and Trpm5 taste-signaling proteins. Am J Physiol Regul Integr Comp Physiol. 293(4):R1504–R1513. [DOI] [PMC free article] [PubMed] [Google Scholar]
- Somenarain L, Jakinovich W., Jr 1990. Antagonism of the gerbil’s sweetener and Polycose gustatory responses by copper chloride. Brain Res. 522(1):83–89. [DOI] [PubMed] [Google Scholar]
- Taruno A, Vingtdeux V, Ohmoto M, Ma Z, Dvoryanchikov G, et al. et al. 2013. CALHM1 ion channel mediates purinergic neurotransmission of sweet, bitter and umami tastes. Nature 495(7440):223–226. [DOI] [PMC free article] [PubMed] [Google Scholar]
- Threadgill DW, Churchill GA. 2012. Ten years of the Collaborative Cross. Genetics. 190(2):291–294. [DOI] [PMC free article] [PubMed] [Google Scholar]
- Tordoff MG. 2008. Gene discovery and the genetic basis of calcium consumption. Physiol Behav. 94(5):649–659. [DOI] [PMC free article] [PubMed] [Google Scholar]
- Tordoff MG. 2010. Taste solution consumption by FHH-Chr nBN consomic rats. Chem Senses. 35(6):473–489. [DOI] [PMC free article] [PubMed] [Google Scholar]
- Tordoff MG, Alarcon LK, Lawler MP. 2008a. Preferences of 14 rat strains for 17 taste compounds. Physiol Behav. 95(3):308–332. [DOI] [PMC free article] [PubMed] [Google Scholar]
- Tordoff MG Bachmanov AA and Reed DR. 2007a. Forty mouse strain survey of voluntary calcium intake, blood calcium, and bone mineral content. Physiol Behav. 91(5):632–643. [DOI] [PMC free article] [PubMed] [Google Scholar]
- Tordoff MG, Bachmanov AA, Reed DR. 2007b. Forty mouse strain survey of water and sodium intake. Physiol Behav. 91(5):620–631. [DOI] [PMC free article] [PubMed] [Google Scholar]
- Tordoff MG, Ellis HT. 2013. Taste dysfunction in BTBR mice due to a mutation of Itpr3, the inositol triphosphate receptor 3 gene. Physiol Genomics. 45(18):834–855. [DOI] [PMC free article] [PubMed] [Google Scholar]
- Tordoff MG, Shao H, Alarcon LK, Margolskee RF, Mosinger B, et al. 2008b. Involvement of T1R3 in calcium-magnesium taste. Physiol Genomics. 34(3):338–348. [DOI] [PMC free article] [PubMed] [Google Scholar]
- Treesukosol Y, Blonde GD, Spector AC. 2009. T1R2 and T1R3 subunits are individually unnecessary for normal affective licking responses to Polycose: implications for saccharide taste receptors in mice. Am J Physiol Regul Integr Comp Physiol 296(4):R855–R865. [DOI] [PMC free article] [PubMed] [Google Scholar]
- Treesukosol Y, Smith KR, Spector AC. 2011. Behavioral evidence for a glucose polymer taste receptor that is independent of the T1R2+3 heterodimer in a mouse model. J Neurosci. 31(38):13527–13534. [DOI] [PMC free article] [PubMed] [Google Scholar]
- Treesukosol Y, Spector AC. 2012. Orosensory detection of sucrose, maltose, and glucose is severely impaired in mice lacking T1R2 or T1R3, but Polycose sensitivity remains relatively normal. Am J Physiol Regul Integr Comp Physiol. 303(2):R218–R235. [DOI] [PMC free article] [PubMed] [Google Scholar]
- Vigorito M, Sclafani A, Jacquin MF. 1987. Effects of gustatory deafferentation on Polycose and sucrose appetite in the rat. Neurosci Biobehav Rev. 11(2):201–209. [DOI] [PubMed] [Google Scholar]
- Welsh CE, Miller DR, Manly KF, Wang J, McMillan L, et al. 2012. Status and access to the Collaborative Cross population. Mamm Genome. 23(9–10):706–712. [DOI] [PMC free article] [PubMed] [Google Scholar]
- Zukerman S, Glendinning JI, Margolskee RF, Sclafani A. 2009. T1R3 taste receptor is critical for sucrose but not Polycose taste. Am J Physiol Regul Integr Comp Physiol. 296(4):R866–R876. [DOI] [PMC free article] [PubMed] [Google Scholar]