Abstract
Nanozyme-based chemical sensing is a rapidly emerging field of research. Herein, a simple colorimetric assay for the detection of hydrogen peroxide and glucose based on the peroxidase-like activity of V2O5 nanozymes has been established. In this assay, the effects of pH, substrate, nanozyme concentrations and buffer solution have been investigated. It was found that compared with 3,3′,5,5′-tetramethylbenzidine (TMB), the enzyme substrate o-phenylenediamine (OPD) seriously interfered with the H2O2 detection. Under the optimal reaction conditions, the resulting sensor displayed a good response to H2O2 with a linear range of 1 to 500 μM, and a detection limit of 1 μM at a signal-to-noise ratio of 3. A linear correlation was established between absorbance intensity and concentration of glucose from 10 to 2000 μM, with a detection limit of 10 μM. The current work presents a simple, cheap, more convenient, sensitive, and easy handling colorimetric assay.
Keywords: V2O5 nanozymes, variation, substrates, H2O2, glucose
1. Introduction
Nanozymes, as the next-generation artificial enzymes, have attracted wide interest in recent years. Compared with natural enzymes, nanozymes, with their advantages of high stability against denaturing, low-cost, easy storage and treatment are attractive and promising candidates in chemical sensing, immunoassay development, cancer diagnostics and therapy, and environmental protection [1]. At present, a large number of nanoparticle (NP) artificial enzymes have been constructed to mimic natural enzymes, including iron oxide-based NPs with peroxidase and catalase-like activities [2,3], cerium oxide-based nanomaterials with oxidase, catalase and SOD mimetic properties [4,5], cobalt oxide ones that are peroxide and catalase mimics [6,7], copper oxide and manganese dioxide nanomaterials that display oxidase-like activity [8,9], vanadium pentoxide peroxidase mimics [10], and metal/bimetal-based [11] and carbon-based NPs [12] with oxidase, peroxidase, and SOD mimetic activity. Thereinto, vanadium pentoxide nanowires had aroused special attention due to their activity towards peroxidase substrates and long-term antibiofouling capabilities [13,14]. However, to date, no facile, fast and ultrasensitive detection methods have been developed based on the peroxidase catalytic activity of vanadium pentoxide nanowires. Additionally, more research is needed on the nanozyme catalytic reaction for biological and chemical analysis.
Hydrogen peroxide (H2O2), an essential oxidizing agent, plays an important role in the food production, biomedicine, pharmaceutical, industrial and environmental fields [15]. It was proved to be a byproduct of metabolic oxidation processes, and it is immediately dangerous to life and health when its concentration reaches 75 ppm [16]. Glucose is one of the essential nutrients and an important source of energy for human life via its in vivo metabolism. Blood glucose levels in healthy humans stay within narrow limits throughout the day (4.0–8.0 mmol/L) [17]. Glucose is also widely used in the food and pharmaceutical industry, therefore, quantitative determination of glucose is significant for industrial quality control and processing applications [18]. Most glucose biosensors are based on the oxidation or reduction of enzymatically produced H2O2 [19,20,21,22]. Hence, the detection of H2O2 concentrations has attracted the interest of many chemists for a long time. Until now, several techniques have been developed for a reliable and sensitive determination of H2O2, such as chemiluminescence [23], fluorometry [24], liquid chromatography [25] and electrochemistry [26]. Among these methods, sensitive spectrometric methods for the H2O2 determination based on the horseradish peroxidase (HRP)-catalyzed enzymatic reactions have attracted substantial attention owing to the rapid response, and low fabrication cost characteristics [27,28]. Although HRP has high specificity and sensitivity, the application of the free natural enzyme is limited by its poor stability, and high cost [29].
In this paper, a simple colorimetric assay for the detection of hydrogen peroxide and glucose based on the peroxidase-like activity of V2O5 nanozymes has been established. In this assay, the effects of pH, substrate, nanozymes concentrations and buffer solution have been investigated. Under the optimal reaction conditions, the resulting biosensor displayed a good response to H2O2 and glucose. In addition, it exhibited excellent anti-interference ability and fast response. The colorimetric assay based on V2O5 nanozymes may be broadly applicable in clinical diagnoses and monitoring environmental water pollution.
2. Materials and Methods
2.1. Chemicals and Materials
All the chemicals were of analysis grade and used without further purification. 3,3′,5,5′-Tetramethylbenzidine (TMB) was purchased from Tokyo Chemical Industry Co., Ltd. (Tokyo, Japan). Glucose oxidase (GOx) was purchased from Aladdin Reagent Co., Ltd. (Shanghai, China). o-Phenylenediamine (OPD) was purchased from Tianjin Guangfu Fine Chemical Research Institute (Tianji, China). VOSO4, KBrO3, glucose and 30% H2O2, etc. were purchased from Beijing Chemical Works (Beijing, China).
2.2. Synthesis of V2O5 Nanozymes
V2O5 nanozymes were synthesized according to a literature procedure [30], with minor adjustments. In brief, VOSO4·nH2O (2.4 mmol) and KBrO3 (1.5 mmol) were dissolved in distilled water (9 mL) and stirred for 30 min at room temperature. Then the solution was transferred to a Teflon-lined stainless steel autoclave, which was maintained at 180 °C for 24 h. After the sample was cooled to room temperature naturally, the resulting dark yellow precipitates were filtered off, washed with distilled water and ethanol several times, and dried in an oven at 80 °C.
2.3. Physical Characterization
The V2O5 nanozymes were thoroughly characterized by various methods. Transmission electron microscopy (TEM) observation was performed using a 100CX transmission electron microscope (JEOL, Tokyo, Japan) with an acceleration voltage of 100 kV. The Fourier Transform Infrared (FTIR) spectra were recorded in the range 400–4000 cm−1 on an Alpha Centauri FT/IR spectrophotometer (Nicolet, Denver, CO, USA) using KBr pellets. The X-ray powder diffraction method was carried out in a D/max-rA power diffractometer (Rigaku, Tokyo, Japan) using Cu-Kα monochromatic radiation (λ = 1.5418 Å).
2.4. H2O2 Detection Using V2O5 Nanozymes
With OPD or TMB as substrate, the H2O2 sensing assay was performed as follows: V2O5 nanozymes solution (1 mM, 60 μL) was added into NaOAc-HOAc buffer solution (pH = 4.0, 2400 μL), followed by the addition of TMB (or OPD) solution (1.5 mM in ethanol, 480 μL) and H2O2 (30%, 60 μL). The UV/Vis spectra were recorded at 660 nm for TMB and 450 nm for OPD after reaction for 5 min vs. a blank containing only the substrate solution. The buffer solutions from pH 3.0 to 8.0 and different reaction buffers were investigated, under conditions identical to those used above. All assays were done at 25 °C unless otherwise indicated, and analysed with a UV-Vis spectrophotometer (Metash Instruments Inc., Shanghai, China).
2.5. Glucose Detection Using V2O5 Nanozymes
Glucose detection was performed as follows: GOx (1 mg/mL, 200 μL), glucose of different concentrations (200 μL), and PBS (pH = 7.0, 400 μL) were incubated at 37 °C for 60 min. TMB (1.5 mM in ethanol, 400 μL), V2O5 nanozymes solution (50 μL), and NaOAc-HOAc buffer solution (pH = 4.0, 1750 μL) were added to the above glucose reaction solution. Then the concentrations of glucose were measured after the mixed solution incubated for 5 min vs. a blank containing only the substrate solution. For glucose detection in blood, the blood sample was firstly centrifuged at 12,000 rpm for 5 min. Then, the supernatant (200 μL) was diluted to 400 μL using PBS (pH = 7.0) before subsequent use. These diluted supernatants were then used with GOx for glucose detection as described above instead of glucose aqueous solution.
3. Results and Discussion
3.1. Characterization of V2O5 Nanozymes
The physical characterization data of the V2O5 nanozymes is shown in Figure 1. The FTIR spectrum can be seen in Figure 1a. The bands at about 1000 cm−1 come from bending vibrations of the V-O bridge bonds. The formation of orthorhombic V2O5 nanozymes is confirmed from the X-ray diffraction pattern (Figure 1b). Transmission electron microscopy (TEM) images indicate nanozymes of different sizes with lengths of ~500 nm (Figure 1c).
Figure 1.
Characterizations of V2O5 nanozymes: (a) FTIR spectrum; (b) XRD pattern; (c) TEM images.
3.2. Principle
In pH 4 NaOAc-HOAc buffer solutions at 25 °C, V2O5 nanozymes of 500 nm mean size catalyzed the oxidation of 3,3′,5,5′-tetramethylbenzidine (TMB) and o-phenylenediamine (OPD) enzyme substrates in the presence of H2O2 to produce blue and orange colors, respectively. With increased H2O2 increased concentration more TMB and OPD will be oxidized by more H2O2, so the absorbance intensity becomes stronger. The absorbance intensity shows a linear dependence on the concentration of H2O2 and related materials.
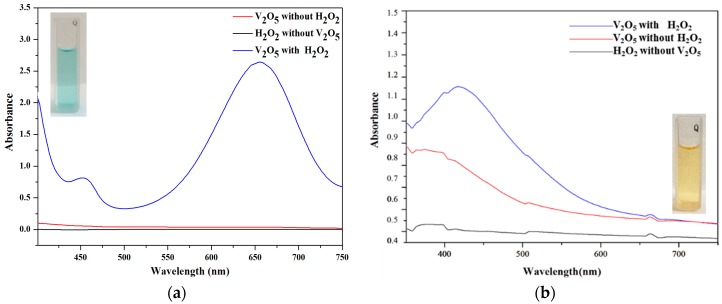
The UV/vis spectra are shown in Figure 2. It can be seen that substrate solutions in the presence of H2O2 or V2O5 exhibit no strong absorption, however, strong absorption peaks were found at 452 nm, 660 nm for TMB (Figure 2a), and 450 nm for OPD (Figure 2b) when the H2O2 and V2O5 were added into the system.
Figure 2.
The catalytic effect of V2O5 nanozymes with TMB (a) and OPD (b) as the substrate in the presence of H2O2.
3.3. Effect of pH
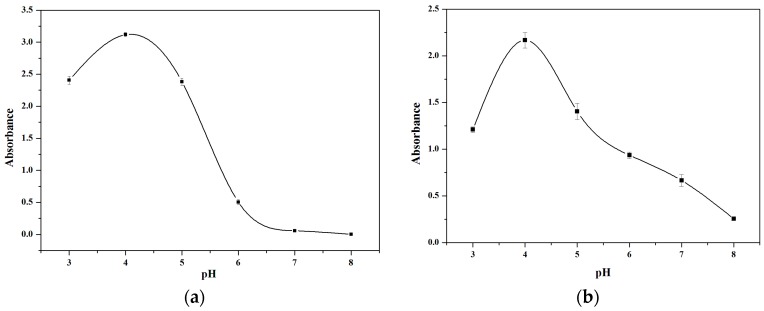
The effect of pH value (pH 3.0–8.0) on the OD660nm for TMB and OD450nm for OPD was studied, as shown in Figure 3a,b. Both the OD660nm for TMB and the OD450nm for OPD reached their maximum values when the pH value was 4.0. This optimum pH for the reaction of V2O5 nanozymes with TMB is consistent with the value reported in the literature [10]. Therefore, pH 4.0 was selected for H2O2 and glucose detection.
Figure 3.
Effects of pH with TMB (a) and OPD (b) substrate, respectively. The error bars represent the standard deviation of three measurements.
3.4. Effect of Buffers
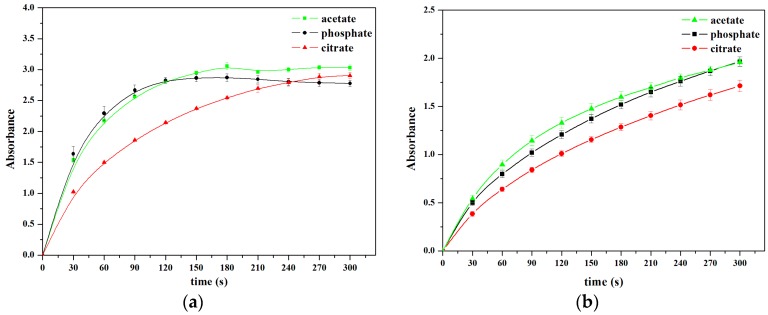
As shown in Figure 4, V2O5 nanozymes were incubated for as long as 300 s in pH 4.0, 0.2 M buffers, including acetate, phosphate, and citrate. The V2O5 nanozymes were more active in 0.2 M NaOAc-HOAc buffer solutions than in other buffers. Up to 300 s, the buffer order of peroxidase activity of V2O5 nanozymes is acetate > citrate > phosphate for the TMB substrate, whereas the order is acetate ≈ phosphate > citrate for the OPD substrate. Thus, the acetate buffer solution was taken as the optimal reaction solution for H2O2 and glucose determination.
Figure 4.
Activities of V2O5 nanozymes in, pH 4.0, 0.2 M buffers, with TMB (a) and OPD (b), respectively. The error bars represent the standard deviation of three measurements.
3.5. Effect of V2O5 Nanozymes Concentrations
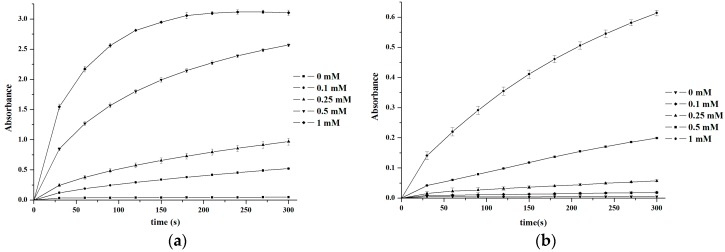
As shown in Figure 5, the OD660nm and OD450nm values of the system increased gradually with the concentration of V2O5 nanozymes. Then the system reached its maximum OD660 value when the concentration was 1 mM. Hence, 1 mM V2O5 nanozymes was chosen for the assay system.
Figure 5.
Effects of the V2O5 nanozymes concentrations ranging from 0 up to 1 mM in pH 4.0 NaOAc-HOAc buffer solution, with TMB (a) and OPD (b) respectively.
3.6. Calibration Curve for H2O2 Detection
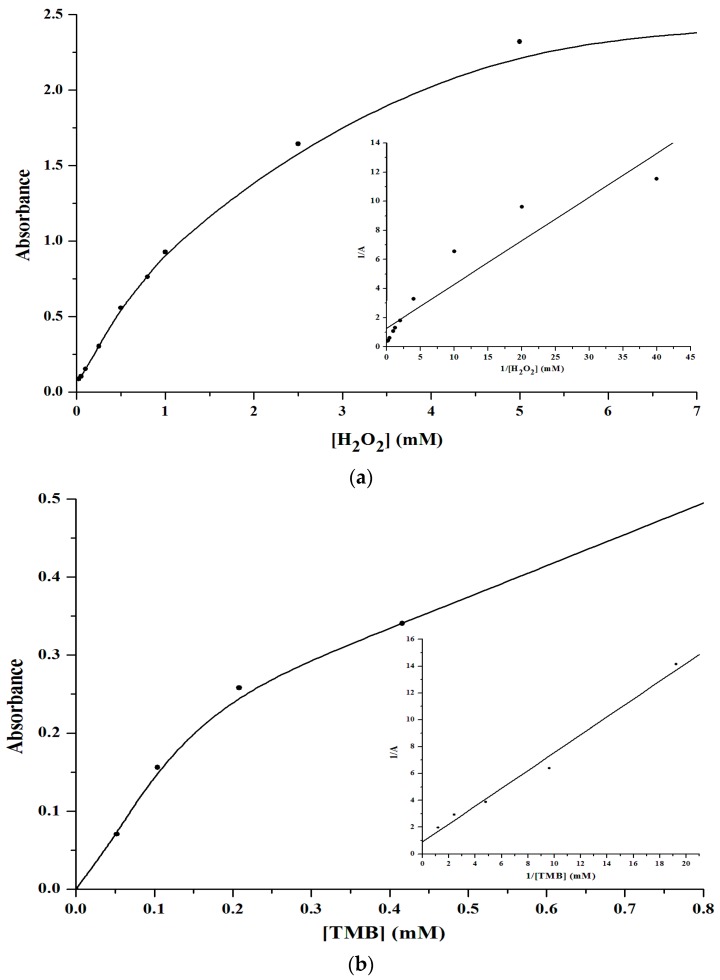
In a certain range of H2O2 concentrations, typical Michaelis-Menten curves (Figure 6) can be obtained for V2O5 nanozymes. KM and Vmax were obtained using a Lineweaver-Burk plot. A comparison of the kinetic parameters of V2O5 nanozymes, Fe3O4 magnetic nanoparticles (MNPs), and HRP is given in Table 1. The KM and Vmax of V2O5 nanozymes with TMB are 0.738 mM and 1.85 × 10⁻⁵ M·s−1, respectively. The KM and Vmax of V2O5 nanozymes with H2O2 are 0.232 mM and 1.29 × 10⁻⁵ M·s−1, respectively. The Kcat of V2O5 nanozymes with TMB and H2O2 are 18.46 s−1 and 12.91 s−1, respectively, and the Kcat/KM values of V2O5 nanozymes with TMB and H2O2 are 25.02 mM−1·s−1 and 55.55 mM−1·s−1, respectively. The KM values show that V2O5 nanozymes have higher affinity for hydrogen peroxide compared with HRP, but less affinity to TMB compared with HRP. The apparent Km value of V2O5 nanozymes with TMB as the substrate was higher than that for HRP, consistent with the observation that a higher TMB concentration was required to achieve the maximal activity for V2O5 nanozymes. The apparent KM value of V2O5 nanozymes with H2O2 as the substrate was significantly lower than HRP and Fe3O4 MNPs. From the Table data, it can be concluded that the V2O5 nanozymes have a higher activity than HRP and Fe3O4 MNPs.
Figure 6.
Steady-state kinetic assay and catalytic mechanism of V2O5 nanozymes as peroxidase mimic.
Table 1.
Comparison of the Km and Vmax of V2O5 nanozymes, Fe3O4 MNPs, and HRP.
| Nanozymes | Substrate | KM (mM) | Vmax (M·s−1) |
|---|---|---|---|
| V2O5 nanozymes | TMB | 0.738 | 1.85 × 10⁻⁵ |
| V2O5 nanozymes | H2O2 | 0.232 | 1.29 × 10⁻⁵ |
| Fe3O4 MNPs | TMB | 0.434 | 10.00 × 10⁻⁸ |
| Fe3O4 MNPs | H2O2 | 154 | 9.78 × 10⁻⁸ |
| HRP | TMB | 0.434 | 1.24 × 10⁻⁸ |
| HRP | H2O2 | 3.70 | 2.46 × 10⁻⁸ |
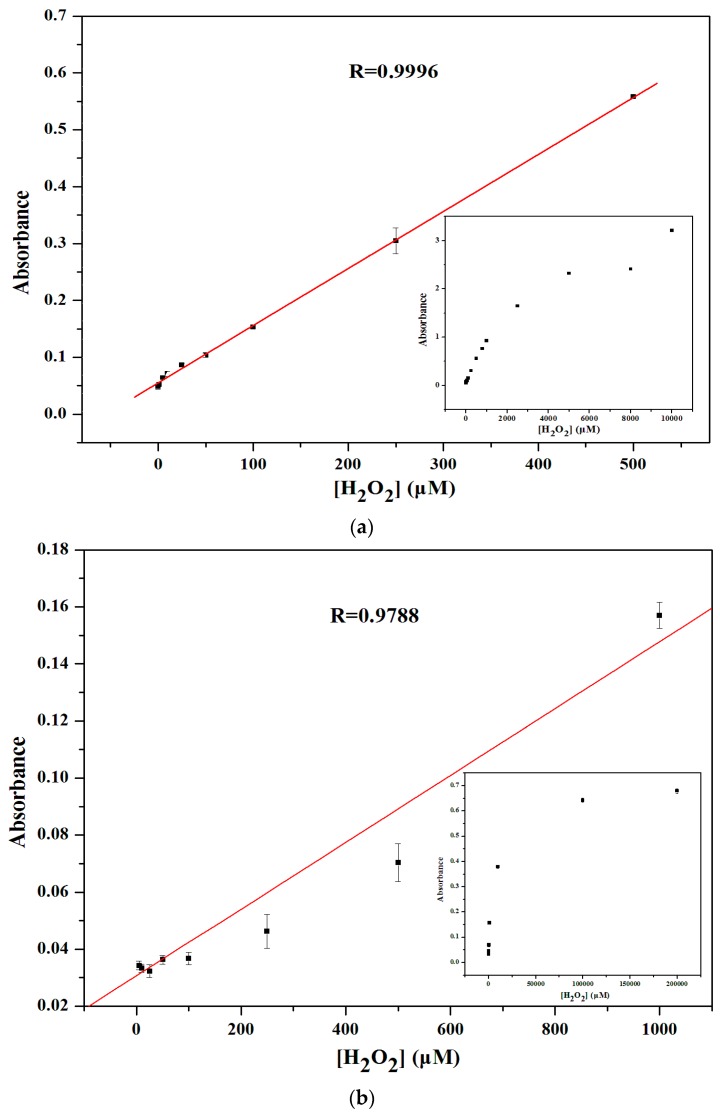
Under the optimized reaction conditions, calibration curves of H2O2 were plotted (Figure 7). The correlations of absorbance intensity with all H2O2 concentrations were obtained at 660 nm for TMB substrate and 450 nm for OPD substrate. There relationships between the absorbance intensities and the concentrations of H2O2 are linear over the range of 0–10 mM (TMB), and 0–0.2 M (OPD) with correlation coefficients 0.9996 (p < 0.05) and 0.9788 (p < 0.05), respectively. The results show that TMB as substrate exhibited a better response. It is supposed that the maximum absorbance peak of the oxidation of OPD is nearly equal to that of V2O5 nanozymes, so the absorbance peak of V2O5 interferes with the H2O2 sensing. The limit of detection (3σ, LOD) is 1 μM. In addition, the analytical performance of V2O5 nanozymes as peroxidase mimetics was compared with other nanozymes, as summarized in Table 2. By comparing with other nanozymes, it was revealed that the sensor has a wider linear range and higher sensitivity.
Figure 7.
Linear calibration plot for H2O2 from 1 to 500 μM in, pH 4.0, 0.2 M NaOAc-HOAc buffers, with TMB (a) and OPD (b) respectively (p < 0.05). The inset shows dependence of the absorbance on the concentration of H2O2.
Table 2.
Comparison of analytical performance for H2O2 detection of various nanozymes.
3.7. Calibration Curve for Glucose Detection
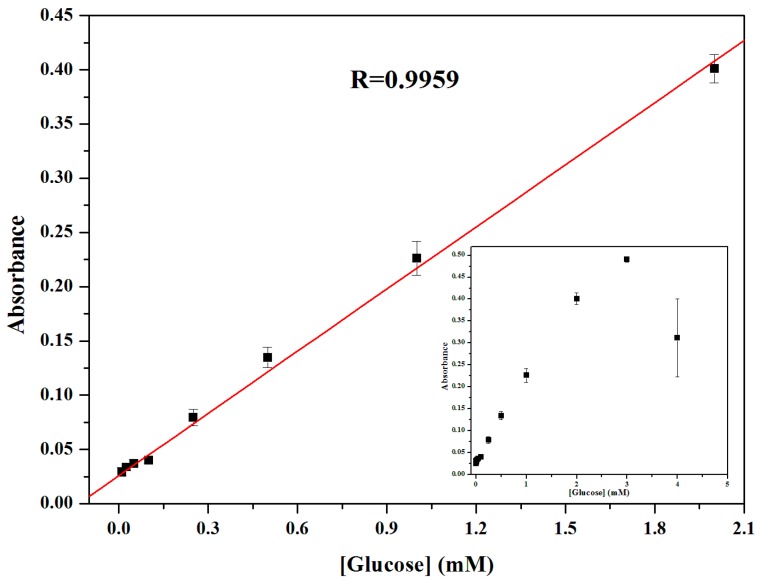
It is well known that glucose oxidase (GOx) catalyzes the oxidation of glucose to gluconolactone and this property has been developed for the fabrication of glucose sensors with high sensitivity and selectivity. Due to the fact that GOx would be denatured in pH 4.0 buffer, the glucose detection was performed in two separate steps as mentioned in the Methods section. The inset of Figure 8 shows the dependence of the absorbance at 660 nm on the concentration of glucose from 0 to 4 mM. The corresponding calibration plot was shown in Figure 8. The linear detection range is from 10 to 2000 μM with the correlation coefficients, 0.9959 (p < 0.05). The limit of detection (3σ, LOD) is 10 μM.
Figure 8.
Linear calibration plot for glucose from 10 to 2000 μM (p < 0.05). The inset shows dependence of the absorbance on the concentration of glucose in the range from 0 to 4 mM.
Using this method, glucose was detected in patients’ blood samples. According to the linear calibration curve, the concentration of glucose in the diabetic blood sample is 15.396 mM. The general range of random plasma glucose concentration in diabetic persons is more than 11.1 mM. Therefore, this colorimetric method is applicable to real samples to determine glucose concentration.
4. Conclusions
In summary, a new V2O5 nanozymes-based colorimetric assay has been developed for H2O2 and glucose detection. Under the optimal reaction conditions, the method showed good responses toward H2O2 with a linear range from 1 to 500 μM. The LOD value is 1 μM. Determination of glucose was achieved from 10 to 2000 μM with a LOD of 10 μM. The result shows that the proposed assay method for H2O2 and glucose based on V2O5 nanozymes has a wide linear range, and is simple, fast, and sensitive.
Acknowledgments
This work was financially supported by NSFC (81402719), Norman Bethune Program of Jilin University (2015228), and Young Scholars Program of Norman Bathune Health Science Center of Jilin University (2013202015).
Abbreviations
- GOx
glucose oxidase
- HRP
horseradish peroxidase
- OPD
o-phenylenediamine
- TMB
3,3′,5,5′-tetramethylbenzidine
- LOD
limit of detection
- Vmax
maximum initial velocity
- Km
Michaelis-Menten constant
Author Contributions
Yanfei Qi conceived and designed the experiments; Jiaheng Sun performed the experiments; Jiaheng Sun analyzed the data; Yanfei Qi contributed reagents/materials/analysis tools; Jiaheng Sun, Shuanli Guo, Chunyan Li, Xue Liang and Yanfei Qi wrote the paper.
Conflicts of Interest
The authors declare no conflict of interest. The funding sponsors had no role in the design of the study; in the collection, analyses, or interpretation of data; in the writing of the manuscript, and in the decision to publish the results.
References
- 1.Wei H., Wang E.K. Nanomaterials with enzyme-like characteristics (nanozymes): Next-generation artificial enzymes. Chem. Soc. Rev. 2013;42:6060–6093. doi: 10.1039/c3cs35486e. [DOI] [PubMed] [Google Scholar]
- 2.Gao L.Z., Zhuang J., Nie L., Zhang J.B., Zhang Y., Gu N., Wang T.H., Feng J., Yang D., Perrete S., et al. Intrinsic peroxidase-like activity of ferromagnetic nanoparticles. Nat. Nanotechnol. 2007;2:577–583. doi: 10.1038/nnano.2007.260. [DOI] [PubMed] [Google Scholar]
- 3.Perez J.M. Iron oxide nanoparticles: Hidden talent. Nat. Nanotechnol. 2007;2:535–536. doi: 10.1038/nnano.2007.282. [DOI] [PubMed] [Google Scholar]
- 4.Comotti M., Pina C.D., Matarrese R., Rossi M. The Catalytic Activity of “Naked” Gold Particles. Angew. Chem. Int. Ed. 2004;43:5812–5815. doi: 10.1002/anie.200460446. [DOI] [PubMed] [Google Scholar]
- 5.Pirmohamed T., Dowding J.M., Singh S., Wasserman B., Heckert E., Karakoti A.S., King J.E.S., Seal S., Self W.T. Nanoceria exhibit redox state-dependent catalase mimetic activity. Chem. Commun. 2010;46:2736–2738. doi: 10.1039/b922024k. [DOI] [PMC free article] [PubMed] [Google Scholar]
- 6.Mu J.S., Wang Y., Zhao M., Zhang L. Intrinsic peroxidase-like activity and catalase-like activity of Co3O4 nanoparticles. Chem. Commun. 2012;48:2540–2542. doi: 10.1039/c2cc17013b. [DOI] [PubMed] [Google Scholar]
- 7.Yin J.F., Cao H.Q., Lu Y.X. Self-assembly into magnetic Co3O4 complex nanostructures as peroxidase. J. Mater. Chem. 2012;22:527–534. doi: 10.1039/C1JM14253D. [DOI] [Google Scholar]
- 8.Chen W., Chen J., Feng Y.B., Hong L., Chen Q.Y., Wu L.F., Lin X.H., Xia X.H. Peroxidase-like activity of water-soluble cupric oxide nanoparticles and its analytical application for detection of hydrogen peroxide and glucose. Analyst. 2012;137:1706–1712. doi: 10.1039/c2an35072f. [DOI] [PubMed] [Google Scholar]
- 9.Wan Y., Qi P., Zhang D., Wu J.J., Wang Y. Manganese oxide nanowire-mediated enzyme-linked immunosorbent assay. Biosens. Bioelectron. 2012;33:69–74. doi: 10.1016/j.bios.2011.12.033. [DOI] [PubMed] [Google Scholar]
- 10.André R., Natálio F., Humanes M., Leppin J., Heinze K., Wever R., Schröder H.-C., Müller W.E.G., Tremel W. V2O5 Nanowires with an Intrinsic Peroxidase-Like Activity. Adv. Funct. Mater. 2011;21:501–509. doi: 10.1002/adfm.201001302. [DOI] [Google Scholar]
- 11.Shi W.B., Wang Q.L., Long Y.J., Cheng Z.L., Chen S.H., Zheng H.Z., Huang Y.M. Carbon nanodots as peroxidase mimetics and their applications to glucose detection. Chem. Commun. 2011;7:6695–6697. doi: 10.1039/c1cc11943e. [DOI] [PubMed] [Google Scholar]
- 12.Song Y.J., Qu K.G., Zhao C., Ren J.S., Qu X.G. Graphene Oxide: Intrinsic Peroxidase Catalytic Activity and Its Application to Glucose Detection. Adv. Mater. 2010;22:2206–2210. doi: 10.1002/adma.200903783. [DOI] [PubMed] [Google Scholar]
- 13.Wei H., Wang E. Fe3O4 magnetic nanoparticles as peroxidase mimetics and their applications in H2O2 and glucose detection. Anal. Chem. 2008;80:2250–2254. doi: 10.1021/ac702203f. [DOI] [PubMed] [Google Scholar]
- 14.Jv Y., Li B.X., Cao R. Positively-charged gold nanoparticles as peroxidiase mimic and their application in hydrogen peroxide and glucose detection. Chem. Commun. 2010;46:8017–8019. doi: 10.1039/c0cc02698k. [DOI] [PubMed] [Google Scholar]
- 15.Tao Y., Ju E.G., Ren J.S., Qu X.G. Polypyrrole nanoparticles as promising enzyme mimics for sensitive hydrogen peroxide detection. Chem. Commun. 2014;50:3030–3032. doi: 10.1039/c4cc00328d. [DOI] [PubMed] [Google Scholar]
- 16.Ludwig H.R., Cairelli S.G., Whalen J.J. Documentation for Immediately Dangerous to Life or Health Concentrations (IDLHs) National Institute for Occupational Safety and Health; Washington, DC, USA: 1994. [Google Scholar]
- 17.Nagaraja P., Shivakumar A., Shrestha A.K. Quantification of hydrogen peroxide and glucose using 3-methyl-2-benzothiazolinonehydrazone hydrochloride with 10,11-dihydro-5H-benz(b,f)azepine as chromogenic probe. Anal. Biochem. 2009;395:231–236. doi: 10.1016/j.ab.2009.07.053. [DOI] [PubMed] [Google Scholar]
- 18.Chang Q., Tang H.Q. Optical determination of glucose and hydrogen peroxide using a nanocomposite prepared from glucose oxidase and magnetite nanoparticles immobilized on graphene oxide. Microchim. Acta. 2014;181:527–534. doi: 10.1007/s00604-013-1145-x. [DOI] [Google Scholar]
- 19.Guilbault G.G., Brignac P.J., Zimmer M. Homovanillic acid as a fluorometric substrate for oxidative enzymes. Analytical applications of the peroxidase, glucose oxidase, and xanthine oxidase systems. Anal. Chem. 1968;40:190–196. doi: 10.1021/ac60257a002. [DOI] [PubMed] [Google Scholar]
- 20.Lan D., Li B.X., Zhang Z.J. Chemiluminescence flow biosensor for glucose based on gold nano particle-enhanced activities of glucose oxidase and horseradish peroxidase. Biosens. Bioelectron. 2008;24:934–938. doi: 10.1016/j.bios.2008.07.064. [DOI] [PubMed] [Google Scholar]
- 21.Chang Q., Zhu L.H., Jiang G.D., Tang H.Q. Sensitive fluorescent probes for determination of hydrogen peroxide and glucose based on enzyme-immobilized magnetite/silica nanoparticles. Anal. Bioanal. Chem. 2009;395:2277–2385. doi: 10.1007/s00216-009-3118-9. [DOI] [PubMed] [Google Scholar]
- 22.Fink D., Klinkovich I., Bukelman O., Marks R.S., Kiv A., Fuks D., Fahrner W.R., Alfonta L. Glucose determination using a re-usable enzyme-modified ion track membrane sensor. Biosens. Bioelectron. 2009;24:2702–2706. doi: 10.1016/j.bios.2008.12.001. [DOI] [PubMed] [Google Scholar]
- 23.Lin J.M., Arakawa H., Yamada M. Flow injection chemiluminescent determination of trace amounts of hydrogen peroxide in snow-water using KIO4–K2CO3 system. Anal. Chim. Acta. 1998;371:171–176. doi: 10.1016/S0003-2670(98)00304-3. [DOI] [Google Scholar]
- 24.Li Y.Z., Townshend A. Evaluation of the adsorptive immobilisation of horseradish peroxidase on PTFE tubing in flow systems for hydrogen peroxide determination using fluorescence detection. Anal. Chim. Acta. 1998;359:149–156. doi: 10.1016/S0003-2670(97)00710-1. [DOI] [Google Scholar]
- 25.Xu J.R., Chen Z.M. Determination of Peroxides in Environmental Samples by High Performance Liquid Chromatography. Chin. J. Chromatogr. 2005;23:366–369. [PubMed] [Google Scholar]
- 26.Wang C.H., Yang C., Song Y.Y., Gao W., Xia X.H. Adsorption and Direct Electron Transfer from Hemoglobin into a Three-Dimensionally Ordered Macroporous Gold Film. Adv. Funct. Mater. 2005;15:1267–1275. doi: 10.1002/adfm.200500048. [DOI] [Google Scholar]
- 27.Tarpey M.M., Wink D.A., Grisham M.B. Methods for detection of reactive metabolites of oxygen and nitrogen: In vitro and in vivo considerations. Am. J. Physiol. Regul. Integr. Comp. Physiol. 2004;286:R431–R444. doi: 10.1152/ajpregu.00361.2003. [DOI] [PubMed] [Google Scholar]
- 28.Ozalp V.C., Zeydanli U.S., Lunding A., Kavruk M., Oz M.T., Eyidogan F., Olsen L.F., Oktem H.A. Nanoparticle embedded enzymes for improved lateral flow sensors. Analyst. 2013;138:4255–4259. doi: 10.1039/c3an00733b. [DOI] [PubMed] [Google Scholar]
- 29.Shoji E., Freund M.S. Potentiometric sensors based on the inductive effect on the pK(a) of poly(aniline): A nonenzymatic glucose sensor. J. Am. Chem. Soc. 2001;123:3383–3384. doi: 10.1021/ja005906j. [DOI] [PubMed] [Google Scholar]
- 30.Zhou F., Zhao X.M., Yuan C.G., Li L. Vanadium Pentoxide Nanowires: Hydrothermal Synthesis, Formation Mechanism, and Phase Control Parameters. Cryst. Growth Des. 2008;8:723–727. doi: 10.1021/cg060816x. [DOI] [Google Scholar]
- 31.Liu S., Tian J.Q., Wang L., Zhang Y.W., Luo Y.L., Li H.Y., Asiri A.M., Al-Youbi A.O., Sun X. Fast and Sensitive Colorimetric Detection of H2O2 and Glucose: A Strategy Based on Polyoxometalate Clusters. Chempluschem. 2012;77:541–544. doi: 10.1002/cplu.201200051. [DOI] [Google Scholar]
- 32.Wang J.J., Han D.X., Wang X.H., Qi B., Zhao M.S. Polyoxometalates as peroxidase mimetics and their applications in H2O2 and glucose detection. Biosens. Bioelectron. 2012;36:18–21. doi: 10.1016/j.bios.2012.03.031. [DOI] [PubMed] [Google Scholar]
- 33.Kim M.I., Shim J., Li T., Lee J., Park H.G. Fabrication of Nanoporous Nanocomposites Entrapping Fe3O4 Magnetic Nanoparticles and Oxidases for Colorimetric Biosensing. Chem. Eur. J. 2011;17:10700–10707. doi: 10.1002/chem.201101191. [DOI] [PubMed] [Google Scholar]
- 34.Chen X., Zhou X.D., Hu J. Pt-DNA complexes as peroxidase mimetics and their applications in colorimetric detection of H2O2 and glucose. Anal. Methods. 2012;4:2183–2187. doi: 10.1039/c2ay25250c. [DOI] [Google Scholar]
- 35.Edgar P., Yona K. A Simple Colorimetric Method for the Measurement of Hydrogen Peroxide Produced by Cells in Culture. J. Immunol. Methods. 1980;38:161–170. doi: 10.1016/0022-1759(80)90340-3. [DOI] [PubMed] [Google Scholar]


