Abstract
CD8+ T cells have a central role in antitumour immunity, but their activity is suppressed in the tumour microenvironment1–4. Reactivating the cytotoxicity of CD8+ T cells is of great clinical interest in cancer immunotherapy. Here we report a new mechanism by which the antitumour response of mouse CD8+ T cells can be potentiated by modulating cholesterol metabolism. Inhibiting cholesterol esterification in T cells by genetic ablation or pharmacological inhibition of ACAT1, a key cholesterol esterification enzyme5, led to potentiated effector function and enhanced proliferation of CD8+ but not CD4+ T cells. This is due to the increase in the plasma membrane cholesterol level of CD8+ T cells, which causes enhanced T-cell receptor clustering and signalling as well as more efficient formation of the immunological synapse. ACAT1-deficient CD8+ T cells were better than wild-type CD8+ T cells at controlling melanoma growth and metastasis in mice. We used the ACAT inhibitor avasimibe, which was previously tested in clinical trials for treating atherosclerosis and showed a good human safety profile6,7, to treat melanoma in mice and observed a good antitumour effect. A combined therapy of avasimibe plus an anti-PD-1 antibody showed better efficacy than monotherapies in controlling tumour progression. ACAT1, an established target for atherosclerosis, is therefore also a potential target for cancer immunotherapy.
The importance of CD8+ T cells in antitumour immunity has been demonstrated in many types of cancer1,2. However, tumours can escape immune attack by various mechanisms of immunosuppression3,4. Reactivating the antitumour responses of T cells by checkpoint blockade has recently been demonstrated to have notable effects on treating cancer, but its response rate needs to be further improved8,9. It is therefore of great clinical interest to develop other therapies to potentiate the antitumour activity of CD8+ T cells by modulating different pathways. Previous studies have demonstrated that membrane lipids can directly regulate T-cell signalling and function10–16. Cholesterol is a key component of membrane lipids, and has been shown to be required for T-cell receptor (TCR) clustering and the formation of the T-cell immunological synapse13–15. Here we studied whether the antitumour response of CD8+ T cells can be potentiated by modulating cholesterol metabolism.
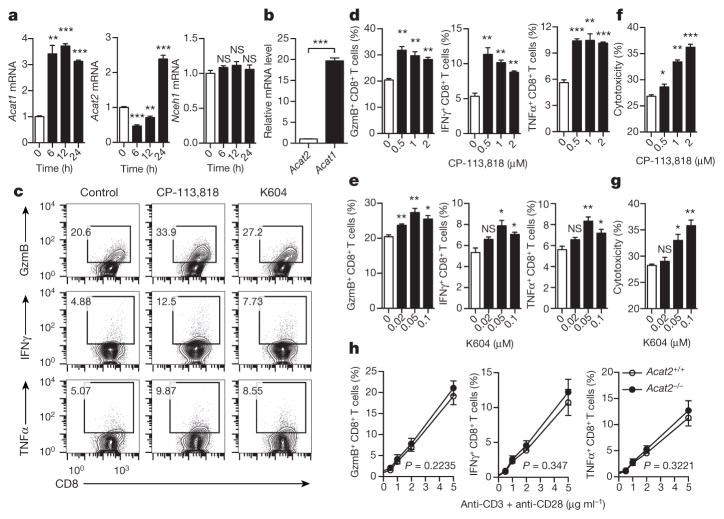
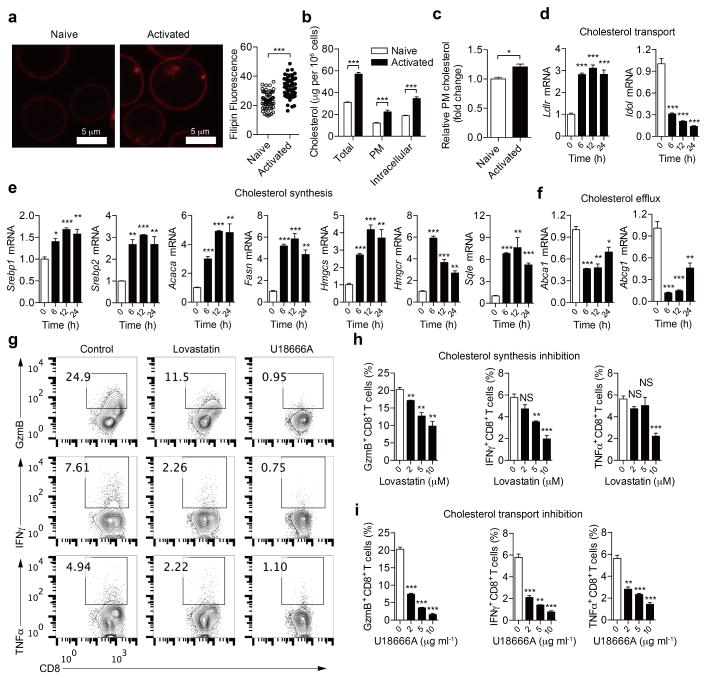
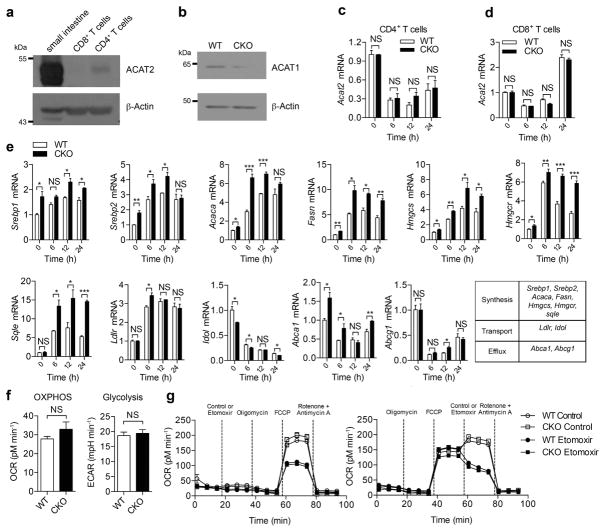
We first studied the reprogramming of cellular cholesterol metabolism of CD8+ T cells after activation. The cholesterol levels of both the whole cell and the plasma membrane were markedly increased in activated CD8+ T cells (Extended Data Fig. 1a–c). Consistently, the messenger RNA levels of key genes encoding proteins of cholesterol biosynthesis and transport pathways were upregulated, whereas those of the cholesterol efflux pathway were downregulated (Extended Data Fig. 1d–f). We also checked the mRNA levels of cholesterol esterification genes. Acat1 and Acat2 are two key genes encoding cholesterol esterification enzymes that convert free cholesterol to cholesteryl esters for storage. Acat1 is ubiquitously expressed while Acat2 is mainly expressed in liver and small intestine17. Upon CD8+ T-cell activation, Acat1 mRNA levels were significantly upregulated at early time points, whereas Acat2 mRNA levels first decreased and then increased at late time points (Fig. 1a). Inhibiting cholesterol esterification using the potent ACAT1/ACAT2 inhibitor CP-113,818 (ref. 18), or the less potent but specific ACAT1 inhibitor K604 (ref. 19), augmented the production of cytolytic granules and cytokines as well as the cytotoxicity of CD8+ T cells (Fig. 1c–g). By contrast, inhibiting cholesterol biosynthesis (using the HMG-CoA reductase inhibitor lovastatin20) or cholesterol transport (U18666A; ref. 21) significantly decreased granule and cytokine productions of CD8+ T cells (Extended Data Fig. 1g–i). The mRNA level of Acat1 was approximately 20 times that of Acat2 in CD8+ T cells (Fig. 1b). The protein level of ACAT2 in CD8+ T cells was nearly undetectable (Extended Data Fig. 2a). Genetic deletion of Acat2 did not change the effector function of CD8+ T cells (Fig. 1h). These data together supported the notion that ACAT1 is the major enzyme of cholesterol esterification in CD8+ T cells, and inhibiting its activity can significantly potentiate the effector function of the cells. Given its unique function in CD8+ T cells, we conditionally knocked out Acat1 in T cells to test whether the ACAT1 deficiency could lead to better antitumour immunity.
Figure 1. Inhibiting cholesterol esterification potentiates CD8+ T-cell effector function.
a, Transcriptional levels of cholesterol esterification genes Acat1, Acat2 and Nceh1 (cholesteryl ester hydrolase) in stimulated CD8+ T cells (n = 3). b, Relative transcriptional levels of Acat1 and Acat2 in naive CD8+ T cells (n = 3). c–e, Cytokine and cytolytic granule production of CD8+ T cells stimulated with 5 μg ml−1 plate-bound anti-CD3/CD28. The cells were pretreated with vehicle (dimethylsulfoxide, DMSO), CP-113,818 or K604 (n = 3). GzmB, granzyme B. f, g, Cytotoxicity of OT-I CTLs pretreated with CP-113,818 (f) or K604 (g) or vehicle (n = 3). Effector:target ratio = 1:1. h, Cytokine/granule production of antibody-stimulated wild-type (Acat2+/+) or Acat2 knockout (Acat2−/−) CD8+ T cells (n = 4). Data are representative of three (a–g) or four (h) independent experiments, and were analysed by unpaired t-test (a–g) or two-way analysis of variance (ANOVA) (h). Error bars denote s.e.m. *P < 0.05; **P < 0.01; ***P < 0.001. NS, not significant.
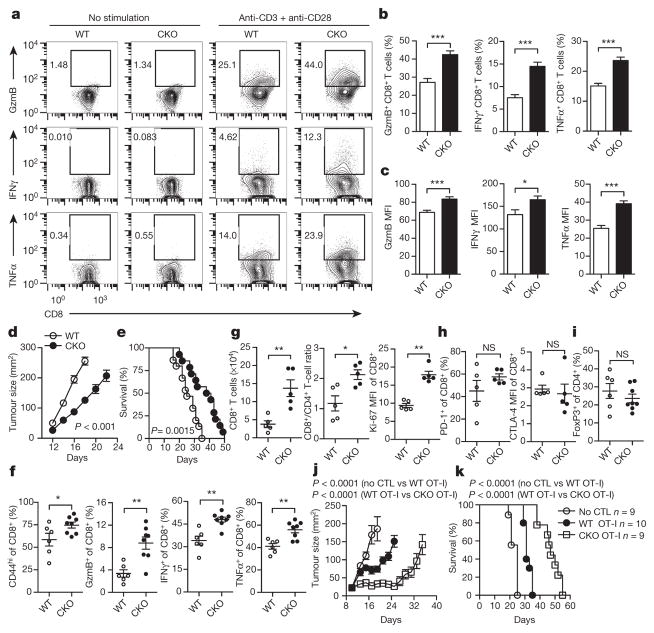
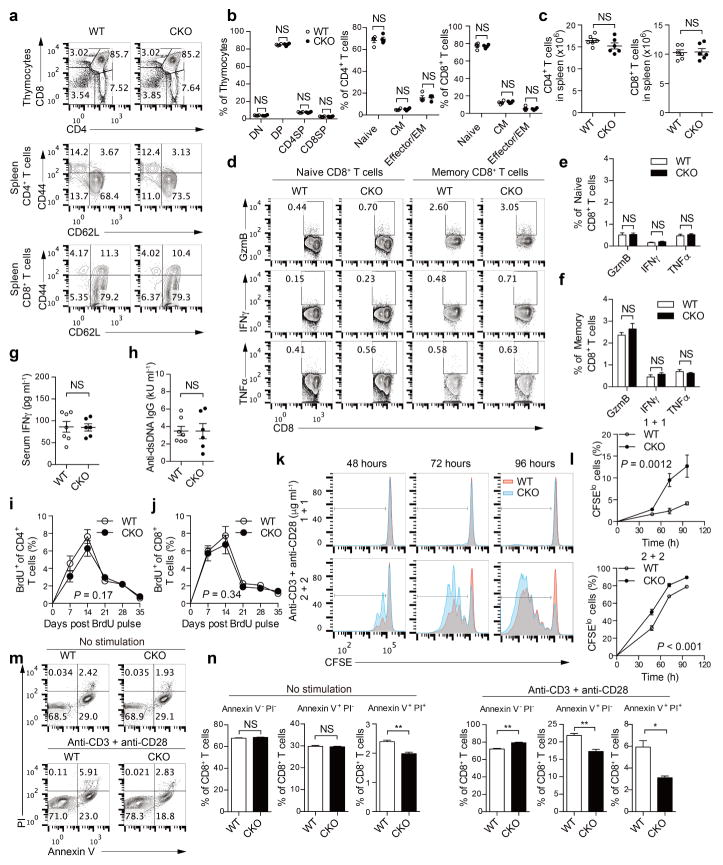
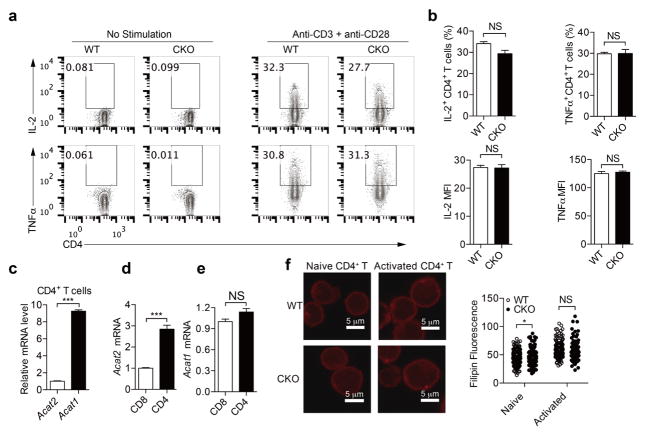
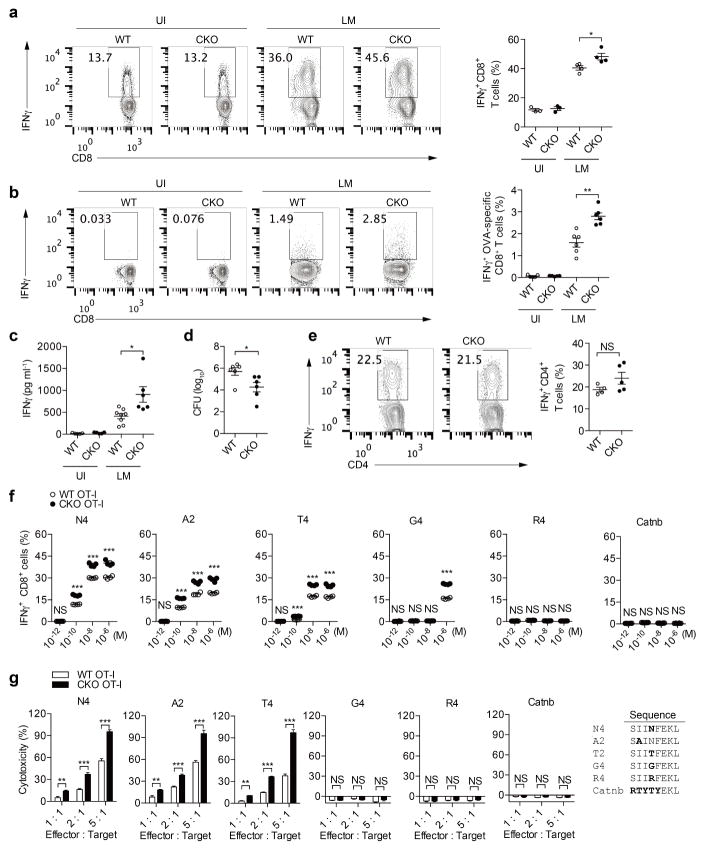
We crossed Acat1flox/flox mice with CD4cre mice to generate mice with T-cell-specific depletion of Acat1 (termed Acat1CKO mice) (Extended Data Fig. 2b). The transcriptional level of Acat2 in T cells was not changed in the Acat1CKO mice (Extended Data Fig. 2c, d). ACAT1 deficiency did not affect thymocyte development or peripheral T-cell homeostasis (Extended Data Fig. 3a–j). Most of the peripheral T cells were maintained as naive cells (CD62LhiCD44lo). The resting wild-type and Acat1CKO CD8 memory T cells showed comparable levels of cytokine production. Upon activation, the effector function of Acat1CKO CD8+ T cells was significantly enhanced as compared to wild-type CD8+ T cells (Fig. 2a–c). CD8+ T-cell proliferation and survival were also promoted by ACAT1 deficiency (Extended Data Fig. 3k–n). However, Acat1CKO CD4+ T cells had no significant enhancement of effector function (Extended Data Fig. 4a, b). This is probably due to the different metabolic programs of CD4+ and CD8+ T cells22. The mRNA and protein levels of Acat2 were higher in CD4+ than in CD8+ T cells (Extended Data Figs 2a and 4c–e), which might partially compensate for ACAT1 deficiency. To assess whether ACAT1 regulates the CD8+ T-cell immune response in vivo, we used Listeria monocytogenes to induce strong T-cell responses (Extended Data Fig. 5a–e). Acat1CKO mice had more IFNγ production of CD8+ T cells, higher serum IFNγ level and a reduced bacteria load. By contrast, the IFNγ productions of Acat1CKO and wild-type CD4+ T cells were comparable. We further tested the reactivity of Acat1CKO CD8+ T cell to different antigens (Extended Data Fig. 5f, g). Acat1CKO mice were crossed with OT-I TCR transgenic mice (named Acat1CKO OT-I mice). ACAT1 deficiency potentiated the effector function of Acat1CKO OT-I CD8+ T cells when stimulated with strong or weak antigens (OVA257–264 (N4), A2, T4 or G4), but did not result in reactivity to self-antigen Catnb or positive-selection-supporting antigen R4 (ref. 23). We also found that the serum anti-double-stranded DNA (anti-dsDNA) IgG and IFNγ levels of wild-type and Acat1CKO mice were comparable (Extended Data Fig. 3g, h), consistent with normal T-cell homeostasis (Extended Data Fig. 3) and organ size of Acat1CKO mice. These data suggest that ACAT1 deficiency might not cause autoimmunity.
Figure 2. ACAT1 deficiency potentiates the antitumour activity of CD8+ T cells.
a–c, Cytokine/granule productions of antibody-stimulated wild-type (WT) and Acat1CKO (CKO) CD8+ T cells (n = 8). d, e, Survival (e) and tumour growth (d) in wild-type and CKO mice after B16F10 melanoma inoculation (d, WT, n = 9; CKO, n = 8; e, WT, n = 15; CKO, n = 14). Source Data relating to tumour growth is available online. f, g, Phenotypic analysis of tumour-infiltrating T cells at day 16 after melanoma inoculation (f, WT, n = 6, CKO, n = 8; g, n = 5). MFI, median fluorescence intensity. h, i, PD-1 and CTLA-4 surface levels of tumour-infiltrating CD8+ T cells (n = 5) ( h) and Treg (CD4+ FoxP3+) cell percentage of tumour-infiltrating CD4+ T cells (WT, n = 6, CKO, n = 8) ( i). j, k, Survival and tumour sizes of B16F10-OVA tumour-bearing mice after adoptive transfer of wild-type or CKO OT-I CTLs. Data are representative of two (g, h), three (d–f) or five (a–c) independent experiments, and were analysed by Mann–Whiney test (b, c, f–i), log-rank (Mantel–Cox) test (e, k), or two-way ANOVA (d, j). Error bars denote s.e.m. *P < 0.05; **P < 0.01; ***P < 0.001.
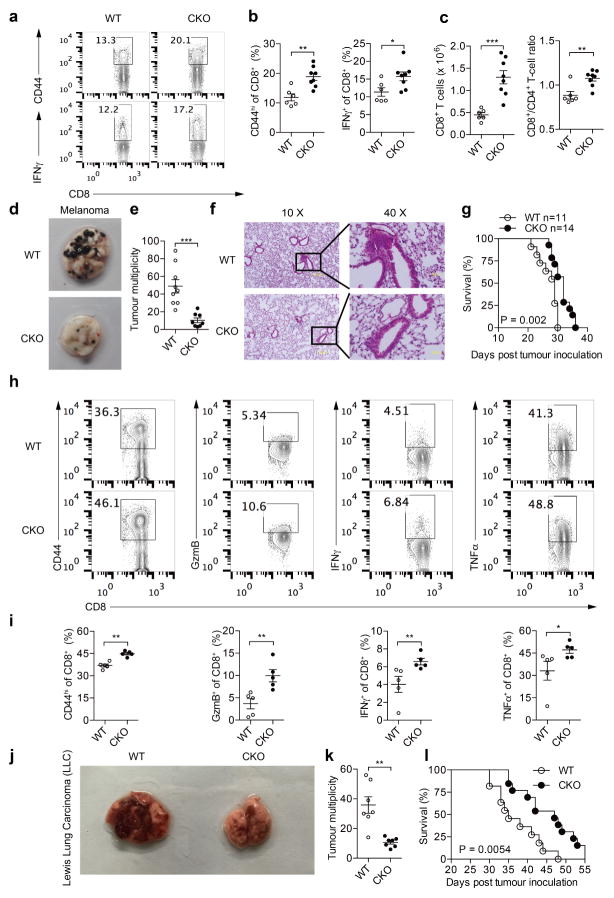
A skin melanoma model and a lung metastasis melanoma model were used to study the activity of Acat1CKO CD8+ T cells in controlling tumour progression and metastasis. In the skin model, Acat1CKO mice had a smaller tumour size and longer survival time (Fig. 2d, e). In the early stage of tumour progression (7 days after B16F10 melanoma inoculation), we analysed T-cell activation in draining lymph nodes. In Acat1CKO mice, CD8+ T cells showed stronger activation phenotypes with higher CD44 levels and more IFNγ production. The CD8+ T-cell number and CD8+/CD4+ T-cell ratio were also significantly increased (Extended Data Fig. 6a–c). In the advanced tumour stage (16 days after inoculation), we analysed the tumour-infiltrating T cells and found that CD8+ T cells had better activity, increased cell numbers, and higher Ki-67 levels. The CD8+/CD4+ T-cell ratio also increased (Fig. 2f, g). Notably, PD-1 and CTLA-4 levels of CD8+ T cells and the proportion of regulatory T (Treg) cells (CD4+FoxP3+) were not affected by ACAT1 deficiency (Fig. 2h, i). In the lung metastasis model, the Acat1CKO mice developed fewer lung tumours and experienced longer survival times (Extended Data Fig. 6d–g). The lung-infiltrating CD8+ T cells of the Acat1CKO mice had higher activity than those of wild-type mice (Extended Data Fig. 6h, i). Besides melanoma, ACAT1 deficiency also significantly attenuated the tumour progression in the Lewis lung carcinoma model (Extended Data Fig. 6j–l). To confirm the intrinsic role of ACAT1 in CD8+ T-cell function further, we did an adoptive T-cell transfer therapy for melanoma. Compared with wild-type, the transferred Acat1CKO OT-I cytotoxic T lymphocytes (CTLs) showed stronger antitumour activity, evidenced by smaller tumour size and a longer survival time of recipient mice (Fig. 2j, k).
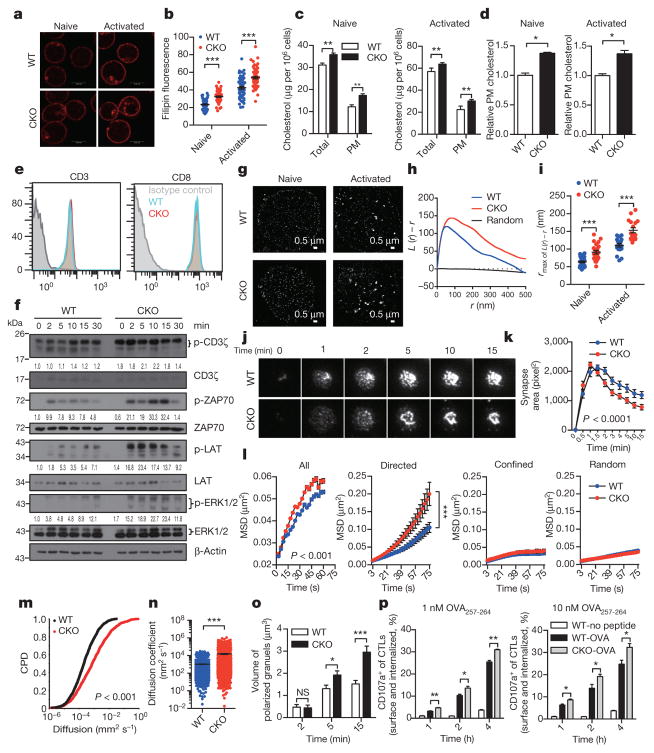
Next, we sought to determine the underlying mechanism for the potentiated effector function and enhanced proliferation of ACAT1-deficient CD8+ T cells. The plasma membrane cholesterol level of Acat1CKO CD8+ T cells was substantially higher than that of wild-type T cells (Fig. 3a–d). By contrast, the plasma membrane cholesterol levels of CD4+ T cells were comparable between Acat1CKO and wild-type mice (Extended Data Fig. 4f). This intriguing difference suggests that the increase in the plasma membrane cholesterol level may be an important cause for the augmented function of ACAT1-deficient CD8+ T cells. As cholesterol is required for TCR clustering13,14, we tested whether a higher plasma membrane cholesterol level could lead to stronger TCR signalling, a major signal responsible for T-cell activation and proliferation. Indeed, TCR signalling of Acat1CKO CD8+ T cells was largely enhanced compared with wild type, whereas the surface levels of TCR and CD8 of naive Acat1CKO CD8+ T cells were not increased (Fig. 3e, f). Using super-resolution imaging, we found that TCR microclusters of both naive and activated Acat1CKO CD8+ T cells were significantly larger than those of wild-type cells (Fig. 3g–i), which can enhance the avidity but not the affinity of TCRs to tumour antigens and lead to the formation of a bigger TCR signallosome24. We also studied the immunological synapse formation of Acat1CKO CD8+ T cells because cholesterol is a key synapse component15. The immunological synapse is crucial for polarized secretion of CD8+ T-cell cytolytic granules to kill target cells but not bystander cells25. Using live-cell imaging, we found that ACAT1 deficiency led to faster directed movement of TCR microclusters towards the centre of the synapse (Fig. 3j–n). The mature immunological synapse of Acat1CKO CD8+ T cells had a more compact structure, formed at a faster rate (Fig. 3j, k and Supplementary Video 1). Consequently, the cytolytic granule polarization and degranulation level were augmented in Acat1CKO CD8+ T cells (Fig. 3o, p). Therefore, the more efficient establishment of a mature immunological synapse helps to explain the more potent killing capability of the ACAT1-deficient CD8+ T cells25.
Figure 3. Plasma membrane cholesterol modulates TCR clustering and immunological synapse formation.
a–d, Cholesterol quantification of naive and activated CD8+ T cells by filipin III staining (a, b), oxidation-based method (c) or biotinylation-based method (d) (a, b, n = 60; c, d, n = 4). PM, plasma membrane. e, CD3 and CD8 surface levels of naive wild-type and CKO CD8+ T cells. f, TCR signalling of naive CD8+ T cells stimulated with 4 μg ml−1 anti-CD3/CD28. See Supplementary Fig. 1 for gel source data. g–i, STORM analysis of TCR clustering in naive and activated CD8+ T cells. g, Representative images. h, Ripley’s K-function analysis of TCR molecules. r, radius. i, The r value at the maximal L(r) − r value of Ripley’s K-function curves (naive, WT, n = 29, CKO, n = 22; activated, WT, n = 19, CKO, n = 17). j, k, Total internal reflection fluorescence microscopy (TIRFM) analysis of immunological synapse of CD8+ T cells on stimulatory planar lipid bilayer. j, Representative images. k, Immunological synapse area (n = 13 cells). l–n, Parameters of TCR microcluster movements of CD8+ T cells. l, Mean square displacements (MSD). TCR microcluster movements were split into directed, confined and random movements. m, Cumulative probability distribution (CPD). n, Mean scattered plots of diffusion coefficient. TCR microclusters were from 19 WT and 20 CKO cells. o, p, Cytolytic granule polarization (o, n = 50) and degranulation (p, n = 3) of OT-I CTLs. Data are representative of two (a–c, j–n, p) or three (f–i, o) independent experiments, and were analysed by unpaired t-test (c, d, p), Mann–Whitney test (b, i, n, o), two-way ANOVA (k, l) or Kolmogorov–Smirnov test (m). Error bars denote s.e.m. *P < 0.05; **P < 0.01; ***P < 0.001.
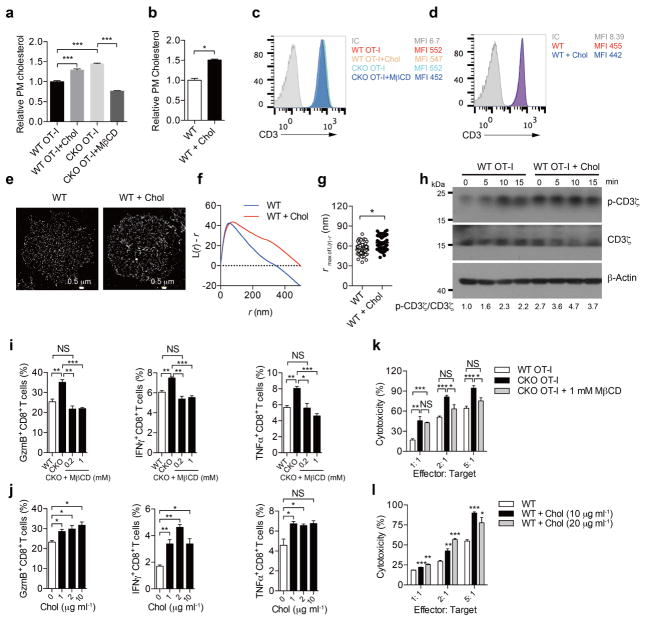
To study why the plasma membrane cholesterol level of Acat1CKO CD8+ T cells was raised, we checked the transcriptional level of cholesterol metabolism genes. ACAT1 deficiency led to higher mRNA levels of cholesterol biosynthesis genes in both naive and activated CD8+ T cells, whereas the mRNA levels of cholesterol transport and efflux genes underwent modest changes (Extended Data Fig. 2e). ACAT1 deficiency therefore not only caused less conversion of free cholesterol to cholesteryl esters, but might also cause more cholesterol biosynthesis, which could result in the higher cholesterol level5. To demonstrate that the higher cholesterol level of Acat1CKO CD8+ T cells is the cause of the potentiated effector function, we performed membrane cholesterol modulation experiments. Depletion of plasma membrane cholesterol using methyl-β-cyclodextrin (MβCD) led to impaired effector function of CD8+ T cells. The addition of plasma membrane cholesterol using MβCD-coated cholesterol led to potentiated effector function. Notably, MβCD-coated cholesterol treatment did not change the TCR surface level but significantly enhanced TCR clustering and signalling (Extended Data Fig. 7). These data further highlight the importance of the plasma membrane cholesterol level increase in the gain-of-function phenotype of Acat1CKO CD8+ T cells.
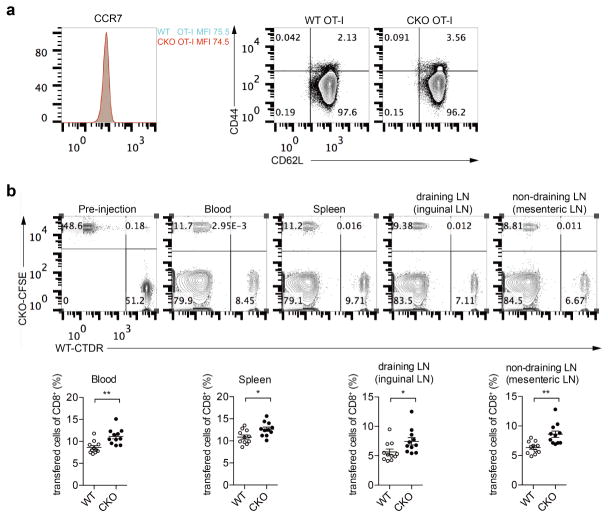
We further studied whether ACAT1 deficiency affected energy metabolism. The glycolysis, oxidation phosphorylation and fatty acid oxidation levels of naive Acat1CKO and wild-type CD8+ T cells were comparable (Extended Data Fig. 2f, g). We also studied the homing of Acat1CKO CD8+ T cells to secondary lymphoid organs (Extended Data Fig. 8). The surface expression levels of homing receptor CCR7 and CD62L were comparable between naive wild-type and Acat1CKO CD8+ T cells. After an injection of mixed wild-type and Acat1CKO CD8+ T cells into melanoma-bearing mice, Acat1CKO cells had a slightly higher ratio in blood and secondary lymphoid organs, which was probably due to the better survival of Acat1CKO cells (Extended Data Fig. 3m, n). In addition, we did not observe that Acat1CKO cells had enhanced homing to tumour-draining lymph nodes compared with non-draining lymph nodes.
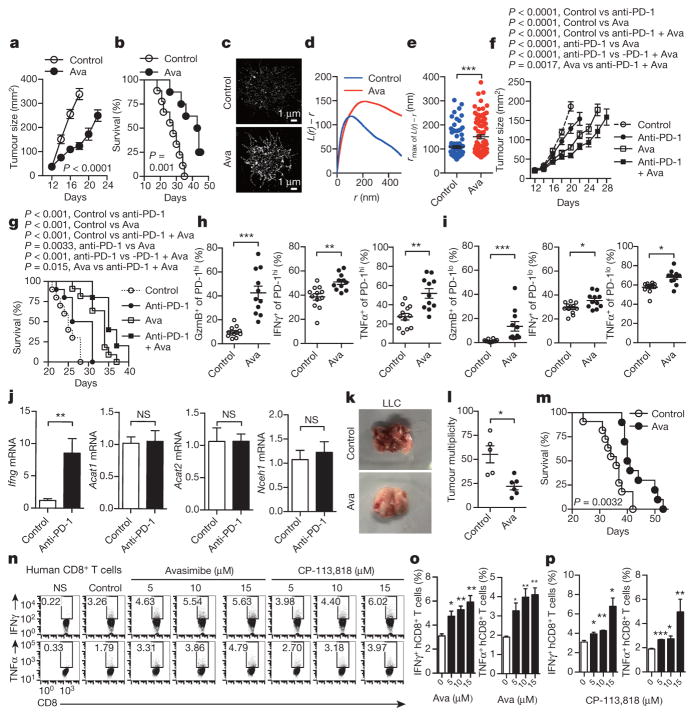
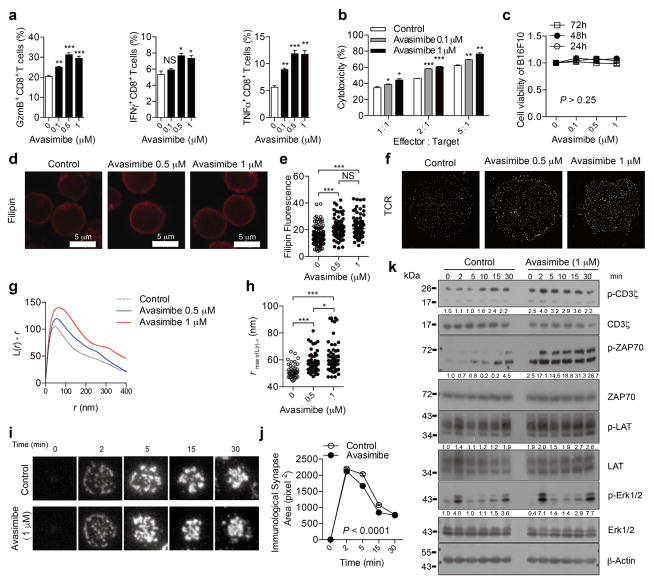
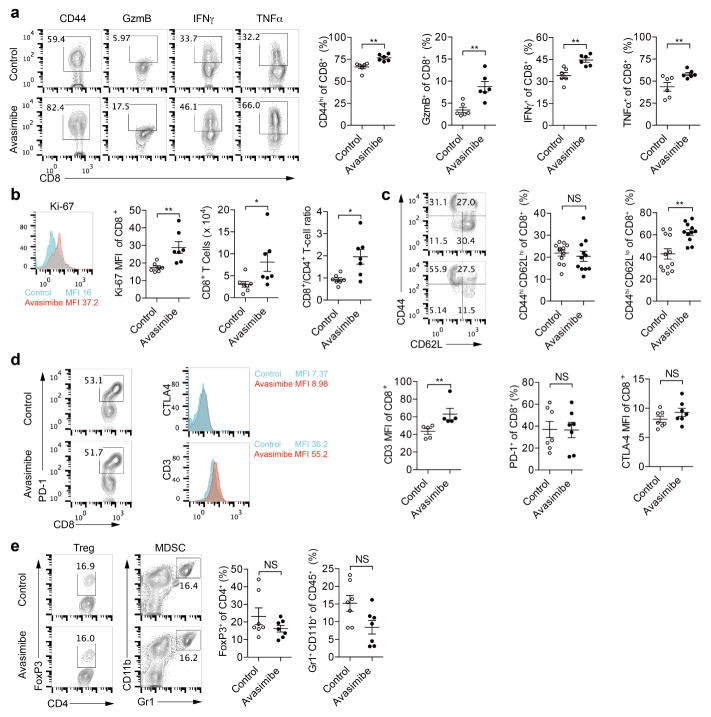
Finally, we tested the potential application of ACAT1 as a drug target for cancer immunotherapy. Avasimibe, an ACAT inhibitor with a good safety profile in humans, was used previously to treat atherosclerosis in clinical trials and in animal models of Alzheimer disease6,7,26. Like other ACAT1 inhibitors (Fig. 1d–g), avasimibe can enhance the effector function of mouse CD8+ T cells ex vivo (Extended Data Fig. 9a, b). Of note, avasimibe treatment did not change melanoma cell viability (Extended Data Fig. 9c). The plasma membrane cholesterol level of avasimibe-treated CD8+ T cells was substantially increased (Extended Data Fig. 9d, e). Consequently, TCR clustering and signalling as well as immunological synapse formation were significantly augmented (Extended Data Fig. 9f–k). We treated melanoma-bearing mice with avasimibe via multiple intraperitoneal injections. The phenotypes of avasimibe-treated mice were consistent with those of Acat1CKO mice. Tumour growth was inhibited and survival time was prolonged (Fig. 4a, b). The number of tumour-infiltrating CD8+ T cells in avasimibe-treated mice increased, and these cells showed potentiated effector function and enhanced proliferation (Extended Data Fig. 10a, b). The population of effector/effector memory CD8+ T cells was substantially increased after avasimibe treatment, whereas the population of central memory cells remained unchanged (Extended Data Fig. 10c). The checkpoint receptor surface levels of tumour-infiltrating CD8+ T cells were not affected by avasimibe treatment, while the TCR surface level was increased (Extended Data Fig. 10d). Treg and myeloid-derived suppressor cell populations in the tumour microenvironement were not changed (Extended Data Fig. 10e). Moreover, TCR clustering was significantly enhanced (Fig. 4c–e). We further tested a combined therapy of avasimibe and anti-PD-1 antibody. The combined therapy had a better efficacy than monotherapies in inhibiting tumour progression and in increasing survival (Fig. 4f, g). Avasimibe monotherapy potentiated the effector function of both PD-1hi and PD-1lo CD8+ T cells in the tumour microenvironment (Fig. 4h, i). The monotherapy of anti-PD-1 clearly increased the IFNγ production of tumour-infiltrating CD8+ T cells, but did not alter the transcriptional levels of Acat1 and other cholesterol esterification genes (Fig. 4j). These data show that avasimibe and anti-PD-1 act through different pathways and have additive effects in cancer immunotherapy. Besides melanoma, avasimibe also showed good antitumour effect in the Lewis lung carcinoma model (Fig. 4k–m). Moreover, we found that avasimibe can enhance the cytokine production of human CD8+ T cells (Fig. 4n–p).
Figure 4. Cancer immunotherapies in mice with the ACAT inhibitor avasimibe.
a, b, Melanoma-bearing mice were treated with avasimibe (Ava) or DMSO control (5 times) (control, n = 9; avasimibe, n = 8). c–e, STORM analysis of TCR clustering of tumour-infiltrating CD8+ T cells. c, Representative images. d, Ripley’s K-function analysis of TCR molecules. e, The r value at the maximal L(r) − r value of Ripley’s K-function curves (control, n = 100; avasimibe, n = 85). f, g, A combined therapy (avasimibe and anti-PD-1) or monotherapies (avasimibe or anti-PD-1) in treating melanoma (n = 10). Avasimibe, 5 times; anti-PD-1, 4 times. h, i, Cytokine/granule productions of PD-1hi and PD-1lo tumour-infiltrating CD8+ T cells (control, n = 12; avasimibe, n = 11). j, The effect of anti-PD-1 on the cholesterol esterification pathway. Melanoma-bearing mice were treated with anti-PD-1, and transcriptional levels of Acat1, Acat2, Nceh1 and Ifng in tumour-infiltrating CD8+ T cells were measured (n = 5). k–m, Lewis lung carcinoma-bearing mice were treated with avasimibe or DMSO control (8 times). l, Tumour multiplicity on day 35 (control, n = 5; avasimibe, n = 6). m, Survival (control, n = 11; avasimibe, n = 10). n–p, Cytokine productions of stimulated human (h) CD8+ T cells pretreated with avasimibe, CP-113,818 or DMSO (n = 3). Data are representative of two (f, g, n–p) or three (a, b, j) independent experiments, and were analysed by log-rank (Mantel–Cox) test (b, g, m), two-way ANOVA (a, before day 18; f, before day 20), Mann–Whitney test (e, h–j, l), or unpaired t-test (o, p). Error bars denote s.e.m. *P < 0.05; **P < 0.01; ***P < 0.001.
This study presents a new concept of cancer immunotherapy through the modulation of T-cell cholesterol metabolism. Activated CD8+ T cells reprogram the cholesterol metabolism and synthesize more free cholesterol to support rapid cell proliferation16. We show here that inhibiting activity of the key cholesterol esterification enzyme ACAT1 can upregulate the plasma membrane cholesterol level of CD8+ T cells. This leads to enhanced TCR clustering and signalling as well as more efficient formation of the immunological synapse. Consequently, the production of cytokines and cytolytic granules, and killing and proliferation of ACAT1-deficient CD8+ T cells are all significantly enhanced. Inhibiting ACAT1 has been demonstrated to offer benefits in treating cardiovascular and neurodegenerative diseases6,7,26, and we show that it can offer an additional benefit in treating cancer. ACAT1 inhibition can be used to complement current therapies such as immune checkpoint blockade3,4,8,27–30 because it acts through a different mechanism.
METHODS
Reagents and mice
Filipin III was from Sigma. Amplex Red cholesterol assay kit was from Invitrogen. IL-2 was from Promega. For the flow cytometric analysis, anti-mCD4 (RM4-5), anti-mCD8 (53-6.7), anti-mCD3ε (145-2C11), anti-IFNγ (XMG1.2), anti-TNFα (MP6-XT22), anti-granzyme B (NGZB), anti-CD44 (IM7), anti-CD69 (H1.2F3), anti-PD-1 (J43), anti-CTLA-4 (UC10-4B9), anti-Ki-67 (16A8), anti-FoxP3 (FJK-16 s), anti-Gr1 (RB6-8C5), anti-CD11b (M1/70) and anti-CD45 (30-F11) were purchased from eBioscience. For western blots, anti-pCD3ζ, anti-CD3ζ, anti-pZAP70, anti-ZAP70, anti-pLAT, anti-LAT, anti-pERK1/2 and anti-ERK1/2 were from Cell Signaling Technology. Avasimibe was from Selleck. MβCD-cholesterol and MβCD were from Sigma. Lovastatin was from Sigma. U18666A was from Merck. K604 was chemically synthesized in F.-J. Nan’s laboratory. CP113,818 was a research gift from P. Fabre. MTS (3-(4,5-dimethylthi-azol-2-yl)-5-(3-carboxymethoxyphenyl)-2-(4-sulfophenyl)-2H-tetrazolium) was from Promega. B16F10, Lewis lung carcinoma and EL-4 cell lines were originally obtained from the American Type Culture Collection, and proved mycoplasma-free. Listeria monocytogenes was provided by Q. Leng.
C57BL/6 mice were purchased from SLAC. OT-I TCR transgenic mice were from the Jackson Laboratory. CD4cre transgenic mice was described previously31. InGeneious Labs produced homozygous Acat1flox/flox mouse. To produce this mouse, the Acat1 loxP construct was made by inserting two loxP sites covering Acat1 exon 14, which includes His460 known to be essential for the enzymatic activity32. The construct was injected into embryonic stem cells. The correctly targeted clones as determined by Southern blot and diagnostic PCR were injected into C57BL/6 blastocysts. To remove the Neo marker, the mice were further back-crossed to the C57BL/6 Frt mice. Through mouse crossing, the wild-type Acat1 allele (Acat1+/+), heterozygous Acat1 loxP allele (Acat1flox/+) and homozygous Acat1 loxP allele (Acat1flox/flox) were obtained and confirmed by using diagnostic PCR. Acat1flox/flox mice were crossed with CD4cre transgenic mice to get Acat1CKO mice with ACAT1 deficiency in T cells. Acat1CKO mice were further crossed with OT-I TCR transgenic mice to get Acat1CKO OT-I mice. Animal experiments using Acat1CKO mice were controlled by their littermates with normal ACAT1 expression (Acat1flox/flox). Animal experiments using Acat1CKO OT-I mice were controlled by their littermate with normal ACAT1 and OT-I TCR expression (Acat1flox/flox OT-I). Acat2−/− mice were purchased from Jackson Laboratory. All mice were maintained in pathogen-free facilities at the Institute of Biochemistry and Cell Biology. All animal experiments used mice with matched age and sex. Animals were randomly allocated to experimental groups. The animal experiments performed with a blinded manner were described below. All animal experiments were approved by the Institutional Animal Care and Use Committee (IACUC) of Institute of Biochemistry and Cell Biology, Shanghai Institutes for Biological Sciences, Chinese Academy of Sciences. The maximal tumour measurements/volumes are in accordance with the IACUC. All human studies have been approved by the Research Ethical Committee from ChangZheng Hospital, Shanghai, China. Informed consent was obtained from all study subjects.
Quantitative reverse transcription PCR
Total RNA was extracted with Trizol (Life technology) from the indicated cells and subjected to quantitative reverse transcription PCR (qRT–PCR) using gene specific primers (5′–3′): Acat1 (forward, GAAACCGGCTGTCAAAATCTGG; reverse, TGTGACCATTTCTGTATGTGTCC); Acat2 (forward, ACAAGACAGACCTCTTCCCTC; reverse, ATGGTTCGGAAATGTTCACC); Nceh (forward, TTGAATACAGGCTAGTCCCACA; reverse, CAACGTAGGTAAACTGTTGTCCC); Srebp1 (forward, GCAGCCACCATCTAGCCTG; reverse, CAGCAGTGAGTCTGCCTTGAT); Srebp2 (forward, GCAGCAACGGGACCATTCT; reverse, CCCCATGACTAAGTCCTTCAACT); Acaca (forward, ATGGGCGGAATGGTCTCTTTC; reverse, TGGGGACCTTGTCTTCATCAT); Fasn (forward, GGAGGTGGTGATAGCCGGTAT; reverse, TGGGTAATCCATAGAGCCCAG); Hmgcs (forward, AACTGGTGCAGAAATCTCTAGC; reverse, GGTTGAATAGCTCAGAACTAGCC); Hmgcr (forward, AGCTTGCCCGAATTGTATGTG; reverse, TCTGTTGTGAACCATGTGACTTC); Sqle (forward, ATAAGAAATGCGGGGATGTCAC; reverse, ATATCCGAGAAGGCAGCGAAC); Ldlr (forward, TGACTCAGACGAACAAGGCTG, reverse, ATCTAGGCAATCTCGGTCTCC); Idol (forward, TGCAGGCGTCTAGGGATCAT; reverse, GTTTAAGGCGGTAAGGTGCCA); Abca1 (forward, AAAACCGCAGACATCCTTCAG; reverse, CATACCGAAACTCGTTCACCC); Abcg1 (forward, CTTTCCTACTCTGTACCCGAGG; reverse, CGGGGCATTCCATTGATAAGG); Ifng (forward, ATGAACGCTACACACTGCATC; reverse, CCATCCTTTTGCCAGTTCCTC).
Measurement of the cholesterol level of T cells
Three methods were used to measure the cholesterol level of T cells.
Filipin III staining
Filipin III was dissolved in ethanol to reach the final concentration of 5 mg ml−1. Cells were fixed with 4% paraformaldehyde (PFA) and stained with 50 μg ml−1 filipin III for 30 min at 4 °C. Images were collected using a Leica SP8 confocal microscope and analysed using a Leica LAS AF software.
Plasma membrane cholesterol oxidation-based assay
The total cellular cholesterol level was quantified using the Amplex Red cholesterol assay kit (Invitrogen). To quantify the intracellular cholesterol, CD8+ T cells were fixed with 0.1% glutaraldehyde and then treated with 2 U ml−1 cholesterol oxidase for 15 min to oxidize the plasma membrane cholesterol. The intracellular cholesterol was then extracted with methanol/chloroform (vol/vol, 1: 2), and quantified using the Amplex Red cholesterol assay kit. The value of the plasma membrane cholesterol was obtained by subtracting the intracellular cholesterol from the total cellular cholesterol.
Biotinylation-based plasma membrane lipid purification and quantification
Plasma membrane cholesterol level was measured as previously described33. The plasma membrane of CD8+ T cells was biotinylated by 1 mg ml−1 sulfo-NHS-S-biotin, and then the cells were lysed by passing 13 times through a ball-bearing homogenizer. Plasma membrane was isolated from the supernatant of homogenate by streptavidin magnetic beads. Lipids were extracted with hexane/isopropanol (vol/vol, 3: 2), and then were used for measurement of unesterified cholesterol with Amplex Red Cholesterol Assay Kit and choline-containing phospholipids with EnzyChrom Phospholipid Assay Kit. The relative plasma membrane cholesterol level was normalized to the total phospholipids.
Modulation of the plasma membrane cholesterol level by MβCD and MβCD-coated cholesterol
To deplete cholesterol from the plasma membrane, CD8+ T cells were treated with 0.1–1 mM MβCD for 5 min at 37 °C, and then washed three times with PBS. To add cholesterol to the plasma membrane, CD8+ T cells were incubated with the culture medium supplied with 1–20 μg ml−1 MβCD-coated cholesterol at 37 °C for 15 min. The cells were then washed three times with PBS.
T-cell isolation and effector function analysis
Peripheral T cells were isolated from mouse spleen and draining lymph nodes by a CD8+ or CD4+ T-cell negative selection kit (Stem cell). To analyse the tumour-infiltrating T cells, tumours were first digested by collagenase IV (sigma), and tumour-infiltrating leukocytes were isolated by 40–70% Percoll (GE) gradient centrifugation. To measure the effector function of CD8+ T cells, the isolated cells were first stimulated with 1 μM ionomycin and 50 ng ml−1 phorbol 12-myristate 13-acetate (PMA) for 4 h in the presence of 5 μg ml−1 BFA, and then stained with PERCP-conjugated anti-CD8a. Next, cells were fixed with 4% PFA and stained with FITC-conjugated anti-granzyme B, allophycocyanin (APC)-conjugated anti-IFNγ and phycoerythrin (PE)-conjugated anti-TNFα. In general, to gate the cytokine or granule-producing cells, T cells without stimulation or stained with isotype control antibody were used as negative controls. This gating strategy is applicable for most of the flow cytometric analyses. To detect the MDSC cells in the tumour, the Percoll-isolated leukocyte were stained with anti-CD45, anti-CD11b and anti-Ly6G (Gr1), the CD45+ population was gated, after which the MDSC population (CD11b+ Gr1+) in CD45+ were gated.
Antigen stimulation of CD8+ T cells
A pan T-cell isolation kit (Miltenyi bio-tech) was used to deplete T cells from splenocytes isolated from C57BL/6 mice. The T-cell-depleted splenocytes were pulsed with antigenic peptides for 2 h and washed three times. SIINFEKL (OVA257–264 or N4), SAINFEKL (A2), SIITFEKL (T4), SIIGFEKL (G4) are four types of agonist antigens with strong to weak TCR affinities. RTYTYEKL (Catnb) is a self-antigen of OT-I TCR. SIIRFEKL (R4) supports the positive selection of OT-I T cells and thus mimics a self-antigen. The T-cell-depleted and antigen-pulsed splenocytes were co-incubated with Acat1CKO OT-I T cells or wild-type OT-I T cells for 24 h. Cytokine production of CD8+ T cells was measured by intracellular staining and flow cytometric analysis.
Measurement of CD8+ T-cell cytotoxicity
To generate mature CTLs, splenocytes isolated from Acat1CKO OT-I mice or wild-type OT-I mice were stimulated with OVA257–264 (N4) for 3 days in the presence of 10 ng ml−1 IL-2. Cells were centrifuged and cultured in fresh medium containing 10 ng ml−1 IL-2 for 2 more days, after which most of the cells in the culture were CTLs. To measure CD8+ T-cell cytotoxicity, EL-4 cells were pulsed with 2 nM antigenic peptide (N4, A2, T4, G4, R4 or Catnb) for 30 min. After washing EL-4 cells and CTLs three times with PBS, we mixed CTLs and antigen-pulsed EL-4 cells (1 ×10⁵) in the killing medium (phenol-free RPMI 1640, 2% FBS), at the ratios of 1:1, 2:1 and 5:1, respectively. After 4 h, the cytotoxic efficiency was measured by quantifying the release of endogenous lactate dehydrogenase (LDH) from EL-4 cells using a CytoTox 96 Non-Radioactive Cytotoxicity kit (Promega).
Measurement of human CD8+ T-cell cytokine production
Human peripheral blood mononuclear cells from healthy donators were stimulated with 5 μg ml−1 phytohaemagglutinin (Sigma) for 2 days and then rested for 1 day. Cells were pretreated with vehicle (DMSO), CP113,818 or avasimibe for 12 h and then stimulated with 5 μg ml−1 plate-bound anti-CD3 and anti-CD28 antibodies for 24 h. Intracellular staining and flow cytometry were used to measure cytokine productions of CD8+ T cells.
T-cell metabolism
Oxygen consumption rates and extracellular acidification rates were measured in nonbuffered DMEM (sigma) containing either 25 mM or 10 mM glucose, 2 mM l-glutamine, and 1 mM sodium pyruvate, under basal conditions and in response to 1 μM oligomycin (to block ATP synthesis), 1.5 μM FCCP (to uncouple ATP synthesis from the electron transport chain), 0.5 μM rotenone and antimycin A (to block complex I and III of the electron transport chain, respectively), and 200 μM etomoxir (to block mitochondrial fatty acid oxidation) on the XF-24 or XF-96 Extracellular Flux Analyzers (Seahorse Bioscience) according to the manufacturer’s recommendations.
Measurement of cell viability with MTS assay
B16F10 cells (5 ×10³) in 100 μl media containing avasimibe or DMSO were cultured for 24, 48 or 72 h. MTS reagent (20 μl) (CellTiter 96 AQueous One Solution Cell Proliferation Assay, Promega) was added into each well. After a 2–3-h incubation, the absorbance at 490 nm was measured. The effect of avasimibe on cell viability was obtained by normalizing the absorbance of avasimibe-treated cells with that of the DMSO-treated cells. The viability value of DMSO-treated cells was set as 1.
Listeria monocytogenes infection
L. monocytogenes (2 ×10⁴–7 ×10⁴ colony-forming units (CFU)) expressing a truncated OVA protein were intravenously injected into Acat1CKO and littermate wild-type mice aged 8–10 weeks. On day 6, T cells isolated from spleens were stimulated with 50 ng ml−1 PMA and 1 μM ion-omycin for 4 h in the presence of brefeldin A and then assessed by flow cytometry to detect IFNγ production. At the same time, the serum IFNγ level was assessed by ELISA. To detect the antigen-specific response of CD8+ T cells, the splenocytes were stimulated with 1 μM OVA257–264 peptide for 24 h. IFNγ production was analysed as mentioned above. To detect the L. monocytogens titre in the livers of infected mice, the livers were homogenized in 10 ml 0.2% (vol/vol) Nonidet P-40 in PBS, and the organ homogenates were diluted and plated on agar plates to determine the CFU of L. monocytogenes. Investigator was blinded to group allocation during the experiment and when assessing the outcome.
Melanoma mouse models
B16F10 cells were washed three times with PBS, and filtered through a 40-μm strainer. In a skin melanoma model, B16F10 cells (2 ×10⁵) were subcutaneously injected into the dorsal part of mice (aged 8–10 weeks). From day 10, tumour size was measured every 2 days, and animal survival rate was recorded every day. Tumour size was calculated as length × width. Mice with tumour size larger than 20 mm at the longest axis were euthanized for ethical consideration. To analyse effector function of tumour-infiltrating T cells, mice were euthanized on day 16. In the avasimibe therapy, melanoma-bearing mice with similar tumour size were randomly divided into two groups. From day 10, avasimibe was injected intraperitoneally to the mice at the dose of 15 mg kg−1 every 2 days.
In a lung-metastatic melanoma model, B16F10 cells (2 ×10⁵) were intravenously injected into mice (aged 8–10 weeks). Animal survival rate was recorded every day. To study tumour growth, mice were euthanized on day 20 and tumour numbers on lungs were counted. Lung-infiltrating T cells were isolated and analysed as mentioned above. In the lung-metastatic melanoma model, investigator was blinded to group allocation during the experiment and when assessing the outcome.
T-cell homing
B16F10-OVA cells (2 ×10⁵) were injected subcutaneously into C57BL/6 mice at age 8–10 weeks. On day 16, the naive wild-type or Acat1CKO OT-I CD8+ T cells were isolated and labelled with live cell dye CFSE or CTDR (Cell Tracker Deep Red, Life Technologies), respectively. The labelled wild-type and CKO cells were mixed together at a 1:1 ratio, and 1 ×10⁷ mixed cells per mouse were injected intravenously into the B16F10-OVA-bearing mice. After 12 h, blood, spleens, inguinal lymph nodes (draining) and mesenteric lymph nodes (non-draining) of the mice were collected. Single-cell suspensions from these tissues were stained with the anti-CD8a antibody, and the ratio of transferred cells in CD8+ populations was analysed using flow cytometry.
Lewis lung carcinoma model
The Lewis lung carcinoma cells were washed twice with PBS and filtered through a 40-μm strainer. After which, the Lewis lung carcinoma cells (2 ×10⁶) were intravenously injected into wild-type or Acat1CKO mice at age 8–10 weeks. To detect the tumour multiplicity in the lung, the mice were euthanized at day 35 after tumour inoculation and tumour numbers in the lung were counted. In the avasimibe therapy, mice were randomly divided into two groups. From days 10 to 35 after tumour inoculation, avasimibe was delivered to the mice by intragastric administration at the dose of 15 mg kg−1 every 3 days.
Treatment of melanoma by adoptive T-cell transfer
B16F10-OVA cells (2 ×10⁵) were injected subcutaneously into C57BL/6 mice at age 8–10 weeks. On day 10, melanoma-bearing mice with similar tumour size were randomly divided into three groups (n = 9–10) and respectively received PBS, wild-type OT-I CTLs (1.5 ×10⁶) or Acat1CKO OT-I CTLs (1.5 ×10⁶) by intravenous injection. From day 13, the tumour size was measured every two days, and the animal survival rate was recorded every day. Tumour size was calculated as length × width. Mice with tumour size larger than 20 mm at the longest axis were euthanized for ethical consideration.
Treatment of melanoma with avasimibe, anti-PD-1 antibody or avasimibe plus anti-PD-1 antibody
B16F10 cells (2 × 10⁵) were injected subcutaneously into C57BL/6 mice at age 8–12 weeks. On day 10, melanoma-bearing mice with similar tumour size were randomly divided into four groups (n = 8–10) and received PBS, avasimibe, anti-PD-1 antibody or both avasimibe and anti-PD-1 antibody, respectively. Avasimibe was delivered every 2 days at the dose of 15 mg kg−1 by intragastric administration. Anti-PD-1 antibody (RMP1-14, Bio X Cell, 200 μg per injection) was injected intraperitoneally every 3 days. The tumour size and survival were measured as mentioned above. Mice with tumour size larger than 20 mm at the longest axis were euthanized for ethical consideration.
Super-resolution STORM imaging and data analysis
Super-resolution STORM imaging was performed on a custom modified Nikon N-STORM microscope equipped with a motorized inverted microscope ECLIPSE Ti-E, an Apochromat TIRF 100 × oil immersion lens with a numerical aperture of 1.49 (Nikon), an electron multiplying charge-coupled device (EMCCD) camera (iXon3 DU-897E, Andor Technology), a quad band filter composed of a quad line beam splitter (zt405/488/561/640rpc TIRF, Chroma Technology Corporation) and a quad line emission filter (brightline HC 446, 523, 600, 677, Semrock, Inc.).
The TIRF angle was adjusted to oblique incidence excitation at the value of 3,950–4,000, allowing the capture of images at about 1 μm depth of samples. The focus was kept stable during acquisition using Nikon focus system. For the excitation of Alexa647, the 647 nm continuous wave visible fibre laser was used, and the 405 nm diode laser (CUBE 405-100C, Coherent Inc.) was used for switching back the fluorophores from dark to the fluorescent state. The integration time of the EMCCD camera was 90–95 frames per second. To image TCR distribution in the plasma membrane, naive CD8+ T cells or activated CD8+ T cells (stimulated with 10 μg ml−1 anti-CD3 for 10 min at 37 °C) were placed in Ibidi 35 mm μ-Dish and fixed with 4% PFA, followed by surface staining with 5 μg ml−1 anti-mCD3ε (145-2C11) for 4 h at 4 °C, then the cells were stained with 2 μg ml−1 Alexa 647-conjugated goat anti-hamster IgG (the secondary antibody) for 2 h at 4 °C after washing with PBS ten times. Before imaging, the buffer in the dish was replaced with the imaging buffer contained 100 mM β-mercaptoethanolamin (MEA) for a sufficient blinking of fluorophores.
Super-resolution images were reconstructed from a series of 20,000–25,000 frames using the N-STORM analysis module of NIS Elements AR (Laboratory imaging s.r.o.). Molecule distribution and cluster position were analysed with MATLAB (MathWorks) based on Ripley’s K function. L(r) − r represents the efficiency of molecule clustering, and r value represents cluster radius. The r value at the maximum L(r) − r value represents the cluster size with the highest probability34.
Imaging of immunological synapse by TIRFM
Planar lipid bilayers (PLBs) containing biotinylated lipids were prepared to bind biotin-conjugated stimulating antibody by streptavidin as previously described35,36. Biotinylated liposomes were prepared by sonicating 1,2-dioleoyl-sn-glycero-3-phosphocholine and 1,2-dioleoyl-sn-glycero-3-phosphoethanolamine-cap-biotin (25:1 molar ratio, Avanti Polar Lipids) in PBS at a total lipid concentration of 5 mM. PLBs were formed in Lab-Tek chambers (NalgeNunc) in which the cover glasses were replaced with nanostrip-washed coverslips. Coverslips were incubated with 0.1 mM biotinylated liposomes in PBS for 20 min. After washing with 10 ml PBS, PLBs were incubated with 20 nM streptavidin for 20 min, and excessive streptavidin was removed by washing with 10 ml PBS. Streptavidin-containing PLBs were incubated with 20 nM bionylated anti-mCD3ε (145-2C11) (Biolegend). Excessive antibody was removed by washing with PBS. Next, PLBs were treated with 5% FBS in PBS for 30 min at 37 °C and washed thoroughly for TIRFM of T cells. Adhesion ligands necessary for immunological synapse formation were provided by treating the bilayer with serum.
Freshly isolated mouse splenocytes were stained with Alexa568-anti-mTCRβ Fab and FITC-anti-mCD8 and washed twice. Anti-mTCRβ antibody was labelled with Alexa568-NHS ester (Molecular probes) and digested to get Fab fragments with Pierce Fab Micro Preparation Kit (Thermo). Cells were then placed on anti-mCD3ε-containing PLBs to crosslink TCR. Time-lapse TIRFM images were acquired on a heated stage with a 3-s interval time at 37 °C, 5% CO2, using a Zeiss Axio Observer SD microscopy equipped with a TIRF port, Evolve 512 EMCCD camera and Zeiss Alpha Plan-Apochromat 100 × oil lens. The acquisition was controlled by ZEN system 2012 software. An OPSL laser 488 nm and a DPSS laser 561 nm were used. Field of 512 × 512 pixels was used to capture 6–8 CD8+ T cells per image. Results of synapse formation and TCR movements were the population averages of all CD8+ T cells from 2–3 individual images. The movements of TCR microclusters were splitted into directed, confined and random movement using the method described37. To sort the three movements, the MSD plot of each TCR microcluster was fitted with three functions as described37. The ones with good fit (square of correlation coefficients (R2) ≥ 0.33) were selected for further classification. For a certain TCR microcluster, the movement is defined as random if s.d. < 0.010. The distinction of directed and confined movement depends on which function fit better in the population of those s.d. ≥ 0.010. Images were analysed with Image Pro Plus software (Media Cybernetics), ImageJ (NIH) and MATLAB (MathWorks).
Polarized secretion of cytolytic granules
In the granule polarization imaging, CTLs stained with Alexa568-anti-mTCRβ Fab were placed on anti-mCD3ε-containing PLBs for indicated time and fixed with 4% PFA. After the permabilization, cells were stained with Alexa488-anti-mCD107a (1D4B) antibody. Three-dimensional spinning-disc confocal microscopy was used to image the granules polarized at 0–2 μm distance from the synapse. The total granule volumes were quantified with Imaris software.
The degranulation level was measured as previously described38. OT-I CTLs were mixed with OVA257–264 pulsed EL4 cells at 1:1 ratio. The mixed cells were then cultured in the medium supplemented with 1 μg ml−1 Alexa488-anti-CD107a antibody and 2 μM monensin for 1, 2 and 4 h. After which, cells were washed with PBS and further stained with PE–Cy7-anti-CD8a antibody. Flow cytometry was used for assessing the surface and internalized CD107a levels.
Code availability
MATLAB code used to perform STORM and TIRFM data analysis can be accessed by contacting W.L. (liuwanli@biomed.tsinghua.edu.cn).
Statistical analysis
All sample sizes are large enough to ensure proper statistical analysis. Statistical analyses were performed using GraphPad Prism (GraphPad Software, Inc.). Statistical significance was determined as indicated in the figure legends. P < 0.05 was considered significant; *P < 0.05; **P < 0.01; ***P < 0.001. All t-test analyses are two-tailed unpaired t-tests. The replicates in Figs 2, 3b, i, k–o, 4a, b, e–j, l, m and Extended Data Figs 1a, 3a–c, g–l, 4f, 5a–e, 6, 7g, 8, 9e, h, j and 10 were biological replicates. The replicates in Figs 1, 3c, d, p, Fig. 4o, p and Extended Data Figs 1b–i, 2, 3d–f, m, n, 4b–e, 5f, g, 7a, b, i–l and 9a–c were technical replicates. The centre values shown in all figures are average values.
Extended Data
Extended Data Figure 1. Reprogramming of cellular cholesterol metabolism in activated CD8+ T cells.
a, Filipin III staining (left) and quantification (right) of cellular cholesterol of naive and activated CD8+ T cells stimulated by 5 μg ml−1 plate-bound anti-CD3/CD28 antibodies for 12 h (n = 60). b, Total cellular, plasma membrane and intracellular cholesterol quantified using the cholesterol oxidation-based method (n = 4). c, Relative plasma membrane cholesterol quantified using the biotinylation-based method (n = 4). d–f, Transcriptional levels of key genes encoding molecules involved in cholesterol synthesis, transport and efflux (n = 3). CD8 + T cells were stimulated with 5 μg ml−1 plate-bound anti-CD3/CD28 antibodies. Results and statistical analysis are relative to quiescent CD8+ T cells. mRNA levels of cholesterol biosynthesis genes, including Srebp1 (also known as Srebf1), Srebp2 (Srebf2), Hmgcr, Hmgcs, Fasn, Acaca and Sqle, were upregulated in activated CD8+ T cells. Ldlr, which encodes the LDL receptor, a major receptor for cholesterol transport, was upregulated in activated CD8+ T cells, whereas, Idol (also known as Mylip), which encodes IDOL, an inducible degrader of the LDL receptor, was downregulated. Cholesterol efflux genes, including Abca1 and Abcg1, were all downregulated in activated CD8+ T cells. g–i, Cytokine/granule productions of CD8+ T cells after modulation of cholesterol metabolic pathways (n = 3). Naive CD8+ T cells were pretreated for 6 h with vehicle (DMSO), lovastatin (to inhibit cholesterol biosynthesis) or U18666A (a cholesterol transport inhibitor with pleotropic effects), respectively. Cells were then stimulated with 5 μg ml−1 plate-bound anti-CD3 and anti-CD28 antibodies for 24 h before intracellular staining. Representative flow cytometric profiles shown in g. Data are representative of two independent experiments, and were analysed by Mann–Whitney test (a) or unpaired t-test (b–f, h, i). Error bars denote s.e.m; *P < 0.05; **P < 0.01; ***P < 0.001; NS, not significant.
Extended Data Figure 2. ACAT1 deficiency affects the cholesterol metabolism but not the basal energy metabolism of CD8+ T cells.
a, ACAT2 was weakly expressed in mouse CD4+ T cells but was barely detectable in mouse CD8+ T cells. A sample from mouse small intestine was used as a positive control. b, Protein levels of ACAT1 were significantly lower in Acat1CKO (CKO) CD8+ T cells than in wild-type cells, indicating a good knockout efficiency of Acat1 in CD8+ T cells. See Supplementary Fig. 1 for gel source data. c, d, ACAT1 deficiency did not change the transcriptional level of Acat2 in CD4+ and CD8+ T cells of Acat1CKO mice. Cells were stimulated with 5 μg ml−1 plate-bound anti-CD3 and anti-CD28 antibodies for the indicated time (n = 3). e, ACAT1 deficiency resulted in significant enhancement of the transcription levels of cholesterol synthesis genes in both naive and activated cells. Transcription levels of cholesterol transport and efflux genes underwent only modest changes in CKO CD8+ T cells. Naive wild-type or CKO CD8+ T cells were stimulated with 5 μg ml−1 plate-bound anti-CD3 and anti-CD28 for the indicated time (n = 3). f, g, Basal energy metabolism of naive wild-type and CKO CD8+ T cells was measured. No significant difference was observed between wild-type and CKO cells. f, Oxidative phosphorylation was measured by the oxygen consumption rates (OCR) under basal condition, and glycolysis was measured by the extracellular acidification rates (ECAR) under basal condition (n = 5). g, Fatty acid oxidation was measured by the OCR under basal condition and in response to indicated drugs: oligomycin (to block ATP synthesis), FCCP (to uncouple ATP synthesis from the electron transport chain), rotenone and antimycin A (to block complex I and III of the electron transport chain, respectively), and etomoxir (to block mitochondrial fatty acid oxidation). Fatty acid oxidation can be represented by the influence of etomoxir on the OCR. Between wild-type etomoxir and CKO etomoxir: P > 0.05 after FCCP in g (left); P > 0.05 after etomoxir in g (right). Between wild-type and CKO: P > 0.05 after FCCP in g (left): P > 0.05 after control in g (right). No significant difference was observed (n = 3). Data are representative of two (c–e, g) or three (f) independent experiments, and were analysed by unpaired t-test (c–f) or two-way ANOVA followed with Bonferroni’s multiple comparison tests (g). Error bars denote s.e.m; *P < 0.05; **P < 0.01; ***P < 0.001.
Extended Data Figure 3. ACAT1 deficiency does not affect thymocyte development and peripheral T-cell homeostasis, but results in enhanced proliferation and reduced apoptosis of CD8+ T cells.
a, b, Flow cytometric analysis of thymocytes and splenic T cells from wild-type and CKO mice (8 weeks old, n = 4). Representative flow cytometric profiles were shown in a. Percentages of CD4− CD8− double negative (DN), CD4+ CD8+ double positive (DP), CD4+ single positive (CD4SP) and CD8+ single positive (CD8SP) cells in total thymocytes were comparable (b, left). Naive (CD44loCD62Lhi), central memory (CD44hiCD62Lhi; CM) and effector/effector memory (CD44hi CD62Llo, effector/EM) of CD4+ and CD8+ T cells from the spleen of wild-type and CKO mice were comparable (b, right). Data were analysed by Mann–Whitney test, and no significant difference was observed. c, Total CD4+ and CD8+ T-cell numbers from the spleen of wild-type and CKO mice (8 weeks old, n = 6) were assessed using flow cytometry. Data were analysed with Mann–Whitney test, and no significant difference was observed. d–f, Cytokine/granule productions of resting naive (CD62LhiCD44lo) and central memory (CD62LhiCD44hi) CD8+ T cells from the spleen of wild-type and CKO mice (8 weeks old, n = 3). CD8 + T cells were isolated from the spleen and cultured for 4 h in the presence of 5 μg ml−1 brefeldin A. Naive and memory populations were gated by CD62L and CD44 expression. Data were analysed by unpaired t-test, and no significant difference was observed. g, h, Serum levels of IFNγ and auto-antibody anti-dsDNA IgG of wild-type and CKO mice (12 weeks old, WT, n = 7; CKO, n = 6) were assessed using ELISA. Data were analysed by Mann–Whitney test, and no significant difference was observed. i, j, T-cell homeostasis was measured by BrdU labelling and detection. Wild-type and CKO mice (6 weeks old) were injected with a single dose (2 mg) of BrdU intraperitoneally. Peripheral blood was collected at the indicated time and analysed using flow cytometry. Percentages of BrdU+ cells in total peripheral CD4+ and CD8+ T cells of wild-type and CKO mice (n = 6) were plotted. Data were analysed by two-way ANOVA, and no significant difference was observed. k, l, CD8+ T-cell proliferation was measured by CFSE dilution. Cells were stimulated with 1–2 μg ml−1 plate-bound anti-CD3 and anti-CD28 antibodies for the indicated time. Data were analysed by two-way ANOVA (n = 3). m, n, CD8+ T-cell apoptosis was measured by annexin V and propidium iodide (PI) staining. The naive CD8+ cells were isolated from the spleen of wild-type or CKO mice (8 weeks old), and cultured in medium for 24 h without stimulation, or stimulated with 5 μg ml−1 plate-bound anti-CD3 and anti-CD28 antibodies for 24 h. Annexin V and propidium iodide were used to stain early (annexin V+ PI−) and late (annexin V+ PI+) cells apoptotic. Apoptotic cells were significantly lower in CKO CD8+ T cells than in wild-type CD8+ T cells. Data were analysed by unpaired t-test (n = 3). Error bars denote s.e.m; *P < 0.05; **P < 0.01.
Extended Data Figure 4. ACAT1 deficiency does not result in significant change of CD4+ T-cell function.
a, b, Cytokine productions of CD4+ T cells (n = 3). Cells were stimulated with 5 μg ml−1 plate-bound anti-CD3 and anti-CD28 antibodies for 12 h. Representative flow cytometric profiles are shown in a. c–e, Relative transcription levels of Acat1 and Acat2 in naive CD4+ and CD8+ T cells freshly isolated from C57BL/6 mice (n = 3). Acat1 transcription level was significantly higher than Acat2 in CD4+ T cells. Acat1 transcription levels were comparable between CD4+ and CD8+ T cells, whereas the Acat2 transcription level in CD4+ T cells was significantly higher than that in CD8+ T cells. Acat2 transcription level in CD4+ T cells was set as 1 in c. Acat1 and Acat2 transcription levels in CD8+ T cells were set as 1 in d and e. f, Filipin III staining to analyse cellular cholesterol distribution in naive and activated CD4+ T cells from wild-type and CKO mice. Data were analysed by unpaired t-test (b–e) or Mann–Whitney test (f). Error bars denote s.e.m; *P < 0.05; ***P < 0.001.
Extended Data Figure 5. ACAT1 deficiency promotes CD8+ T-cell response but does not result in autoreactivity to self-antigens.
a–e, Listeria monocytogenes was used to infect wild-type and CKO mice to induce a strong T-cell response. a, IFNγ production of CD8+ T cells from wild-type and CKO mice infected (day 7 after infection) with Listeria monocytogenes (LM) that exogenously express OVA antigen, or were uninfected (UI). The splenocytes were re-stimulated with PMA (50 ng ml−1) plus ionomycin (1 μM) for 4 h in the presence of 5 μg ml−1 brefeldin A. CD8+ IFNγ+ cells were gated for analysis (UI, n = 3; LM, n = 4). b, IFNγ production of OVA-specific CD8+ T cells from the wild-type and CKO mice infected (day 7 after infection) with Listeria monocytogenes that exogenously express OVA antigen or uninfected. Splenocytes were stimulated with OVA257–264 peptide for 24 h. CD8+ IFNγ+ cells were gated for analysis (UI, n = 5; LM, n = 6). c, IFNγ levels in serum of infected or uninfected mice were assessed by ELISA (UI, n = 5; LM WT, n = 8; LM CKO, n = 6). d, Liver Listeria monocytogenes titre was analysed at day 6 after infection (n = 6). e, Percentages of IFNγ+ cells in CD4+ cells from the spleens of wild-type and CKO mice were assessed as in a (WT, n = 4; CKO, n = 5). f, g, Effect of ACAT1 deficiency on CD8+ T-cell responses to different antigens. f, Naive wild-type OT-I or Acat1CKO OT-I (CKO OT-I) CD8+ T cells were stimulated with autologous splenocytes pulsed with foreign antigen (N4, A2, T4 or G4), positive-selection-supporting antigen (R4) or self-antigen (Catnb). Flow cytometry was used to measure IFNγ production (n = 4). g, Splenocytes from wild-type OT-I or CKO OT-I mice were stimulated with OVA257–264 to generate mature CTLs. CTLs were incubated with EL-4 cells pulsed with different antigens for 4 h, and LDH release was measured to assess cytotoxic efficiency (n = 4). Data are representative of three (f, g) independent experiments, and were analysed by Mann–Whitney test (a–e) or unpaired t-test (f, g). Error bars denote s.e.m; *P < 0.05; **P < 0.01; ***P < 0.001.
Extended Data Figure 6. ACAT1 deficiency promotes antitumour response of CD8+ T cells in different tumour models.
a–c, B16F10 melanoma cells (2 ×10 5) were subcutaneously injected into wild-type (n = 6) or CKO (n = 8) mice to induce skin melanoma. On day 7, CD8+ T cells were isolated from draining lymph nodes of wild-type and CKO mice. Flow cytometry was used to analyse surface expression of activation marker CD44 and IFNγ production of CD8+ T cells, as well as CD8+ T-cell number and CD8/CD4 T-cell ratio. Data are representative of three independent experiments, and were analysed by Mann–Whitney test. d–i, B16F10 melanoma cells (2 ×10 5) were intravenously injected into wild-type or CKO mice to induce melanoma with lung metastasis. d, e, On day 20, lungs were isolated to count tumour numbers (WT, n = 9; CKO, n = 8). Data are representative of three independent experiments, and were analysed by Mann–Whitney test. f, On day 14, lung sections were stained with haematoxylin and eosin to assess the infiltration of melanoma into lung. g, Survival was analysed by log-rank (Mantel–Cox) test (WT, n = 11; CKO, n = 14). h, i, On day 20, lung infiltrating CD8+ T cells were isolated and flow cytrometry was used to measure the granule and cytokine productions as well as surface expression of the activation marker CD44. Data were analysed by Mann–Whitney test. j–l, Lewis lung carcinoma cells (2 ×10 6) were intravenously injected into wild-type or CKO mice to induce lung cancer. On day 35, lungs were isolated to count tumour numbers. Tumour multiplicity data were analysed by Mann–Whitney test (k, n = 7). Survival was analysed by log-rank (Mantel–Cox) test (l, WT, n = 11; CKO, n = 13). Error bars denote s.e.m; *P < 0.05; **P < 0.01; ***P < 0.001.
Extended Data Figure 7. Cholesterol level of the plasma membrane directly affects CD8+ T-cell function.
To reduce the cholesterol level of the plasma membrane, CD8+ T cells were treated with MβCD at different doses for 5 min. To increase the cholesterol level, CD8+ T cells were treated with MβCD-coated cholesterol (chol) at different doses for 15 min. a, b, Measurements of plasma membrane cholesterol level of CD8+ T cells by biotinylation-based method. MβCD-coated cholesterol treatment increased whereas MβCD decreased plasma membrane cholesterol. a, Wild-type OT-I CTLs were treated with 10 μg ml−1 MβCD-coated cholesterol, and CKO OT-I CTLs were treated with 1 mM MβCD. WT OT-I, n = 8; CKO OT-I, n = 6. b, Naive wild-type polyclonal CD8+ T cells were treated with 10 μg ml−1 MβCD-coated cholesterol (n = 4). c, d, TCR levels of CD8+ T cells after MβCD or MβCD-coated cholesterol treatment. MβCD treatment reduced whereas MβCD-coated cholesterol treatment did not change the surface TCR level. OT-I CTLs (c) and naive wild-type polyclonal CD8+ T cells (d) were treated as in a and b, respectively. IC, isotype control. e–g, TCR clustering after treatment of naive wild-type CD8+ T cells with 10 μg ml−1 MβCD-coated cholesterol. Super-resolution STORM images of TCR were acquired and analysed as Fig. 3g–i. Increasing plasma membrane cholesterol of CD8+ T cells promoted the clustering of TCR. g, WT, n = 73; WT +chol, n = 62. h, TCR signalling after treatment of wild-type OT-I CTLs with 10 μg ml−1 MβCD-coated cholesterol, measured by immunoblotting. Cells were then stimulated with 2 μg ml−1 anti-CD3 and anti-CD28 antibodies for indicated time at 37 °C. Increasing plasma membrane cholesterol of CD8+ T cells promoted the signalling of TCR. See Supplementary Fig. 1 for gel source data. i, j, Cytokine/granule productions of CD8+ T cells treated with MβCD (i) or MβCD-coated cholesterol (j) (n = 3). Cells were stimulated with 5 μg ml−1 plate-bound anti-CD3 and anti-CD28 antibodies for 24 h at 37 °C. k, l, Cytotoxicity of CD8+ T cells treated with MβCD (k) or MβCD-coated cholesterol (l) (n = 3). CTLs were then incubated with EL-4 cells pulsed with OVA257–264 for 4 h. LDH release was measured to assess cytotoxic efficiency. Data were analysed by unpaired t-test (a, b, i–l) or Mann–Whitney test (g). Error bars denote s.e.m; *P < 0.05; **P < 0.01; ***P < 0.001.
Extended Data Figure 8. Homing of naive wild-type or CKO OT-I T cells to secondary lymphoid organs in the B16-OVA melanoma-bearing mice.
Naive OT-I T cells were isolated from wild-type or CKO OT-I TCR transgenic mice, and labelled with CTDR (cell tracker deep red dye) or CFSE (carboxyfluorescein succinimidyl ester), respectively. Labelled wild-type and CKO cells were mixed at 1:1 ratio, and the mixture (107 cells) was intravenously injected into the B16-OVA melanoma bearing C57BL/6 mice. After 12 h, the indicated tissues from the mice were isolated and the percentages of the labelled cells were assessed using flow cytometry. a, Flow cytometric analysis of the homing receptor CCR7 and CD62L surface level of naive wild-type and CKO OT-I T cells. No significant difference was observed. b, The percentages of transferred cells in total CD8+ T cells were assessed using flow cytometry. Data were analysed with Mann–Whitney test (n = 11). Data are representative of two independent experiments. Error bars denote s.e.m; *P < 0.05; **P < 0.01.
Extended Data Figure 9. Avasimibe treatment leads to enhanced TCR clustering and signalling, as well as more efficient formation of immunological synapse.
a, Cytokine/granule productions of CD8+ T cells after avasimibe treatment (n = 3). The naive cells were pretreated for 6 h with avasimibe or vehicle (DMSO) and then stimulated by 5 μg ml−1 plate-bound anti-CD3 and anti-CD28 antibodies for 24 h. Data were analysed by t-test. b, CTL cytotoxicity after avasimibe treatment measured by the LDH assay (n = 3). OT-I CTLs were pretreated with avasimibe or vehicle for 6 h and then incubated with EL-4 cells pulsed with OVA257–264 peptide for 4 h. Data were analysed by t-test. c, An MTS-based cell viability assay was performed to assess the toxicity of avasimibe to B16F10 cells (n = 6). Data were analysed by one-way ANOVA, and no significant difference was observed. d, e, Filipin III staining to analyse cellular cholesterol distribution in naive CD8+ T cells treated with avasimibe or vehicle. d, Representative images. e, Data were analysed by Mann–Whitney test. 0, n = 217; 0.5, n = 139; 1, n = 133. f–h, Super-resolution STORM images of TCR in naive CD8+ T cells treated with avasimibe or vehicle. f, Representative images. g, Ripley’s K-function was used to analyse TCR molecules distribution. h, The r value at the maximal L(r) − r value of Ripley’s K-function curves, and data were analysed by Mann–Whitney test. 0, n = 41; 0.5, n = 60; 1, n = 66. i, Representative TIRFM images of immunological synapses of CD8+ T cells treated with avasimibe (1 μM) or vehicle for 6 h. Cells were stimulated by PLB-bound anti-CD3 for the indicated time and fixed by 4% PFA before imaging. j, Areas of the immunological synapses (n > 60 cells). The formation and contraction of the immunological synapses of CD8+ T cells treated with avasimibe were more rapid than those treated with vehicle. Data were analysed by two-way ANOVA. k, TCR proximal and downstream signalling was assessed using immunoblotting of protein phosphorylation. OT-I CTLs were treated with 1 μM avasimibe or vehicle for 6 h and then stimulated with 2 μg ml−1 soluble anti-CD3 and anti-CD28 for the indicated time. See Supplementary Fig. 1 for gel source data. Error bars denote s.e.m; *P < 0.05; **P < 0.01; ***P < 0.001.
Extended Data Figure 10. Avasimibe treatment leads to potentiated effector function and enhanced proliferation of tumour-infiltrating CD8+ T cells.
C57BL/6 mice bearing B16F10 melanoma were treated with avasimibe (15 mg kg−1) or same dose of DMSO in PBS for four times by intraperitoneal injection. The mice were euthanized at day 18 and the tumours were isolated. a, The CD44 surface expression and cytokine/ granule productions of tumour-infiltrating CD8+ T cells were assessed using flow cytometry (n = 6). b, CD8+ T-cell number, CD8+/CD4+ T-cell ratio and Ki-67 level of tumour-infiltrating CD8+ T cells were assessed using flow cytometry (n = 7). c, Percentages of CD8+ central memory (CD44hiCD62Lhi) and CD8+ effector/effectory memory (CD44hi CD62Llo) were assessed using flow cytometry (control, n = 12; avasimibe, n = 11). d, Surface levels of PD-1, CTLA-4 and TCR of tumour-infiltrating CD8+ T cells. PD-1 level was indicated by the percentage of PD-1hi cells. CTLA-4 and TCR levels were indicated by median fluorescence intensity. PD-1 and CLTA-4 staining, n = 7; TCR staining, n = 5. e, Treg cell (FoxP3+ CD4+) and myeloid-derived suppressor cell (MDSC) (Gr1+ CD11b+) percentages in the tumour microenvironment were assessed using flow cytometry (n = 7). Data were analysed by Mann–Whitney test. Error bars denote s.e.m; *P < 0.05; **P < 0.01; ***P < 0.001.
Acknowledgments
We thank Q. Leng for providing L. monocytogenes, F.-J. Nan for providing K604, and Y. Jiang for some preliminary experiments. We thank H. Gu and D. Li for careful reading of the manuscript. Imaging work was performed at the National Center for Protein Science Shanghai. Chenqi Xu is funded by MOST (2011CB910901 and 2012CB910804), NSFC grants (31370860, 31425009 and 31530022), and CAS grants (Strategic Priority Research Program XDB08020100; KSCX2-EW-J-11). B.L. is funded by MOST (2011CB910901) and NSFC grant 31271377. W.Y. is funded by NSFC grant (31400745) and China Postdoctoral Science Foundation (2014M561533 and 2014T70440). T.-Y.C. and C.C.Y.C. are funded by NIH grant HL 60306.
Footnotes
Online Content: Methods, along with any additional Extended Data display items and Source Data, are available in the online version of the paper; references unique to these sections appear only in the online paper.
Supplementary Information is available in the online version of the paper.
Author Contributions: Chenqi Xu conceived the project. B.L., X.L., S.S., B.-.L.S., W.Y. and Y.X. contributed to the design of the project and extensive discussions. P.Z. provided technical help on the tumour models. T.-Y.C. and C.C.Y.C. generated Acat1flox/flox mice. W.Y., Y.B., X.Z., J.Z., X.M. and L.L. performed the ex vivo T-cell experiments and animal experiments. W.Y. and S.C. performed the STORM experiments. Y.B. performed the TIRFM experiments. T.Z. provided human cells. J.Z. and T.Z. performed the human cell experiments. W.L., J.W. and Chenguang Xu helped with the TIRFM setup and data analysis. L.W. helped with the cholesterol staining and quantification. Chenqi Xu, W.Y. and Y.B. wrote the manuscript. Other authors revised the manuscript.
The authors declare no competing financial interests.
Readers are welcome to comment on the online version of the paper.
References
- 1.Fridman WH, Pages F, Sautes-Fridman C, Galon J. The immune contexture in human tumours: impact on clinical outcome. Nature Rev Cancer. 2012;12:298–306. doi: 10.1038/nrc3245. [DOI] [PubMed] [Google Scholar]
- 2.Tumeh PC, et al. PD-1 blockade induces responses by inhibiting adaptive immune resistance. Nature. 2014;515:568–571. doi: 10.1038/nature13954. [DOI] [PMC free article] [PubMed] [Google Scholar]
- 3.Mellman I, Coukos G, Dranoff G. Cancer immunotherapy comes of age. Nature. 2011;480:480–489. doi: 10.1038/nature10673. [DOI] [PMC free article] [PubMed] [Google Scholar]
- 4.Joyce JA, Fearon DT. T cell exclusion, immune privilege, and the tumor microenvironment. Science. 2015;348:74–80. doi: 10.1126/science.aaa6204. [DOI] [PubMed] [Google Scholar]
- 5.Chang TY, Chang CC, Ohgami N, Yamauchi Y. Cholesterol sensing, trafficking, and esterification. Annu Rev Cell Dev Biol. 2006;22:129–157. doi: 10.1146/annurev.cellbio.22.010305.104656. [DOI] [PubMed] [Google Scholar]
- 6.Chang TY, Li BL, Chang CC, Urano Y. Acyl-coenzyme A:cholesterol acyltransferases. Am J Physiol Endocrinol Metab. 2009;297:E1–E9. doi: 10.1152/ajpendo.90926.2008. [DOI] [PMC free article] [PubMed] [Google Scholar]
- 7.Pal P, Gandhi H, Giridhar R, Yadav MR. ACAT inhibitors: the search for novel cholesterol lowering agents. Mini Rev Med Chem. 2013;13:1195–1219. doi: 10.2174/1389557511313080007. [DOI] [PubMed] [Google Scholar]
- 8.Yao S, Zhu Y, Chen L. Advances in targeting cell surface signalling molecules for immune modulation. Nature Rev Drug Discov. 2013;12:130–146. doi: 10.1038/nrd3877. [DOI] [PMC free article] [PubMed] [Google Scholar]
- 9.Sharma P, Allison JP. The future of immune checkpoint therapy. Science. 2015;348:56–61. doi: 10.1126/science.aaa8172. [DOI] [PubMed] [Google Scholar]
- 10.Xu C, et al. Regulation of T cell receptor activation by dynamic membrane binding of the CD3ε cytoplasmic tyrosine-based motif. Cell. 2008;135:702–713. doi: 10.1016/j.cell.2008.09.044. [DOI] [PMC free article] [PubMed] [Google Scholar]
- 11.Shi X, et al. Ca2+ regulates T-cell receptor activation by modulating the charge property of lipids. Nature. 2013;493:111–115. doi: 10.1038/nature11699. [DOI] [PubMed] [Google Scholar]
- 12.Gagnon E, Schubert DA, Gordo S, Chu HH, Wucherpfennig KW. Local changes in lipid environment of TCR microclusters regulate membrane binding by the CD3ε cytoplasmic domain. J Exp Med. 2012;209:2423–2439. doi: 10.1084/jem.20120790. [DOI] [PMC free article] [PubMed] [Google Scholar]
- 13.Molnár E, et al. Cholesterol and sphingomyelin drive ligand-independent T-cell antigen receptor nanoclustering. J Biol Chem. 2012;287:42664–42674. doi: 10.1074/jbc.M112.386045. [DOI] [PMC free article] [PubMed] [Google Scholar]
- 14.Schamel WW, et al. Coexistence of multivalent and monovalent TCRs explains high sensitivity and wide range of response. J Exp Med. 2005;202:493–503. doi: 10.1084/jem.20042155. [DOI] [PMC free article] [PubMed] [Google Scholar]
- 15.Zech T, et al. Accumulation of raft lipids in T-cell plasma membrane domains engaged in TCR signalling. EMBO J. 2009;28:466–476. doi: 10.1038/emboj.2009.6. [DOI] [PMC free article] [PubMed] [Google Scholar]
- 16.Kidani Y, et al. Sterol regulatory element-binding proteins are essential for the metabolic programming of effector T cells and adaptive immunity. Nature Immunol. 2013;14:489–499. doi: 10.1038/ni.2570. [DOI] [PMC free article] [PubMed] [Google Scholar]
- 17.Leon C, Hill JS, Wasan KM. Potential role of acyl-coenzyme A:cholesterol transferase (ACAT) inhibitors as hypolipidemic and antiatherosclerosis drugs. Pharm Res. 2005;22:1578–1588. doi: 10.1007/s11095-005-6306-0. [DOI] [PubMed] [Google Scholar]
- 18.Chang CC, et al. Immunological quantitation and localization of ACAT-1 and ACAT-2 in human liver and small intestine. J Biol Chem. 2000;275:28083–28092. doi: 10.1074/jbc.M003927200. [DOI] [PubMed] [Google Scholar]
- 19.Ikenoya M, et al. A selective ACAT-1 inhibitor, K-604, suppresses fatty streak lesions in fat-fed hamsters without affecting plasma cholesterol levels. Atherosclerosis. 2007;191:290–297. doi: 10.1016/j.atherosclerosis.2006.05.048. [DOI] [PubMed] [Google Scholar]
- 20.Tobert JA. Lovastatin and beyond: the history of the HMG-CoA reductase inhibitors. Nature Rev Drug Discov. 2003;2:517–526. doi: 10.1038/nrd1112. [DOI] [PubMed] [Google Scholar]
- 21.Cenedella RJ. Cholesterol synthesis inhibitor U18666A and the role of sterol metabolism and trafficking in numerous pathophysiological processes. Lipids. 2009;44:477–487. doi: 10.1007/s11745-009-3305-7. [DOI] [PubMed] [Google Scholar]
- 22.MacIver NJ, Michalek RD, Rathmell JC. Metabolic regulation of T lymphocytes. Annu Rev Immunol. 2013;31:259–283. doi: 10.1146/annurev-immunol-032712-095956. [DOI] [PMC free article] [PubMed] [Google Scholar]
- 23.Santori FR, et al. Rare, structurally homologous self-peptides promote thymocyte positive selection. Immunity. 2002;17:131–142. doi: 10.1016/s1074-7613(02)00361-8. [DOI] [PubMed] [Google Scholar]
- 24.Lillemeier BF, et al. TCR and Lat are expressed on separate protein islands on T cell membranes and concatenate during activation. Nature Immunol. 2010;11:90–96. doi: 10.1038/ni.1832. [DOI] [PMC free article] [PubMed] [Google Scholar]
- 25.Beal AM, et al. Kinetics of early T cell receptor signaling regulate the pathway of lytic granule delivery to the secretory domain. Immunity. 2009;31:632–642. doi: 10.1016/j.immuni.2009.09.004. [DOI] [PMC free article] [PubMed] [Google Scholar]
- 26.Huttunen HJ, Kovacs DM. ACAT as a drug target for Alzheimer’s disease. Neurodegener Dis. 2008;5:212–214. doi: 10.1159/000113705. [DOI] [PMC free article] [PubMed] [Google Scholar]
- 27.Page DB, Postow MA, Callahan MK, Allison JP, Wolchok JD. Immune modulation in cancer with antibodies. Annu Rev Med. 2014;65:185–202. doi: 10.1146/annurev-med-092012-112807. [DOI] [PubMed] [Google Scholar]
- 28.Pardoll DM. The blockade of immune checkpoints in cancer immunotherapy. Nature Rev Cancer. 2012;12:252–264. doi: 10.1038/nrc3239. [DOI] [PMC free article] [PubMed] [Google Scholar]
- 29.Rosenberg SA, Restifo NP. Adoptive cell transfer as personalized immunotherapy for human cancer. Science. 2015;348:62–68. doi: 10.1126/science.aaa4967. [DOI] [PMC free article] [PubMed] [Google Scholar]
- 30.Schumacher TN, Schreiber RD. Neoantigens in cancer immunotherapy. Science. 2015;348:69–74. doi: 10.1126/science.aaa4971. [DOI] [PubMed] [Google Scholar]
- 31.Cao Y, et al. LKB1 regulates TCR-mediated PLCγ1 activation and thymocyte positive selection. EMBO J. 2011;30:2083–2093. doi: 10.1038/emboj.2011.116. [DOI] [PMC free article] [PubMed] [Google Scholar]
- 32.Guo ZY, Lin S, Heinen JA, Chang CC, Chang TY. The active site His-460 of human acyl-coenzyme A:cholesterol acyltransferase 1 resides in a hitherto undisclosed transmembrane domain. J Biol Chem. 2005;280:37814–37826. doi: 10.1074/jbc.M508384200. [DOI] [PubMed] [Google Scholar]
- 33.Das A, Goldstein JL, Anderson DD, Brown MS, Radhakrishnan A. Use of mutant 125I-perfringolysin O to probe transport and organization of cholesterol in membranes of animal cells. Proc Natl Acad Sci USA. 2013;110:10580–10585. doi: 10.1073/pnas.1309273110. [DOI] [PMC free article] [PubMed] [Google Scholar]
- 34.Rossy J, Owen DM, Williamson DJ, Yang Z, Gaus K. Conformational states of the kinase Lck regulate clustering in early T cell signaling. Nature Immunol. 2013;14:82–89. doi: 10.1038/ni.2488. [DOI] [PubMed] [Google Scholar]
- 35.Brian AA, McConnell HM. Allogeneic stimulation of cytotoxic T cells by supported planar membranes. Proc Natl Acad Sci USA. 1984;81:6159–6163. doi: 10.1073/pnas.81.19.6159. [DOI] [PMC free article] [PubMed] [Google Scholar]
- 36.Grakoui A, et al. The immunological synapse: a molecular machine controlling T cell activation. Science. 1999;285:221–227. doi: 10.1126/science.285.5425.221. [DOI] [PubMed] [Google Scholar]
- 37.Liu W, Won Sohn H, Tolar P, Meckel T, Pierce SK. Antigen-induced oligomerization of the B cell receptor is an early target of FcγRIIB inhibition. J Immunol. 2010;184:1977–1989. doi: 10.4049/jimmunol.0902334. [DOI] [PMC free article] [PubMed] [Google Scholar]
- 38.Jenkins MR, Tsun A, Stinchcombe JC, Griffiths GM. The strength of T cell receptor signal controls the polarization of cytotoxic machinery to the immunological synapse. Immunity. 2009;31:621–631. doi: 10.1016/j.immuni.2009.08.024. [DOI] [PMC free article] [PubMed] [Google Scholar]


