Abstract
The purpose of this study was to 1) develop and present a technique to quantitatively assess three-dimensional distribution and clustering of intramuscular fat and 2) use the technique to compare spatial characteristics of intramuscular fat in rotator cuff muscles of older adults with and without a supraspinatus tear. Moran’s Index (I), an existing quantitative measure of clustering, was extended for use with MRI to allow comparisons across individuals with different size muscles. Sixteen older adults (>60yrs) with (N=6) and without (N=10) a degenerative supraspinatus tear participated. Following 3D Dixon MRIs of the shoulder, which separates fat from water, rotator cuff muscles were segmented and sectioned and fat% and Moran’s I were calculated to assess distribution and clustering, respectively. Moran’s I ranged was 0.40–0.92 and 0.39–0.76 for the tear and control subjects, respectively. Compared to uninjured controls, tear subjects demonstrated increased fat distribution (p=0.036) and clustering (p=0.020) distally in the supraspinatus. Tear subjects had more pronounced distribution (p<0.001) and clustering distally (p<0.001) than proximally. Other rotator cuff muscles exhibited different patterns of fat clustering and distribution. This technique, which we applied to quantify spatial characteristics of intramuscular fat, can be applied to assess clustering of fat in other pathologies and tissues.
Key terms: rotator cuff tear, spatial characteristics of fat, MRI, Moran’s Index, fat percentage
Introduction
Increased intramuscular fat is a common sequelae of musculoskeletal and neuromuscular pathologies including healthy aging,1,24,36, stroke,28 muscle dystrophy,32 chronic obstructive pulmonary disease,25 and injuries to the spinal cord11 and rotator cuff.12 Increased cardiovascular risk,15 deficits in central muscle activation,39 and poor outcomes of rotator cuff surgery16 are all associated with increased intramuscular fat levels. Intramuscular fat reduces the proportion of the muscle belly containing contractile tissue, limiting overall force-generating capacity,18 and has been independently correlated to declines in strength and function beyond losses to muscle volume.36 Further, the positive effects of resistance training are mitigated by the presence of intramuscular fat.21 Quantitative measures of intramuscular fat in humans have traditionally been estimated using only a portion of the muscle (e.g. a single image slice) and are represented as a perceived proportion of fat or an average percentage acquired from an isolated region.12,18,21,22
An increase in the level of intramuscular fat following a tear of one or more rotator cuff tendons (supraspinatus, infraspinatus, subscapularis, and teres-minor) is particularly problematic in light of its association with negative consequences following surgical intervention.12 Clinicians employ semi-quantitative metrics to rate the amount of intramuscular fat, such as the Goutallier score for rotator cuff tears,12 which are limited by intra- and inter-observer error.16 Because current techniques used to examine the rotator cuff only use a small region of the muscle,12,23 information regarding characteristics of the fat morphology throughout muscle is limited. Previous quantitative measurements in isolated muscle regions using animal models14,26,27,29 and qualititative observations in human subjects2 suggest that volumetric distribution and spatial clustering of intramuscular fat vary throughout a given rotator cuff muscle. However, these quantities have not been quantified in human muscle, and no method has been described that quantifies both volumetric distribution and spatial clustering continuously throughout the entire muscle belly in either animals or humans. Such information would be valuable for discerning whether specific injuries or pathologies alter the spatial characteristics of fat within the muscle, and where within the muscle such alterations occur. In addition, the distribution of fat and the way it is clustered within the muscle may alter the way in which forces are transmitted through the muscle-tendon unit,35 and may have physiological implications for the processes by which intramuscular fat develops.
Although there does not currently exist any method to quantify spatial clustering of fat throughout the entire muscle belly, Moran’s Index (I) presents a promising tool to accomplish this quantification. Moran’s I is a measure of spatial autocorrelation that extends Pearson’s correlation coefficient into multiple dimensions to account for spatial variations.4,20 Moran’s I has been used to validate clustering of brain networks7 and quantify clustering of lesions associated with failure of Transanal Endoscopic Microsurgery.8 However, in its current form, Moran’s I cannot be directly applied to compare datasets of differing sizes with spatially adjacent nodes, such as imaging data describing intramuscular fat. Extending Moran’s I for use with MRI would provide quantitative clustering information that is not currently obtainable.
The goals of this study were: 1) to develop and present a new technique to quantify volumetric distribution and spatial clustering of fat within muscle tissue; and 2) apply this technique to determine if a degenerative supraspinatus tear in older adults alters the spatial characteristics of intramuscular fat in rotator cuff muscles compared to uninjured older adults. It is hypothesised that older adults with a degenerative supraspinatus tear will have different patterns of volumetric distribution and spatial clustering compared to the uninjured control subjects.
Methods
We describe our approach, which extends previously validated techniques, in three parts: 1) extension of Moran’s I to quantify clustering, 2) calculation of fat% and Moran’s I within each muscle section, and 3) the statistical model used to evaluate the pattern of distribution and clustering. Subject demographics and imaging protocols are also described below.
Spatial clustering methodology
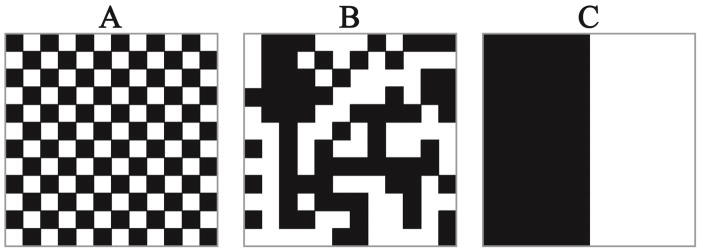
Moran’s I is a previously developed and validated mathematical tool to quantify spatial clustering. We extended the formulation of Moran’s I to allow comparison of spatial clustering of intramuscular fat across data sets of differing sizes. Moran’s I ranges from −1 to 1, where −1 indicates 100% diffuse, 1 indicates complete clustering, and 0 indicates a random spatial configuration (Figure 1).
Figure 1.
A: Moran’s I = −1, B: Moran’s I ~ 0, C: Moran’s I = 1. Each of the images has exactly 50% of the pixels black and 50% of the pixels white. Moran’s I gives a quantitative value of the spatial autocorrelation of the black pixels in the images that cannot be accurately determined by a total percentage. Moran’s I below 0 indicates a diffuse pattern of fat and Moran’s I above 0 indicates a clustered pattern of fat. Values of Moran’s I closer to −1 and 1 are more diffuse and clustered, respectively, than values closer to 0.
The calculation of Moran’s I uses the following approach.4 Given a network of size n (number of voxels within a muscle or muscle section) with measurable variables xi (fat%), a vector x containing the measurable variable is created.
| Equation 1 |
Average (μ) and standard deviation (σ) of the values of x are defined. The standard formulation of Moran’s I is then given by Equation 2, where vij represents a measure used to judge the degree of nearness between locations i and j. We used the Euclidian distance between the two points.
| Equation 2 |
We implemented the matrix formulation of Moran’s I in this work (Equations 3–6).4
| Equation 3 |
| Equation 4 |
| Equation 5 |
| Equation 6 |
Extension of Moran’s Index for quantifying spatial clustering of intramuscular fat
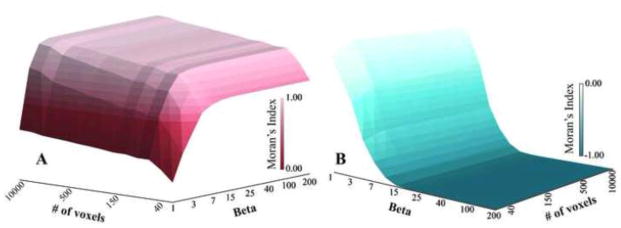
To appropriately compare Moran’s I across muscles and segments containing different numbers of voxels, it was critical to ensure that the range of possible Moran’s I values were consistent for all segments. Because both the number of voxels (n) in a particular region of interest (i.e. the muscle or muscle section) and β could affect the maximum and minimum potential values for the Moran’s I calculation (Figure 2), values for β were determined to ensure that the range of Moran’s I was consistent. Typically, β=1 when implementing the weighting methodology we applied here (Vij−β) (cf. Equation 6). This allows for spatial weights to be based purely on Euclidian distance and represents a more global measure of spatial clustering.3 As β increases, the calculation of Moran’s I becomes more of a local measure of spatial clustering3 which may not be appropriate in other spatial applications in which Moran’s I is commonly used. To calculate an appropriate β value for application to imaging analysis, we constructed two matrices M1 and M2 with a total number of cells s. M1 represented the checker board condition and M2 represented the black and white divided condition (Figure 1), such that when Moran’s I was calculated it should equal −1 and 1 for M1 and M2, respectively (Figure 2). We varied s from 20 to 10,000 (a lower limit for voxel count in a muscle section), and β was varied from 1 to 200. Moran’s I was calculated for each s by β combination to determine how close the calculations were to the expected values of −1 and 1 for M1 and M2, respectively (Figure 2). From this analysis, it was determined that a value of β = 200 allows for the range of possible Moran’s I to be consistent regardless of voxel count (Figure 2), enabling comparison between subjects and muscles regardless of muscle size.
Figure 2.
Surface plots of the maximum (A) and minimum (B) Moran’s I that can be reached given the number of voxels and the value for β. Setting β = 200 for the calculations of Moran’s I in this study, ensures that Moran’s I has the ability to reach −1 and be as close to 1 as possible regardless of muscle volume.
Subject population
A total of 16 older adults – 6 (63.8 ± 1.1 years) with a magnetic resonance imaging (MRI) confirmed supraspinatus tear (RCT) and 10 (63.5 ± 1.7 years) uninjured controls - were recruited from the local community (Table 1). This study was approved by the Wake Forest Baptist Health Institutional Review Board and all subjects provided informed consent. Inclusion criteria for the participants were 1) age > 60 years old, 2) no contraindication to undergoing an MRI scan, and 3) no history of neuromuscular disorder or other injury that might affect the upper limb, such as stroke, Parkinson’s disease, spinal cord injury, or confinement to a wheelchair. RCT subjects must not have had previous surgery or history of prior injury on the affected shoulder. Control subjects were screened for an asymptomatic rotator cuff tear with a telephone questionnaire to ensure there was no history of injury and a modified Jobe’s test9 was performed prior to imaging.
Table 1.
Demographics for rotator cuff tear (RCT) and control subjects.
| Group | Sex | Age (years) | Height (cm) | Body mass (kg) |
|---|---|---|---|---|
|
| ||||
| RCT | Male | 64 | 183 | 108.0 |
| RCT | Male | 64 | 150 | 88.5 |
| RCT | Male | 62 | 160 | 95.3 |
| RCT | Female | 65 | 150 | 53.5 |
| RCT | Female | 63 | 160 | 73.5 |
| RCT | Female | 65 | 163 | 65.8 |
| Control | Male | 64 | 173 | 70.3 |
| Control | Male | 61 | 178 | 99.8 |
| Control | Male | 64 | 183 | 86.2 |
| Control | Male | 62 | 173 | 73.5 |
| Control | Male | 61 | 175 | 70.3 |
| Control | Female | 64 | 152 | 74.8 |
| Control | Female | 63 | 173 | 54.4 |
| Control | Female | 67 | 173 | 70.8 |
| Control | Female | 65 | 163 | 65.8 |
| Control | Female | 64 | 160 | 60.3 |
Magnetic resonance imaging protocol
All study participants underwent an MRI on a 3T Skyra scanner (Siemens Munich, Germany). Participants were scanned in a supine position using the 18 channel body matrix coil. The affected shoulder was evaluated for the patient group, while the dominant shoulder was evaluated for the control group. MR images were acquired using the standard Dixon imaging sequence38 available on the scanner. Voxel dimensions were 1mm × 1mm × 1mm. The Dixon technique allowed the signal for each voxel to be separated into signal intensity from fat (SIfat) and signal intensity from water (SIwater), from which a fat% is calculated for each voxel (Equation 7).
| Equation 7 |
Signal-to-noise ratio17 and random noise10 corrections were made offline within Matlab (The Mathworks, Natick, MA) using standard techniques.34 The anatomical boundaries of the supraspinatus infraspinatus, subscapularis, and teres minor were manually segmented (3D-Doctor, Able Software Corp., Lexington, MA) on every image slice using methods previously described.13,33
Voxel segmentation
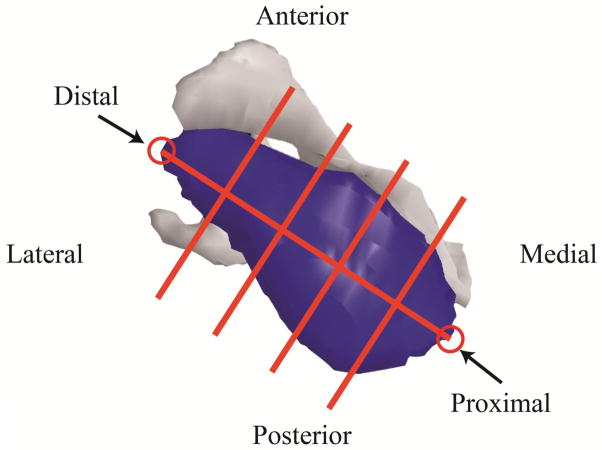
We determined the volumetric distribution and spatial clustering of fat within the muscles using a custom Matlab script. Manually segmented muscle boundaries were used to identify the image voxels within a given muscle. For voxels on the muscle boundary, an entire voxel was considered to be within the boundary (i.e. part of the muscle) if the center of the voxel was within the segmented boundary. The most proximal and distal points of the muscle were manually selected and the muscles were divided into sections along the line connecting proximal and distal points to determine volumetric distribution and spatial clustering of fat. The supraspinatus, infraspinatus, and subscapularis muscles were divided into 5 equal length sections (Figure 3). Teres minor was divided into three sections due to its small volume. Volumetric distribution of fat was represented by the percentage of volume occupied by fat for each section. Fat% for each section was calculated as the average fat% across voxels contained in a given section.
Figure 3.
A supraspinatus divided into five sections. A line connecting the most proximal and most distal points was then divided into 5 equal length segments. Planes perpendicular to the line at the ends of each segment were used to separate the muscle into 5 equal length sections. Voxels were assigned to each section based on their locations relative to the dividing planes. Using this same approach, infraspinatus and subscapularis were divided into five sections, while teres minor was divided into three sections, due to its small size.
Statistical analysis
To evaluate the volumetric distribution of intramuscular fat within each rotator cuff muscle and the effect of tear status (group), we created a generalized linear model for each of the four muscles in which fat% of each section was the dependent variable. An initial model was created that included the effects of group and section and the interaction of group and section. If the interaction was found to be significant, the RCT and control groups were separated and regression analyses were performed for each group separately, with section as the independent variable. If the interaction effect was not significant, it was removed from the model and the regression analysis was performed again. The same analysis technique was performed for spatial clustering of intramuscular fat with Moran’s I of each section being used as the dependent variable. To evaluate correlation between Moran’s I and fat% for all sections from all muscles, we used a linear regression analysis. Holm-sequential Bonferroni correction was performed for all follow-up analyses, with overall significance set to p<0.05. All statistical analyses were performed using SAS (Cary, NC).
Results
Volumetric distribution
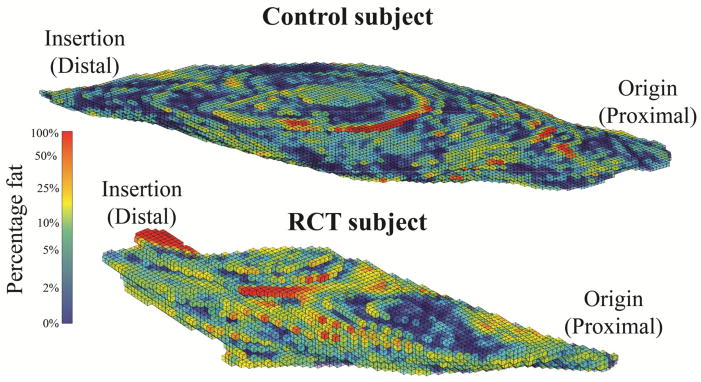
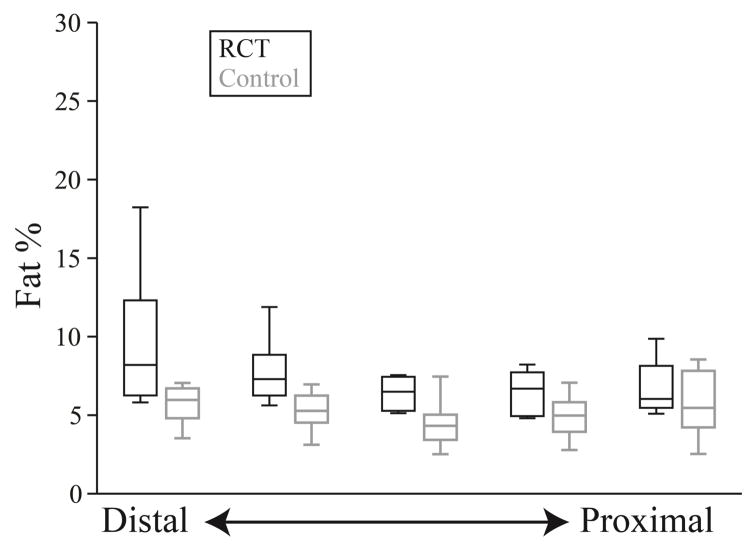
Fat distribution and spatial clustering within the supraspinatus - the muscle with tendon tear - differed between groups (Figure 4). Average fat% within all sections of the supraspinatus ranged from 4.8% to 18.2% for RCT subjects and from 2.5% to 8.5% for the control subjects (Table 2). The interaction between group and section for fat% was significant for the supraspinatus (p=0.036) (Figure 5), indicating that the two groups should be considered separately. The control group exhibited no dependence of fat% on distal-proximal section, indicating that the volumetric distribution of intramuscular fat is consistent across the supraspinatus (p=0.910). However, for those with a torn supraspinatus tendon, fat% was increased in distal sections closer to the location of the tear (p<0.001).
Figure 4.
A representative supraspinatus muscle from a control subject and a rotator cuff tear (RCT) subject demonstrating fat% for each voxel. Rotator cuff tears are located at the distal end. The RCT subjects exhibited a distinct volumetric distribution with fat% decreasing from distal to proximal, but this was not observed in the control subjects.
Table 2.
Maximum, minimum, and median fat% and Moran’s Index for each section.
Figure 5.
Fat% within each section of the supraspinatus for both the rotator cuff tear subjects (RCT) (black) and control (gray) subjects. Intramuscular fat has a homogenous volumetric distribution in the control subjects (p=0.910), but increases distally in the RCT group (p<0.001).
Group by section interaction was not significant for the infraspinatus (p=0.433) or subscapularis (p=0.852) but was significant for teres minor (p=0.034). Section was not significant for the infraspinatus (p=0.132) indicating consistent volumetric distribution across the muscle. Section was significant for subscapularis (p<0.001), with increasing fat% from the distal to the proximal portion of the muscle, the reverse of the pattern seen in the supraspinatus. Section was not significant for either the control (p=0.711) or rotator cuff tear groups (p=0.075) for the teres minor, indicating no significant pattern of volumetric distribution.
Spatial clustering
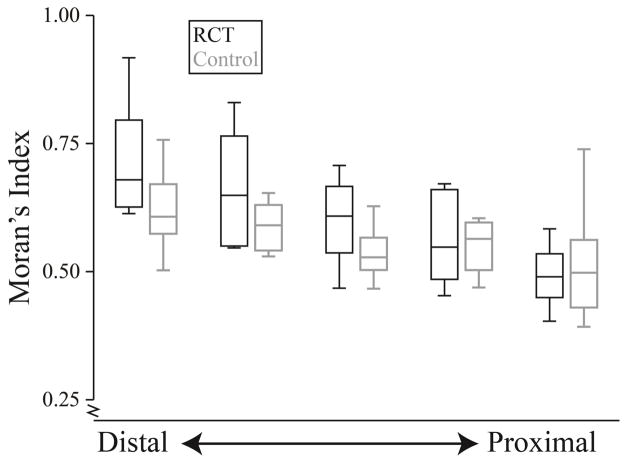
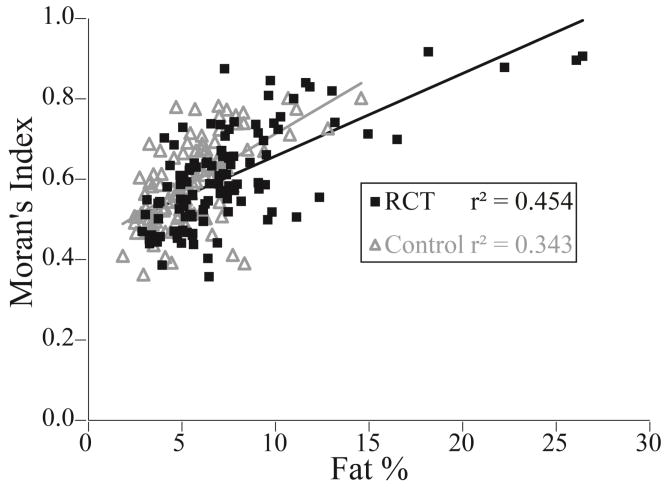
All muscle sections from all subjects had values of Moran’s I above 0.39, indicating that intramuscular fat tends to be more clustered than a random configuration (Table 2). In the supraspinatus, Moran’s I ranged from 0.40 to 0.92 for RCT subjects and from 0.39 to 0.76 for the control subjects (Table 2). Group by section was signficant for the supraspinatus (p=0.020); both RCT (p<0.001) and control subjects (p=0.001) demonstrated increased spatial clustering (Moran’s I) distally, toward the torn tendon (Figure 6). For infraspinatus (p=0.109), subscapularis (p=0.699), and teres minor (p=0.166), there was no significant group by section interaction effect. Similar to the supraspinatus, spatial clustering increased from proximal to distal in the infraspinatus (p=0.007); in contrast, the subscapularis exhibited spatial clustering increasing from distal to proximal (p<0.001). Teres minor did not exhibit a marked difference in spatial clustering with muscle section (p=0.050). Correlation between Moran’s I and fat% for the RCT and control groups were r2 = 0.454 (p<0.001) and r2 = 0.343 (p<0.001) respectively (Figure 7). Muscle sections with similar fat values (within 0.5%) had variable Moran’s I (range as much as 0.43). Similarly, sections with similar Moran’s I value (within 0.05) had variable fat% (range up to 19.1%).
Figure 6.
Moran’s Index for each section of the supraspinatus for the rotator cuff tear subjects (RCT) (black) and control (gray) subjects. Intramuscular fat is more clustered in the more distal portions of the muscle than the proximal portions for the control (p=0.001) and the RCT groups (p<0.001). However, the RCT group demonstrates a greater increase in spatial clustering from the proximal to distal portion than the control group (p<0.001).
Figure 7.
Moran’s Index versus fat% for each section of all muscles for the rotator cuff tear (RCT) subjects (black) (p<0.001) and control (gray) subjects (p<0.001). Poor fit between the two measures reveals that volumetric distribution and spatial clustering provide different information regarding the spatial characteristics of intramuscular fat.
Discussion
Here we demonstrated the altered spatial characteristics of intramuscular fat in the rotator cuff after an RCT using a new technique which extends existing validated approaches for describing spatial characteristics of three dimensional data. We developed an implementation allowing the specific application of analysis of imaging data wherein datasets of different sizes must be compared, permitting a quantitative measure of spatial clustering of fat within the entire muscle belly. We demonstrated the application of this approach, which revealed that both the volumetric distribution and spatial clustering of intramuscular fat within the torn supraspinatus are more pronounced in the distal end near the supraspinatus tendon tear. These data also suggest that patterns of fat differ across muscles; for example, the subscapularis exhibited fat distribution and clustering that was pronounced at the proximal end of the muscle in all subjects. High levels of intramuscular fat may reduce the overall amount of contractile tissue available to produce force, while different patterns of clustering may influence the way in which force propagates throughout the muscle tissue.35 Low correlation between Moran’s I and fat% indicate that the measures offer different information regarding the spatial characteristics of intramuscular fat and both features should be examined.
The supraspinatus fat distribution patterns shown in this study are consistent with results seen in animal models of rotator cuff tears, in which increased fat% in the distal portion of the muscle has been observed following an inflicted tear of the corresponding tendon.14,26,27,29 However, the animal studies measured fat% using a small number of histological slices. Complete spatial information regarding the location of intramuscular fat within the whole muscle is unavailable with a histological approach limited to a small number of slices. Additionally, no prior studies in animals considered spatial clustering of intramuscular fat. Future animal studies should consider applying the methodology presented here; the fat% and Moran’s I values that were present for human muscle may provide a baseline for animal model validation where intramuscular fat is of interest.
The current study provides quantitative confirmation of prior qualitative descriptions of distal clustering of intramuscular fat within the supraspinatus of patients with chronic rotator cuff tears.2 However, the approach presented here provide a robust and repeatable measure of intramuscular fat clustering compared to the qualitative method employed by the previous study, which relied on clinician interpretations of two parasagittal MRI slices. Other qualitative findings in the prior work differ from the results reported here. For example, the previous study did not observe increased clustering distally in the infraspinatus following a rotator cuff tear,2 which may be the result of differing patient populations and tear characteristics. The same study did report increased clustering distally in the subscapularis in 54% of patients with subscapular neuropathy. These discrepancies support our conclusion that patterns of intramuscular fat may differ among muscles and for different pathologies. In addition, the qualitative approach from the previous work may not have been able to detect differences even if they existed due to the paucity of information provided by only two images.
Current biological explanations for progression of intramuscular fat within the supraspinatus suggest that it originates from the distal portion of the supraspinatus; this is consistent with the results of the current study.14 It has been suggested that the musculo-tendinous junction might be abundant in pluripotent stem cells, which could be causing the increased gene expression and adipogenic markers distally.14 Interestingly, expression of myogenic and adipogenic genes was variable with regard to injury type and severity.6 For example, myogenic gene expression was upregulated in patients with bursitis and tendinopathy but down regulated in patients with massive tendon tears, while adipogenic gene expression was upregulated in patients with a full-thickness tear but down regulated in patients with massive tears. Future work should consider using the quantitative metrics described in this study to probe gross differences in intramuscular fat due to these differing patterns of gene expression.
The mechanism driving higher proportion and clustering of intramuscular fat near the injured supraspinatus tendon is currently unclear. Two common explanations for increases in intramuscular fat in rotator cuff muscles are fatty infiltration and fatty degeneration. Fatty infiltration suggests fat “infiltrates” from outside the muscle belly and occupies intramuscular pockets created as muscle architecture changes following a rotator cuff tear.19 Fatty degeneration suggests myoblasts trans-differentiate into PPARγ (proliferator-activated receptor γ), which express adipocytes.14 Although both mechanisms offer explanations for increased proportion of intramuscular fat, neither directly explains fat clustering. Recent work suggests a third possibility, that muscle tissue is atrophying around existing fat deposits, leading to an apparent increase in proportion of fat without a corresponding increase in total fat content.34 Additional research into the mechanisms resulting in both increased levels and clustering of intramuscular fat distally is needed.
Fat patterns in the infraspinatus, subscapularis, and teres minor differed from that of the supraspinatus. There were also limited differences between RCT and control subjects for these muscles. While infraspinatus overall had more clustering distally like the supraspinatus, the subscapularis had both higher fat content and more clustering proximally. Tears of the infraspinatus, subscapularis, and teres minor were not controlled for in this study, which may provide some explanation for these differences. The small subject population inhibited the ability to control for these tears in the statistical analyses. In addition, despite a common insertion tendon for the rotator cuff muscle-tendon units,31 these muscles have substantially different muscle architecture,37 which may influence their mechanosensitivity.6 These muscles also have differing gene expressions,30 suggesting that other inherent factors may contribute to the differences in fat distribution and clustering in the rotator cuff, which should be explored further.
These findings are also pertinent clinically, as they may provide guidance as to where in the muscle fat content should be evaluated for specific muscles when making treatment planning decisions, since high fat content is typically a contraindication for surgical repair of tendon and is associated with higher failure rates following repair.5,12 An important consideration concerning this methodology is that the current segmentation and data processing takes in excess of 10 person-hours per subject and therefore is not a practical approach for clinicians making patient-related decisions. Automatic segmentation of muscle boundaries would reduce processing time to make this methodology clinically viable. Work is currently underway to automate the segmentation process. One recent study suggests that standard approaches for selecting imaging planes for clinical scoring of intramuscular fat resulted in scores that were not significantly associated with fat percentage measured from the entire muscle belly.34 However, the current work provides a foundation for improved selection of appropriate slices for clinical evaluation that may be sufficient to fully comprehend the full spatial characteristics of intramuscular fat.
Limitations
There are several limitations to this work which should be considered. We demonstrated the application of a new three-dimensional method to analyze the spatial characteristics of intramuscular fat throughout the entire muscle belly in a small cohort of older adults with and without degenerative rotator cuff tears. The specific conclusions regarding fat patterns exhibited by this group may have limited generalizability to other age groups, traumatic tears of the rotator cuff, and other pathological changes to muscle. We defined proximal to distal sections using equal length segments. Other methods for sectioning the muscles, including anatomical landmarks such as the scapula and humerus should be considered, especially for clinical applications.
The analysis methods described here depend on the accuracy of the input data. It also requires that the Euclidian distance between adjacent nodes must be identical for all nodes in the set to compare clustering values on the same scale. For example, a 3mm image slice thickness would reduce the magnitude of clustering values compared to 1mm slice of the same data. However, relative clustering across specimens all scanned using the same size voxel would be consistent, no matter the scanning resolution chosen. An advantage to current implementation is that it does not require datasets of equal total size (number of voxels) for comparison across muscles, and can be generally applied to any three-dimensional dataset from any imaging or histological method that has spatial characteristics. For example, it is not restricted to use with the specific MR sequence used in this study; rather other sequences (e.g. T2 weighting to capture fibrosis or scarring) or modalities (e.g. CT) are appropriate for use with the analysis as long as nodal information is provided with equal spacing. These extensions increase the utility of this technique for application to biological data.
Conclusion
The new approach proposed here quantitatively describes the three-dimensional spatial characteristics of intramuscular fat. This is achieved by providing a quantitative measure of volumetric distribution and for the first time, a quantitative measure of spatial clustering. Spatial clustering was calculated by extending the formulation of Moran’s Index, a commonly implement mathematical technique, to permit analysis of datasets with adjacent data nodes and comparison of differently sized datasets. We have demonstrated the utility of the approach in conjunction with MR images to produce three-dimensional descriptions of intramuscular fat morphology and the influence of fat presentation after a rotator cuff tear. It was determined that older adults with a degenerative supraspinatus tendon tear have more fat that is more clustered in the distal portion of the supraspinatus compared to uninjured older adults. The approach described here is applicable to other pathologies which may demonstrate spatial characteristics within biological tissues.
Acknowledgments
Support for the research presented within this publication was supported by the Wake Forest University Claude D. Pepper Older Americans Independence Center (#P30 AG021332), the National Science Foundation (#1405246), the National Institute on Aging of the National Institutes of Health (#F31 AG040921), the Wake Forest University Center for Biomolecular Imaging, and the Wake Forest School of Medicine Translational Science Institue Clinical Research Unit.
Footnotes
Conflicts of Interest
We declare that author MTF serves as a consultant for Smith and Nephew; it does not represent a conflict of interest and no financial remuneration was received related to the work described in this manuscript. Author CJT has an ownership interest in a medical device measuring tension in rotator cuff tendon repairs with research applications; participation with device development and testing is outside the scope of this manuscript and does not represent a conflict of interest. No other potential conflicts of interest exist.
References
- 1.Ashry R, Schweitzer ME, Cunningham P, Cohen J, Babb J, Cantos A. Muscle atrophy as a consequence of rotator cuff tears: should we compare the muscles of the rotator cuff with those of the deltoid? Skeletal Radiol. 36:841–845. doi: 10.1007/s00256-007-0307-5. [DOI] [PubMed] [Google Scholar]
- 2.Beeler S, Ek ET, Gerber C. A comparative analysis of fatty infiltration and muscle atrophy in patients with chronic rotator cuff tears and suprascapular neuropathy. J Shoulder Elbow Surg. 2013 doi: 10.1016/j.jse.2013.01.028. [DOI] [PubMed] [Google Scholar]
- 3.Chen Y. On the four types of weight functions for spatial contiguity matrix. Letters in Spatial and Resource Sciences. 2012;5:65–72. [Google Scholar]
- 4.Chen YG. New Approaches for Calculating Moran’s Index of Spatial Autocorrelation. PLoS One. 2013;8 doi: 10.1371/journal.pone.0068336. [DOI] [PMC free article] [PubMed] [Google Scholar]
- 5.Cho NS, Yi JW, Lee BG, Rhee YG. Retear patterns after arthroscopic rotator cuff repair: single-row versus suture bridge technique. Am J Sports Med. 2010;38:664–671. doi: 10.1177/0363546509350081. [DOI] [PubMed] [Google Scholar]
- 6.Choo A, McCarthy M, Pichika R, Sato EJ, Lieber RL, Schenk S, Lane JG, Ward SR. Muscle gene expression patterns in human rotator cuff pathology. J Bone Joint Surg Am. 2014;96:1558–1565. doi: 10.2106/JBJS.M.01585. [DOI] [PMC free article] [PubMed] [Google Scholar]
- 7.Derado G, Bowman FD, Ely TD, Kilts CD. Evaluating Functional Autocorrelation within Spatially Distributed Neural Processing Networks. Stat Interface. 2010;3:45–58. doi: 10.4310/sii.2010.v3.n1.a4. [DOI] [PMC free article] [PubMed] [Google Scholar]
- 8.Garb JL, Ganai S, Skinner R, Boyd CS, Wait RB. Using GIS for spatial analysis of rectal lesions in the human body. Int J Health Geogr. 2007;6:11. doi: 10.1186/1476-072X-6-11. [DOI] [PMC free article] [PubMed] [Google Scholar]
- 9.Gillooly JJ, Chidambaram R, Mok D. The lateral Jobe test: A more reliable method of diagnosing rotator cuff tears. Int J Shoulder Surg. 2010;4:41–43. doi: 10.4103/0973-6042.70822. [DOI] [PMC free article] [PubMed] [Google Scholar]
- 10.Gold GE, Han E, Stainsby J, Wright G, Brittain J, Beaulieu C. Musculoskeletal MRI at 3.0 T: relaxation times and image contrast. AJR Am J Roentgenol. 183:343–351. doi: 10.2214/ajr.183.2.1830343. [DOI] [PubMed] [Google Scholar]
- 11.Gorgey AS, Dudley GA. Skeletal muscle atrophy and increased intramuscular fat after incomplete spinal cord injury. Spinal Cord. 2007;45:304–309. doi: 10.1038/sj.sc.3101968. [DOI] [PubMed] [Google Scholar]
- 12.Goutallier D, Postel JM, Bernageau J, Lavau L, Voisin MC. Fatty muscle degeneration in cuff ruptures. Pre- and postoperative evaluation by CT scan. Clin Orthop Relat Res. 1994:78–83. [PubMed] [Google Scholar]
- 13.Holzbaur KR, Murray WM, Gold GE, Delp SL. Upper limb muscle volumes in adult subjects. J Biomech. 2007;40:742–749. doi: 10.1016/j.jbiomech.2006.11.011. [DOI] [PubMed] [Google Scholar]
- 14.Itoigawa Y, Kishimoto KN, Sano H, Kaneko K, Itoi E. Molecular mechanism of fatty degeneration in rotator cuff muscle with tendon rupture. J Orthop Res. 2011;29:861–866. doi: 10.1002/jor.21317. [DOI] [PubMed] [Google Scholar]
- 15.Kovanlikaya A, Mittelman SD, Ward A, Geffner ME, Dorey F, Gilsanz V. Obesity and fat quantification in lean tissues using three-point Dixon MR imaging. Pediatr Radiol. 2005;35:601–607. doi: 10.1007/s00247-005-1413-y. [DOI] [PubMed] [Google Scholar]
- 16.Lippe J, Spang JT, Leger RR, Arciero RA, Mazzocca AD, Shea KP. Inter-rater agreement of the Goutallier, Patte, and Warner classification scores using preoperative magnetic resonance imaging in patients with rotator cuff tears. Arthroscopy. 2012;28:154–159. doi: 10.1016/j.arthro.2011.07.016. [DOI] [PubMed] [Google Scholar]
- 17.Liu CY, McKenzie CA, Yu H, Brittain JH, Reeder SB. Fat quantification with IDEAL gradient echo imaging: correction of bias from T(1) and noise. Magn Reson Med. 2007;58:354–364. doi: 10.1002/mrm.21301. [DOI] [PubMed] [Google Scholar]
- 18.Marcus RL, Addison O, Kidde JP, Dibble LE, Lastayo PC. Skeletal muscle fat infiltration: impact of age, inactivity, and exercise. J Nutr Health Aging. 2010;14:362–366. doi: 10.1007/s12603-010-0081-2. [DOI] [PMC free article] [PubMed] [Google Scholar]
- 19.Meyer DC, Hoppeler H, von Rechenberg B, Gerber C. A pathomechanical concept explains muscle loss and fatty muscular changes following surgical tendon release. J Orthop Res. 2004;22:1004–1007. doi: 10.1016/j.orthres.2004.02.009. [DOI] [PubMed] [Google Scholar]
- 20.Moran PA. Notes on continuous stochastic phenomena. Biometrika. 37:17–23. [PubMed] [Google Scholar]
- 21.Nicklas BJ, Chmelo E, Delbono O, Carr JJ, Lyles MF, Marsh AP. Effects of resistance training with and without caloric restriction on physical function and mobility in overweight and obese older adults: a randomized controlled trial. Am J Clin Nutr. 2015 doi: 10.3945/ajcn.114.105270. [DOI] [PMC free article] [PubMed] [Google Scholar]
- 22.Noble JJ, Charles-Edwards GD, Keevil SF, Lewis AP, Gough M, Shortland AP. Intramuscular fat in ambulant young adults with bilateral spastic cerebral palsy. BMC Musculoskelet Disord. 2014;15:236. doi: 10.1186/1471-2474-15-236. [DOI] [PMC free article] [PubMed] [Google Scholar]
- 23.Oh JH, Kim SH, Choi JA, Kim Y, Oh CH. Reliability of the grading system for fatty degeneration of rotator cuff muscles. Clin Orthop Relat Res. 468:1558–1564. doi: 10.1007/s11999-009-0818-6. [DOI] [PMC free article] [PubMed] [Google Scholar]
- 24.Rice CL, Cunningham DA, Paterson DH, Lefcoe MS. Arm and leg composition determined by computed tomography in young and elderly men. Clin Physiol. 9:207–220. doi: 10.1111/j.1475-097x.1989.tb00973.x. [DOI] [PubMed] [Google Scholar]
- 25.Robles PG, Sussman MS, Naraghi A, Brooks D, Goldstein RS, White LM, Mathur S. Intramuscular Fat Infiltration Contributes to Impaired Muscle Function in COPD. Med Sci Sports Exerc. 2014 doi: 10.1249/MSS.0000000000000556. [DOI] [PubMed] [Google Scholar]
- 26.Rowshan K, Hadley S, Pham K, Caiozzo V, Lee TQ, Gupta R. Development of fatty atrophy after neurologic and rotator cuff injuries in an animal model of rotator cuff pathology. J Bone Joint Surg Am. 92:2270–2278. doi: 10.2106/JBJS.I.00812. [DOI] [PMC free article] [PubMed] [Google Scholar]
- 27.Rubino LJ, Stills HF, Jr, Sprott DC, Crosby LA. Fatty infiltration of the torn rotator cuff worsens over time in a rabbit model. Arthroscopy. 23:717–722. doi: 10.1016/j.arthro.2007.01.023. [DOI] [PubMed] [Google Scholar]
- 28.Ryan AS, Buscemi A, Forrester L, Hafer-Macko CE, Ivey FM. Atrophy and intramuscular fat in specific muscles of the thigh: associated weakness and hyperinsulinemia in stroke survivors. Neurorehabil Neural Repair. 25:865–872. doi: 10.1177/1545968311408920. [DOI] [PMC free article] [PubMed] [Google Scholar]
- 29.Safran O, Derwin KA, Powell K, Iannotti JP. Changes in rotator cuff muscle volume, fat content, and passive mechanics after chronic detachment in a canine model. J Bone Joint Surg Am. 87:2662–2670. doi: 10.2106/JBJS.D.02421. [DOI] [PubMed] [Google Scholar]
- 30.Smith LR, Meyer G, Lieber RL. Systems analysis of biological networks in skeletal muscle function. Wiley Interdiscip Rev Syst Biol Med. 5:55–71. doi: 10.1002/wsbm.1197. [DOI] [PMC free article] [PubMed] [Google Scholar]
- 31.Sonnabend DH, Young AA. Comparative anatomy of the rotator cuff. J Bone Joint Surg Br. 91:1632–1637. doi: 10.1302/0301-620X.91B12.22370. [DOI] [PubMed] [Google Scholar]
- 32.Torriani M, Townsend E, Thomas BJ, Bredella MA, Ghomi RH, Tseng BS. Lower leg muscle involvement in Duchenne muscular dystrophy: an MR imaging and spectroscopy study. Skeletal Radiol. 41:437–445. doi: 10.1007/s00256-011-1240-1. [DOI] [PMC free article] [PubMed] [Google Scholar]
- 33.Vidt ME, Daly M, Miller ME, Davis CC, Marsh AP, Saul KR. Characterizing upper limb muscle volume and strength in older adults: a comparison with young adults. J Biomech. 45:334–341. doi: 10.1016/j.jbiomech.2011.10.007. [DOI] [PMC free article] [PubMed] [Google Scholar]
- 34.Vidt ME, Santago AC, II, Tuohy CJ, Poehling GG, Freehill MT, Kraft RA, Marsh AP, Hegedus EJ, Miller ME, Saul KR. Relationship of clinical and 3D measures of fatty infiltration in the rotator cuff. Arthroscopy In press. 2015 [Google Scholar]
- 35.Virgilio KM, Martin KS, Peirce SM, Blemker SS. Multi-scale models of skeletal muscle reveal the complex effects of muscular dystrophy on tissue mechanics and damage susceptibility. Interface focus. 2015 doi: 10.1098/rsfs.2014.0080. In Press. [DOI] [PMC free article] [PubMed] [Google Scholar]
- 36.Visser M, Goodpaster BH, Kritchevsky SB, Newman AB, Nevitt M, Rubin SM, Simonsick EM, Harris TB. Muscle mass, muscle strength, and muscle fat infiltration as predictors of incident mobility limitations in well-functioning older persons. J Gerontol A Biol Sci Med Sci. 60:324–333. doi: 10.1093/gerona/60.3.324. [DOI] [PubMed] [Google Scholar]
- 37.Ward SR, Hentzen ER, Smallwood LH, Eastlack RK, Burns KA, Fithian DC, Friden J, Lieber RL. Rotator cuff muscle architecture: implications for glenohumeral stability. Clin Orthop Relat Res. 448:157–163. doi: 10.1097/01.blo.0000194680.94882.d3. [DOI] [PubMed] [Google Scholar]
- 38.Wren TA, Bluml S, Tseng-Ong L, Gilsanz V. Three-point technique of fat quantification of muscle tissue as a marker of disease progression in Duchenne muscular dystrophy: preliminary study. AJR Am J Roentgenol. 2008;190:W8–12. doi: 10.2214/AJR.07.2732. [DOI] [PubMed] [Google Scholar]
- 39.Yoshida Y, Marcus RL, Lastayo PC. Intramuscular adipose tissue and central activation in older adults. Muscle Nerve. 2012;46:813–816. doi: 10.1002/mus.23506. [DOI] [PubMed] [Google Scholar]


