Abstract
Mechanical anisotropy is an important property of fibrous tissues; for example, the anisotropic mechanical properties of brain white matter may play a key role in the mechanics of traumatic brain injury (TBI). The simplest anisotropic material model for small deformations of soft tissue is a nearly incompressible, transversely isotropic (ITI) material characterized by three parameters: minimum shear modulus (μ), shear anisotropy (ϕ = μ1/μ − 1) and tensile anisotropy (ζ = E1/E2 − 1). These parameters can be determined using magnetic resonance elastography (MRE) to visualize shear waves, if the angle between the shear-wave propagation direction and fiber direction is known. Most MRE studies assume isotropic material models with a single shear (μ) or tensile (E) modulus. In this study, two types of shear waves, “fast” and “slow”, were analyzed for a given propagation direction to estimate anisotropic parameters μ, ϕ, and ζ in two fibrous soft materials: turkey breast ex vivo and aligned fibrin gels. As expected, the speed of slow shear waves depended on the angle between fiber direction and propagation direction. Fast shear waves were observed when the deformations due to wave motion induced stretch in the fiber direction. Finally, MRE estimates of anisotropic mechanical properties in turkey breast were compared to estimates from direct mechanical tests.
1. Introduction
Accurate characterization of soft tissue material properties is important to medical clinicians and researchers. The identification of parameters for soft tissue is especially relevant to traumatic brain injury (TBI) research, as it will enable more accurate mechanical modeling and simulation of TBI. Magnetic resonance elastography (MRE) is a technique for non-invasive estimation of material parameters in soft tissues. In MRE, shear waves are excited in the soft tissue; the resulting shear wave speed is measured and used to estimate material parameters.
MRE was originally developed using isotropic, elastic material models (Muthupillai and Ehman, 1996; Muthupillai et al., 1995) and similar isotropic, elastic or viscoelastic models have been used to characterize tissues such as liver (Asbach et al., 2008; Klatt et al., 2010a; Mariappan et al., 2009), breast (Sinkus et al., 2005), and brain (Atay et al., 2008; Clayton et al., 2011a; Feng et al., 2013a; Green et al., 2008; Johnson et al., 2013; Murphy et al., 2013; Sack et al., 2008). However, since biological tissue is often anisotropic (Feng et al., 2013b), techniques used in MRE should be extended to account for directionally-dependent material properties. Work has recently been published on anisotropic material models in three general categories: theoretical studies, ultrasound elastography studies (involving estimation of two or three parameters), and MRE studies involving estimation of two, three, or five or more parameters. Rouze et al. (2013) showed agreement between predictions of a three-parameter, incompressible, transversely isotropic (ITI) theory and a finite element model. Royer et al. (2011) outlined an incompressible, transversely isotropic (ITI) model and approach for ultrasound elastography. Gennisson et al. (2003) also using ultrasound elastography, studied transversely isotropic phantoms and measured shear moduli parallel and perpendicular to the fibers. Other recent ultrasound studies (Aristizabal et al., 2014; Wang et al., 2013) describe two different shear-wave speeds in transversely isotropic phantoms.
Anisotropic MRE has most commonly been used to estimate two elastic parameters: the shear moduli governing shear in planes parallel and perpendicular to the fiber direction. Such studies have been performed by Sinkus et al. (2005) (breast tissue); Green et al. (2013), Klatt et al. (2010b), Papazoglou et al. (2006), Qin et al. (2014, 2013) (muscle tissue); Qin et al. (2013) (anisotropic phantoms); and Namani et al. (2009) (aligned fibrin gels). MRE can also be used to estimate three parameters for ITI material models (Feng et al., 2013b; Guo et al., 2015) and five parameters for general TI material models, or more for general orthotropic models (Romano et al., 2012). Papazoglou et al. (2006) derived a three parameter model for skeletal muscle tissue and an approach for estimation, though only two shear moduli were reported. Feng et al. (2013b) demonstrated that at least three elastic parameters are required to describe white matter in the brain because of anisotropy in shear and tensile moduli. Romano et al. (2012) identified five parameters in brain white matter (corticospinal tracts) with the application of spatial-spectral filters and Helmholtz decomposition to separate shear and pressure waves in a waveguide. These authors also applied their technique to patients with amyotrophic lateral sclerosis (Romano et al., 2014). Guo et al. (2015) recently measured three parameters in skeletal muscle by inverting the curl field measured by MRE. Tweten et al. (2015) showed by simulation that two types of shear waves must exist, with propagation of both waves in different directions, in order to estimate accurately the three material parameters.
While these recent studies have illustrated the plausibility of different approaches to estimate parameters for TI material models, several key issues remain to be addressed. In most studies, the performance of the anisotropic inversion algorithm has not been validated, either by using data from simulations or from phantoms with known anisotropic properties. The notable exception is the study of (Qin et al., 2013), which found close agreement between MRE and direct measurements of shear anisotropy. Most importantly, in prior experimental work, the criterion that both slow (pure transverse, or PT) and fast shear (quasi-transverse, or QT) waves must be present (at significant amplitudes, with multiple directions) in the estimation region in order to estimate accurately all three ITI parameters (Tweten et al., 2015) was not explicitly met. Many studies did not take into account the effects of tensile moduli on the fast shear-wave speed. In this study, we explicitly separate wave fields into fast and slow components in multiple propagation directions. We estimate the two separate wave speeds occurring in transversely isotropic soft tissues and show how these wave speeds can be used to estimate the three elastic material parameters for a linear ITI model.
2. Methods
2.1 Theory: fast and slow shear-wave speeds in elastic, incompressible, transversely isotropic materials
In a linear ITI material model, there are three independent material parameters: shear modulus μ, shear anisotropy ϕ = μ1/μ − 1, and tensile anisotropy ζ = E1/E2 − 1 (other parameters, which are linear combinations of these, can also be chosen; see Appendix A). “Slow” (PT) shear waves in ITI materials exhibit displacements perpendicular to both the wave propagation direction, n, and the normal to the plane of isotropy (nominally the fiber direction), a. The unit vector in the direction of displacement, or polarization direction, of the slow wave can be shown to be (Appendix A; also see Rouze et al., 2013; Tweten et al., 2015):
| [1] |
(The special case when n and a are parallel, is discussed below). Since the slow shear-wave polarization is always perpendicular to the fiber direction, it does not stretch the fibers and wave speed depends only on the baseline shear modulus, μ, shear anisotropy, ϕ, and the angle, θ, between n and a (Appendix A):
| [2] |
The polarization direction of a “fast” (QT) shear wave is perpendicular to both the propagation direction and the slow shear wave polarization direction and lies in the plane defined by n and a (Appendix A; also Rouze et al., 2013; Tweten et al., 2015):
| [3] |
Fig. 1 shows the relationship between ms, mf, n and a. Deformations associated with fast shear waves induce stretch in the fiber direction, and the speed of the fast shear wave thus depends on the tensile anisotropy, ζ (Appendix A; also Tweten et al., 2015):
| [4] |
Figure 1.
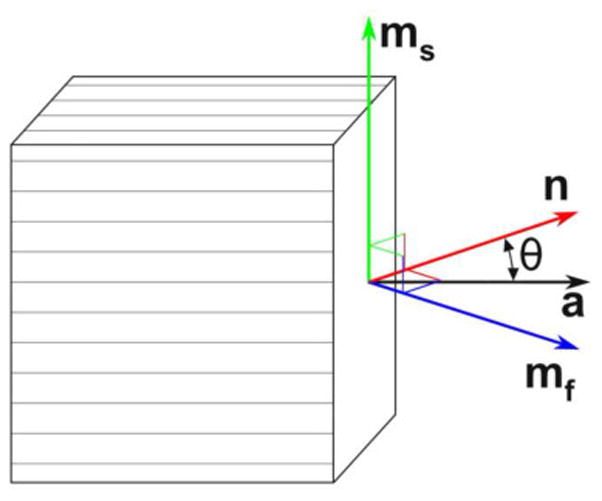
The propagation direction (denoted by unit vector n) and polarization directions (unit vectors ms and mf) of slow and fast shear waves, respectively, in an incompressible, transversely isotropic, elastic material. The unit vector a denotes the normal to the plane of isotropy.
Note that when the propagation direction n is parallel to the fiber direction a, Eq. 1 and Eq. 3 are undefined, θ = 0, and there is only one wave speed.
To extend the theory above to viscoelastic materials, the correspondence principle (Flügge, 1975) may be invoked, in which the complex shear modulus, μ* = μ′ + iμ″, describes the relationship between harmonic stress and strain in the plane of isotropy. If dissipative effects are due to fluid motion, and thus approximately isotropic, the loss factor η = μ″/μ′ would govern waves in all directions. In this study, each material is studied at a single frequency, so that μ represents the magnitude of the complex modulus |μ*|, and ϕ and ζ the anisotropy in moduli, at that frequency.
2.2 Experiments: slow and fast shear waves in cylindrical and cube specimens
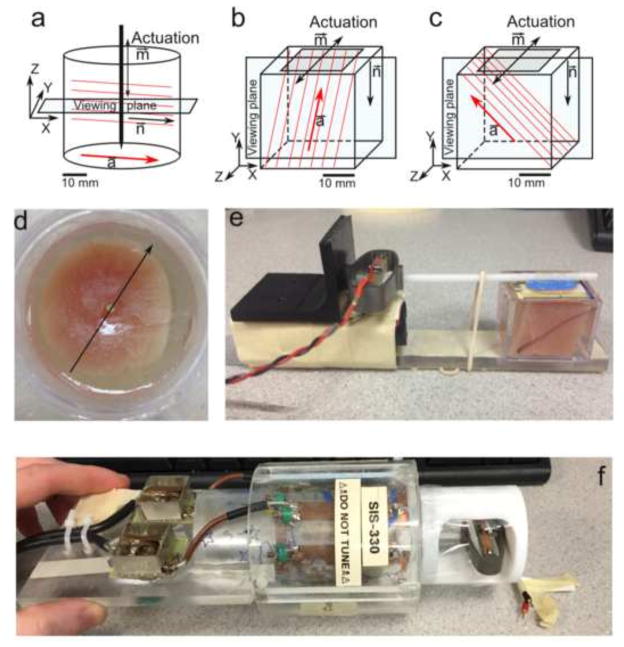
Detailed descriptions of materials and methods are included in Appendix B. Briefly, two different fibrous, biological materials, turkey breast and magnetically-aligned fibrin gel, were studied to assess wave speed differences in tissue based on fiber orientation. Two sample geometries, cylindrical and cube, were used for both materials (Fig. 2, Appendix B). Cylindrical (45 mm diameter) samples of both turkey breast and fibrin gel were embedded in a gelatin mixture (Okamoto et al., 2011) in a cylindrical container (Fig. 2 (a, d, f) and excited by vertical vibrations of a central axial rod. This setup produced shear waves with approximately radial propagation (n ≈ er). Cube-shaped specimens of turkey breast and aligned fibrin with fibers oriented ~45° downward from the top surface were also imaged. Waves in cube specimens were produced by lateral vibration of the top surface (Fig. 2 (b, c, e)). Two excitation cases (Fig. 2 (b, c)) were applied to each cube sample. In one case (Fig. 2 (b)) the actuation direction, m, was aligned with ms = n × a to excite slow shear waves and in the other case (Fig. 2 (c)) the actuation was aligned with mf = n × ms to excite fast shear waves. Frequencies of actuation were chosen to produce multiple wavelengths in the specimen, and multiple voxels per wavelength.
Figure 2.
Schematic diagrams of: (a) cylindrical specimen with axial excitation; (b) cube specimen with tangential excitation in a plane parallel to the fiber direction to induce “fast” shear waves. (c) cube specimen with tangential excitation perpendicular to the dominant fiber direction to induce “slow” shear waves. (d) Photograph of cylindrical turkey breast specimen embedded in gelatin (corresponding to panel a). (e) Photograph of experimental setup for cube turkey breast (corresponding to panel b; actuator on left). (f) Photograph of a cylindrical sample placed in RF coil with actuator on right.
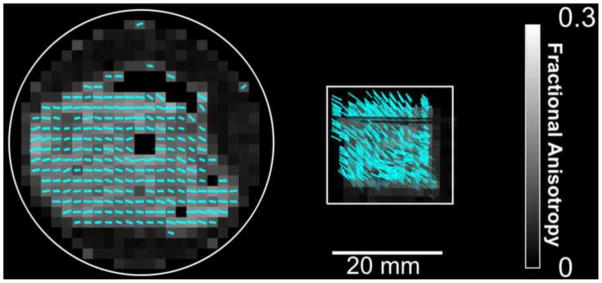
Images of shear-wave propagation in cylindrical and cube samples of turkey breast and aligned fibrin gel were acquired using previously-described spin-echo MRE sequences (Clayton et al., 2011a; Appendix B). To verify the average fiber orientation in turkey breast, diffusion tensor imaging (DTI) was performed in the same imaging session as MRE. Figure 3 shows a three-dimensional diffusion tensor field to indicate the fiber orientation inside a representative cube turkey breast sample. The relatively sparse networks of aligned fibrils in fibrin gels do not constrain water diffusion and thus DTI was not performed on the fibrin gels. Instead the direction of the magnetic field during the magnetic aligning process was physically marked on the sample container and was noted during all tests.
Figure 3.
Fiber orientation estimated by DTI in (a) cylindrical and (b) cube specimens of turkey breast. Maximum principal diffusion direction vectors (cyan) are superimposed on fractional anisotropy maps (FA, grey) for each voxel.
For comparison with MRE, estimates of viscoelastic shear modulus from dynamic shear testing (DST) were obtained in separate circular samples of turkey breast following techniques in (Feng et al., 2013b; Namani et al., 2012) (see Appendix B).
2.3 Image analysis: characterization of anisotropic wave propagation
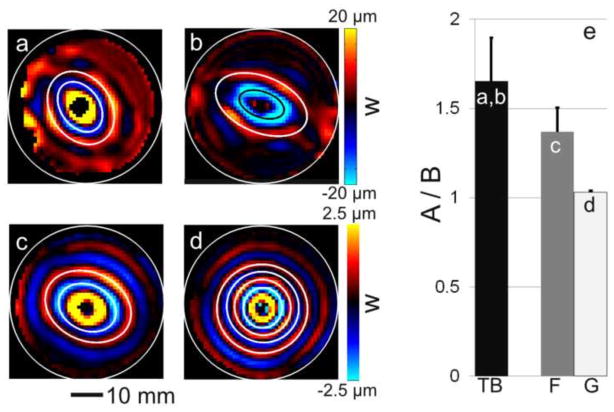
First, for a simple measure of anisotropy, radially-propagating shear waves in anisotropic cylindrical specimens were fitted to ellipses (Fig. 4). Peaks of the elliptical wavefront in multiple directions were manually picked on the 2D image of axial (w) displacement in the xy plane, in five contiguous slices from each sample. Ellipses were fitted using an algorithm that minimized the squared-error between the curves and the picked points (Fitzgibbon et al., 1999).
Figure 4.
Wave propagation in axially-excited, cylindrical specimens. (a–c) Representative images of elliptical waves exhibiting direction-dependent propagation with different wave speeds in different directions. (a) Representative sample #1 of turkey breast, 800 Hz; (b) Representative sample #2 of turkey breast, 800 Hz; (c) aligned fibrin gel, 200 Hz. (d) Circular waves in (isotropic) gelatin, 200 Hz. (e) Ellipses were fitted to the wave images (white and black lines in b–d) and the average ratios of their semi-axes are shown for the different materials.
Second, directional filtering (Appendix C) was used to isolate slow and fast shear waves in specific propagation and polarization directions. Figs. 5 (b, c) and 6 (c, d) show examples of directionally filtered waves in cylindrical and cube samples, respectively. From directionally filtered wave fields, peaks and valleys were selected manually to capture the wavelength. The wavelength in each of the 16 directions was averaged over 5 representative slices. Values of average wave speed as a function of angle, θ, were fitted to Eq. 2 using a weighted, least-squares fitting algorithm to estimate the slow wave-speed parameters, μ and ϕ.
Figure 5.
Wave propagation in a cylindrically aligned fibrin gel (200 Hz actuation) specimen, illustrating analysis by directional filtering. (a) Elliptical waves exhibiting direction dependent propagation with different wave speeds in different directions. (b–c) Displacement field after directional filtering in each of two propagation directions specified by angle, θ, from the dominant fiber direction. (b) θ = 0° and (c) θ = 90°.
Figure 6.
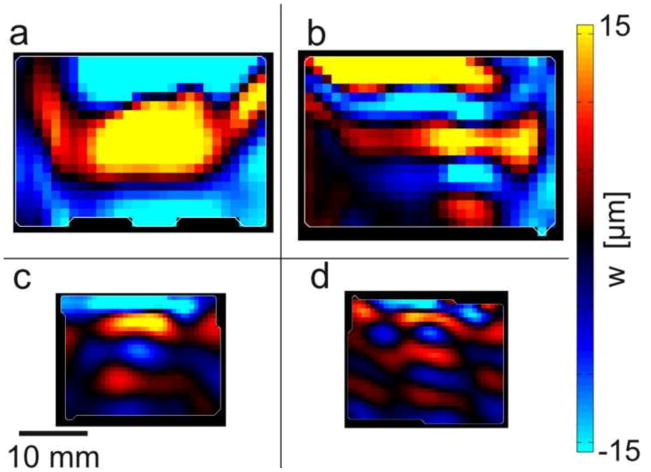
Wave propagation in a cube specimen of aligned fibrin with dominant fiber direction at 45° from horizontal (Figures 1(b,c)), illustrating analysis by directional filtering. (a) Excitation (600 Hz) in the mf direction (with a component along the fibers, as in Figure 1(b)) leads to predominantly downward-propagating fast shear waves. (b) Excitation (600 Hz) in the ms direction, perpendicular to the fibers, as in Figure 1(c), leads to predominantly downward-propagating slow shear waves. Panels (c,d): Directionally filtered waves in the [0 −1 0] direction corresponding to panels (a,b) respectively.
To characterize dissipative (viscous) effects, attenuation per wavelength was found from the ratios of amplitudes of successive peaks in directionally filtered waves (Appendix C; Figure C1).
3. Results
3.1 Imaging experiments
Wave patterns consistent with a transversely isotropic (TI) material model were observed in both cylindrical and cube samples. Axially-excited cylindrical samples (actuation in the ms direction) exhibited the slow shear-wave patterns predicted by mathematical models (Tweten et al., 2015). Elliptical waves were observed in specimens with a dominant fiber orientation (Fig. 4 (a, b, c)), and circular waves were observed in isotropic gel (Fig. 4 (d)), in planes perpendicular to the cylinder axis (Fig. 2 (a)). For ellipses fitted to radially-propagating wavefronts in axially excited cylindrical specimens, the ratio of major semi-axes and minor semi-axes was used to describe shear anisotropy. The average ratio of semi-axes was found to be 1.65 ± 0.24 for turkey breast (800 Hz, n=4), 1.37 ± 0.14 for aligned fibrin (200 Hz, n = 3), and 1.03 ± 0.01 for isotropic gelatin (200 Hz, n = 3).
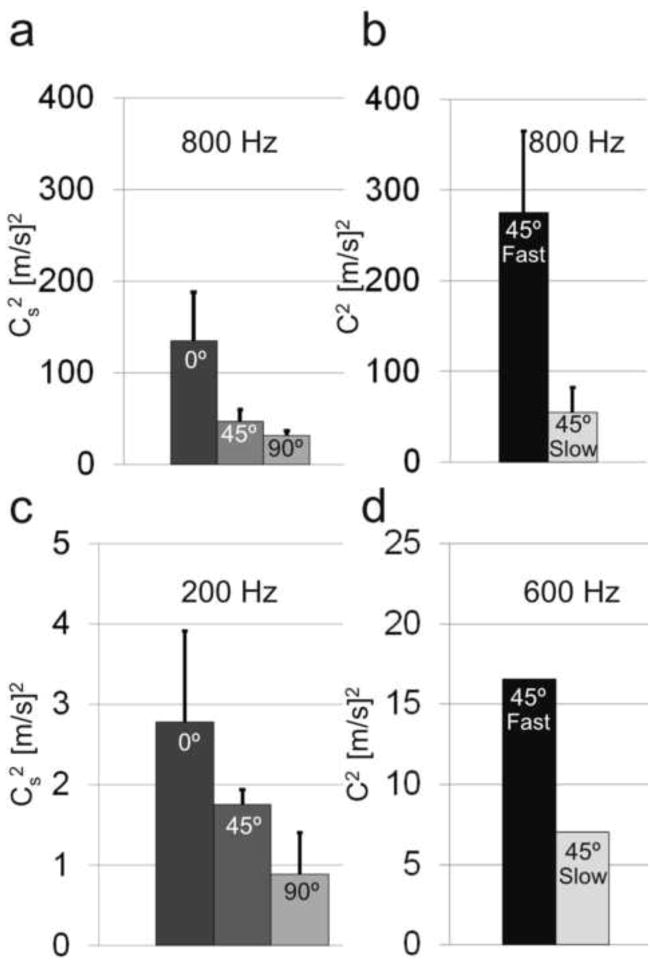
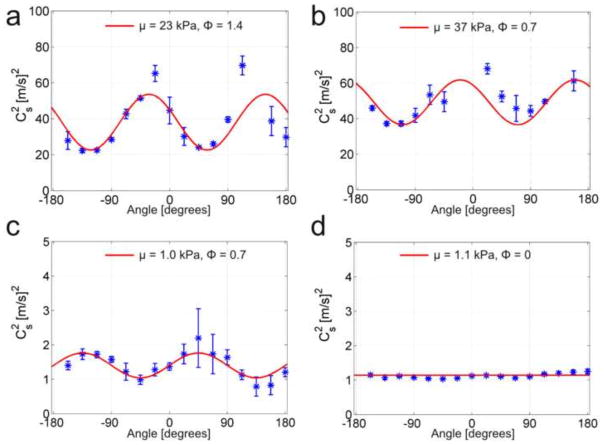
Analysis of the directionally-filtered wave speeds in cylindrical specimens (Fig. 9(a, c)) revealed dependence of slow shear-wave speed, cs, on the angle between fiber orientation and propagation direction, θ (Fig. 5). The observed dependence is consistent with theoretical predictions based on Eq. 2 (red curves) with fitted parameters. The parameters estimated for turkey breast were found to be μ = 33.1 ± 11.4 kPa and ϕ = 1.3 ± 0.7 for turkey breast (800 Hz, n = 4). For aligned fibrin gel, μ = 1.1 ± 0.5 kPa and ϕ = 1.1 ± 0.2 (200 Hz, n = 3). Close agreement between average fiber direction estimated from DTI (turkey breast) or magnetically induced alignment direction (fibrin) and the direction of fastest shear-wave propagation confirms that aligned fibers produce mechanical anisotropy.
Figure 9.
Summary of shear-wave speeds in turkey breast (a, b) and aligned fibrin (c, d) at different angles θ of propagation direction relative to fiber direction. (a) Slow shear-wave speed in cylindrical turkey breast specimens (800 Hz, N = 4 samples). Estimated material parameters: μ = 33.1 ± 11.4 kPa, ϕ = 1.3 ± 0.7 (b) Fast and slow shear-wave speeds in cube specimens (800 Hz, N=5). Estimated parameters: μ = 33.2 ± 16.7, ζ = 9.2 ± 4.9. (c) Slow shear-wave speeds in a cylindrical fibrin specimen (200 Hz, N=3). Estimated material parameters: μ = 1.1 ± 0.5 kPa, ϕ = 1.1 ± 0.2 (d) Average fast and slow shear-wave speeds in a cube specimen of aligned fibrin (600 Hz, N=1). Estimated parameters: μ = 4.7 kPa, ζ = 2.7.
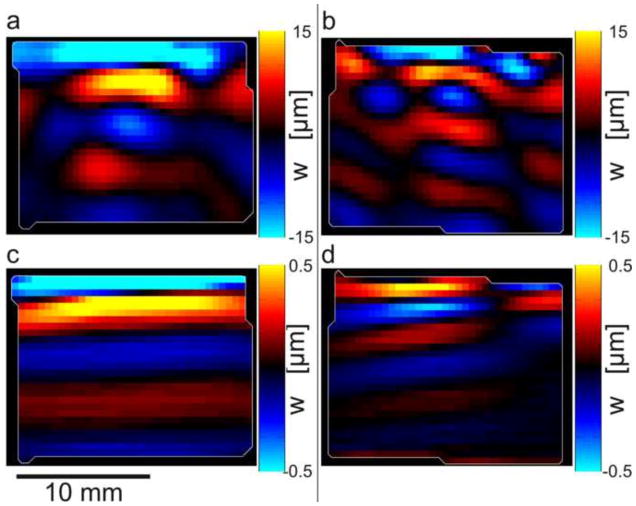
In cube specimens, strong evidence for the importance of both slow and fast shear waves is provided by the dependence of propagation speed on polarization direction. Polarization direction was controlled by actuation direction. When the actuation direction was in the plane containing the fibers and at an angle of ~45° from the fiber axis in this plane, displacements were induced in the mf direction. In this case, a substantial component of stretch is in the direction parallel to the fibers, the cubes exhibited primarily fast shear waves (Figs. 6(a) and 8(a,c)). In contrast, when the polarization direction was perpendicular to the fibers, in the ms direction, the cube exhibited slow shear waves (Figs. 6(b) and 8(b,d)). The difference between fast and slow shear wave speed in this sample is largely due to tensile anisotropy, characterized by the parameter ζ. This parameter was estimated from the ratio between slow and fast shear-wave speeds (Fig 9(b,d)), using Eqs. 2 and 4. Because Eqs. 2 and 4 contain three unknown parameters (after measuring the slow and fast wave speed and θ=45°), the average value of ϕ estimated from cylindrical specimens was used to solve for both μ and ζ. For turkey breast cubes, the estimated parameters are μ = 32.2 ± 16.8 kPa and ζ = 9.2 ± 4.9 (800 Hz, n = 5) and for aligned fibrin gel the estimated parameters are μ = 4.5 kPa and ζ = 2.7 (200 Hz, n = 1).
Figure 8.
Wave propagation visualized by MRE in cube samples with different directions of excitation relative to fiber orientation. Fibers are oriented approximately 45° from horizontal as in Figure 2(b,c). Top panels (a,b) show fast and slow wave propagation in turkey breast actuated at 800 Hz and bottom panels (c,d) show aligned fibrin actuated at 600 Hz. Left panels (a,c): Actuation in the mf direction with a component along the fibers (as in Figure 2(b)) leads to downward-propagating, fast shear waves. Right panels (b,d): Actuation in the ms direction, perpendicular to the fibers (as in Figure 2(c) leads to downward-propagating, slow shear waves.
The attenuation per wavelength (ratio between successive peaks) for slow shear waves in turkey breast was r = 0.27 ± 0.18, corresponding to a loss factor of η = μ″/μ′ = 0.43 ± 0.17 (Auld, 1990). In fibrin the attenuation per wavelength was r = 0.50 ± 0.21 (η = 0.22 ± 0.11) and in gelatin the attenuation ratio was r = 0.67 ± 0.13 (η = 0.13 ± 0.06). No statistically significant differences in attenuation per wavelength were found for different directions of propagation in MRE.
Parameter estimates are summarized in Table 1. The amplitudes of slow and fast shear waves turkey breast and fibrin are summarized in Table D2 in Appendix D.
Table 1.
Summary of incompressible, transversely isotropic (ITI) material parameter estimates from MRE of turkey breast muscle tissue and aligned fibrin gel. Parameters are: baseline shear modulus, μ; shear anisotropy, ϕ; tensile anisotropy, ζ; loss factor, η.
| Turkey breast | Aligned fibrin gel | |||
|---|---|---|---|---|
| Cylinder (800 Hz, N=4) | Cube (800 Hz, N=5) | Cylinder (200 Hz, N=3) | Cube (600 Hz, N=1) | |
| μ kPa | 33.1 ± 11.4 | 32.2 ± 16.8 | 1.1 ± 0.5 | 4.7 |
| ϕ | 1.3 ± 0.7 | NA* | 1.1 ± 0.2 | NA* |
| ζ | NA | 9.2 ± 4.9 | NA | 2.7 |
| η | 0.43 ± 0.17 | 0.22 ± 0.11 | ||
To estimate ζ in cube specimens, ϕ was set to the value measured in cylindrical specimens.
3.2 Direct mechanical characterization
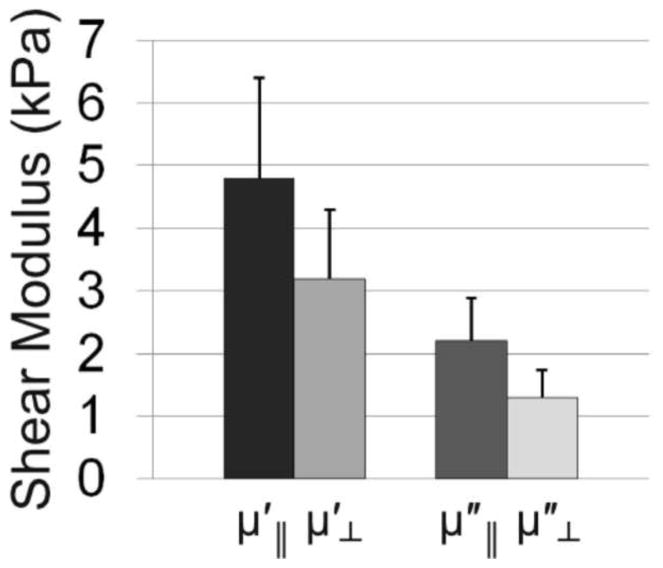
Parallel and perpendicular shear moduli for turkey breast (N = 33) were averaged over the frequencies from 30–40 Hz using DST. The storage modulus was found to be when fibers were aligned parallel to the direction of imposed shear displacement and when fibers were aligned perpendicular to the shear displacement. The loss modulus was for the parallel orientation and for the perpendicular orientation. The ratio between parallel and perpendicular moduli for storage modulus, for loss modulus, and μ||/μ⊥ = 1.6 ± 0.3 (ϕ = 0.6 ± 0.3) for the magnitude. Fig. 10 summarizes these data.
Figure 10.
Storage (elastic) and loss (viscous) components of the complex shear modulus μ* = μ′ + iμ″ of turkey breast (N=33, 30–40 Hz) measured by direct mechanical testing (DST). The ratio of the storage moduli was , the ratio of the loss moduli was , and the ratio of the magnitudes was μ||/μ⊥ = 1.6 ± 0.3 (ϕ = 0.6 ± 0.3).
4. Discussion
In this experimental study, shear waves were imaged using MR elastography procedures in both muscle tissue ex vivo (turkey breast) and aligned fibrin gel. In axially-excited cylindrical samples, slow shear waves were found to propagate with elliptical wave fronts through both transversely isotropic materials, and with circular wave fronts in an isotropic medium (gelatin). In cube samples excited by tangential vibration on one face, measurements of slow and fast shear waves with differing polarization direction showed the effects of tensile anisotropy on wave speed. These results confirm that MRE can detect anisotropic shear moduli and tensile moduli in these two prototypical soft, fibrous, materials.
Direct mechanical tests (DST) in the current study confirmed mechanical anisotropy in turkey breast. Values of the shear anisotropy ratio from DST (turkey breast (ϕ~0.6, or μ||/μ⊥ ~1.6 at 30–40 Hz) were comparable to values estimated from MRE (ϕ~1.3, or μ||/μ⊥ ~2.3, at 800 Hz). While both tests give ratios of shear modulus near 2, the fact that MRE estimates of anisotropy at 800 Hz are about 40% higher than DST at 30–40 Hz must be acknowledged. This difference may reflect limitations of each method. Accuracy and precision of MRE estimates are limited by the practical challenges of wavelength estimation from discretely sampled data with limited resolution. Results from DST may be affected by slip, nonlinearity or non-affine deformation. Alternatively, shear anisotropy may truly depend on frequency; the frequency ranges of the instruments in this study precluded a direct test of this possibility, but it is a topic for future investigation. Although DST of turkey breast was done at much lower frequencies (30–40 Hz) than in MRE (800 Hz), the values of the baseline storage modulus (μ~4 kPa at 30 Hz and μ~33 kPa at 800 Hz) are consistent with the expected increase in modulus with frequency in viscoelastic muscle tissue. Both DST and MRE estimates of μ are consistent with a previous MRE study of the viscoelastic properties of bovine muscle ex vivo, in which estimates of (isotropic) shear modulus increase from μ~12 kPa at 200 Hz to μ~35 kPa at 800 Hz (Riek et al., 2011).
In a previous study of aligned fibrin (Namani et al., 2012), DST also detected anisotropy in shear (ϕ~0.9, at 20–40 Hz). This result is similar to estimates of shear anisotropy of aligned fibrin from MRE in the current study (ϕ~0.6 from measured wavelengths at 200 Hz). Also, the tensile anisotropy parameter for aligned fibrin estimated from MRE (ζ~2.1 at 600 Hz) in this study is comparable to the tensile anisotropy estimated from asymmetric indentation of aligned fibrin (ζ~3.5, quasi-static) in previous work (Namani et al., 2012).
The current results demonstrate the ability to both (1) characterize two distinct shear-wave types in soft transversely isotropic materials using MRE, and (2) use these shear wave measurements to estimate three elastic parameters. Notably, tensile anisotropy can cause large differences between slow and fast shear-wave speeds. Both fast and slow shear waves exhibit direction-dependent propagation speed. For slow shear waves, only shear anisotropy causes this directional dependence; tensile anisotropy plays no role in slow shear wave speed. In contrast, the directional dependence of fast shear wave speed is due to both shear anisotropy and tensile anisotropy. The estimation of mechanical parameters by directional filtering and isolation of separate shear-wave components is robust to noise (Tweten et al., 2015), since it does not rely on multiple numerical derivatives.
Romano et al. (2012, 2014) also used directional filters to isolate shear wave components. These authors analyzed wave speeds for a set of propagation and polarization directions aligned with a specific fiber tract, and estimated five to nine components of the elasticity tensor. For nearly-incompressible materials, elements of the elasticity tensor will have widely varying magnitude, as some elements approach infinity due to the contribution of the bulk modulus (see Appendix A). In the current approach, only three parameters (μ, ϕ, and ζ) are sought, which for incompressible materials, completely specifies the compliance tensor. An advantage of the current approach is that components of the compliance tensor converge to finite values as the bulk modulus approaches infinity.
The current material model is constrained by the assumptions of linear elasticity and incompressibility. In applications in vivo, because tissue is slightly compressible and excitation may have a longitudinal component, longitudinal waves must be considered. The current method can be applied even in the presence of longitudinal waves, because fast and slow shear waves are isolated by a combination of directional filtering and projection onto the corresponding polarization directions. In the isotropic case, taking the curl of the displacement field eliminates the contributions of longitudinal waves. In the anisotropic case, the curl of the displacement field does not uncouple the equations. However, Guo et al. (2015) were able to estimate transversely isotropic material parameters from the curl field; the assumption of incompressibility was used to obtain the equations used in the inversion.
Neither dissipation (viscosity, or complex shear modulus) nor nonlinearity is addressed comprehensively. The deformations in the current study are small (<1% strain) and thus linear theory is applicable. Though the focus of the current study is on elastic anisotropy, viscoelastic effects are clearly important for describing the complete response of tissue (Clayton et al., 2011b; Green et al., 2008; Qin et al., 2013). Dissipative effects are often attributed to fluid viscosity and approximated as isotropic, in which case the directional dependence of shear wave speeds can be attributed to anisotropy of elastic moduli. While this model was not rigorously tested in these materials, our observations of wave attenuation in MRE are consistent with an approximately isotropic loss factor (Appendix C, Figure C1). Current estimates of loss factor from attenuation of waves in MRE in turkey breast (η = 0.43) are similar to those observed in prior studies of muscle (η ≈ 0.4, Riek et al., 2011), as well as to the ratios of loss and storage moduli estimated by DST (Figure 10). Current estimates from MRE in fibrin (η = 0.22) approximate those from a prior study of fibrin (η ≈ 0.2; Namani et al., 2012). The estimated loss factor in gelatin (η = 0.13) also agrees with prior observations (η ≈ 0.1; Okamoto et al., 2011). The elastic constants estimated here may be interpreted as effective moduli at the given experimental frequency. In future work, complex moduli could be determined as functions of frequency.
The current study focused on the physics of wave propagation in ITI materials, and hence simple, manual methods were used to estimate wavelength and wave speed. This approach was chosen to separate the characterization of physical phenomena from the performance of automated algorithms. Future studies and related work (Tweten et al., 2015, e.g.) will address the development of robust, automated methods for estimating wavelengths of slow and fast shear waves in TI materials.
Samples of roughly uniform material were used in this study. The current approach, in which the wavelength is estimated and averaged over five slices and then the average substituted into the equations to estimate the shear moduli, is adequate for globally homogenous materials, such as ex vivo specimens and phantoms. In actual tissue measurements in vivo, tissue homogeneity may only be assumed very locally. More work is needed to address parameter estimation in heterogeneous materials such as brain tissue in vivo. In such materials, it is critically important that both slow and fast shear waves propagating in multiple directions are present in a given volume, in order to obtain valid estimates of transversely anisotropic material properties in that region.
5. Conclusion
Both slow and fast shear waves propagate in soft, fibrous, materials and can be imaged by MRE. Shear-wave speed depends on the angles between propagation direction, polarization direction, and fiber direction. Three elastic parameters may be estimated from these data, allowing for concise characterization of nearly-incompressible, transversely isotropic materials. Such material characterization can lead to improved modeling of white matter in the brain and a greater understanding of TBI.
Supplementary Material
Figure 7.
Average (± std. deviation) slow shear-wave speeds (blue *) plotted vs the angle between propagation direction and the horizontal axis of the cylinder, in cylindrical specimens. (a) Representative sample #1 of turkey breast (800 Hz). (b) Representative sample #2 of turkey breast (800 Hz). (c) Aligned fibrin gel (200 Hz). (d) Gelatin (200 Hz). Each plot is for a single sample; average values for each direction are computed over 5 slices. Theoretical curves (red lines) are obtained from Eq. 2 using values of μ and ϕ estimated by weighted, least-squares fitting for each sample.
Acknowledgments
This study was supported by NIH Grant NS055951 (Bayly) and NSF Grant CMMI-1332433 (Bayly).
Footnotes
Conflict of Interest Statement
None of the authors have a conflict of interest that could influence the work described in this manuscript.
Publisher's Disclaimer: This is a PDF file of an unedited manuscript that has been accepted for publication. As a service to our customers we are providing this early version of the manuscript. The manuscript will undergo copyediting, typesetting, and review of the resulting proof before it is published in its final citable form. Please note that during the production process errors may be discovered which could affect the content, and all legal disclaimers that apply to the journal pertain.
References
- Aristizabal S, Amador C, Qiang B, Kinnick RR, Nenadic IZ, Greenleaf JF, Urban MW. Shear wave vibrometry evaluation in transverse isotropic tissue mimicking phantoms and skeletal muscle. Phys Med Biol. 2014;59:7735–7752. doi: 10.1088/0031-9155/59/24/7735. [DOI] [PMC free article] [PubMed] [Google Scholar]
- Asbach P, Klatt D, Hamhaber U, Braun J, Somasundaram R, Hamm B, Sack I. Assessment of liver viscoelasticity using multifrequency MR elastography. Magn Reson Med. 2008;60:373–379. doi: 10.1002/mrm.21636. [DOI] [PubMed] [Google Scholar]
- Atay SM, Kroenke CD, Sabet A, Bayly PV. Measurement of the dynamic shear modulus of mouse brain tissue in vivo by magnetic resonance elastography. J Biomech Eng. 2008;130 doi: 10.1115/1.2899575. [DOI] [PMC free article] [PubMed] [Google Scholar]
- Auld BA. Acoustic fields and waves in solids. 2. Krieger Publishing Company; New York, NY: 1990. [Google Scholar]
- Clayton EH, Garbow JR, Bayly PV. Frequency-dependent viscoelastic parameters of mouse brain tissue estimated by MR elastography. Phys Med Biol. 2011a;56:2391–2406. doi: 10.1088/0031-9155/56/8/005. [DOI] [PMC free article] [PubMed] [Google Scholar]
- Clayton EH, Garbow JR, Bayly PV. Frequency-dependent viscoelastic parameters of mouse brain tissue estimated by MR elastography. Phys Med Biol. 2011b;56:2391–2406. doi: 10.1088/0031-9155/56/8/005. [DOI] [PMC free article] [PubMed] [Google Scholar]
- Feng Y, Clayton EH, Chang Y, Okamoto RJ, Bayly PV. Viscoelastic properties of the ferret brain measured in vivo at multiple frequencies by magnetic resonance elastography. J Biomech. 2013a;46:863–870. doi: 10.1016/j.jbiomech.2012.12.024. [DOI] [PMC free article] [PubMed] [Google Scholar]
- Feng Y, Okamoto RJ, Namani R, Genin GM, Bayly PV. Measurements of mechanical anisotropy in brain tissue and implications for transversely isotropic material models of white matter. J Mech Behav Biomed Mater. 2013b;23:117–132. doi: 10.1016/j.jmbbm.2013.04.007. [DOI] [PMC free article] [PubMed] [Google Scholar]
- Fitzgibbon A, Pilu M, Fisher RB. Direct least square fitting of ellipses. IEEE Trans Pattern Anal Mach Intell. 1999;21:476–480. [Google Scholar]
- Flügge W. Viscoelasticity. 2. Springer-Verlag; New York, NY: 1975. rev. ed. [Google Scholar]
- Gennisson JL, Catheline S, Chaffai S, Fink M. Transient elastography in anisotropic medium: Application to the measurement of slow and fast shear wave speeds in muscles. J Acoust Soc Am. 2003;114:536–541. doi: 10.1121/1.1579008. [DOI] [PubMed] [Google Scholar]
- Green Ma, Geng G, Qin E, Sinkus R, Gandevia SC, Bilston LE. Measuring anisotropic muscle stiffness properties using elastography. NMR Biomed. 2013;26:1387–1394. doi: 10.1002/nbm.2964. [DOI] [PubMed] [Google Scholar]
- Green MA, Bilston LE, Sinkus R. In vivo brain viscoelastic properties measured by magnetic resonance elastography. NMR Biomed. 2008;21:755–764. doi: 10.1002/nbm.1254. [DOI] [PubMed] [Google Scholar]
- Guo J, Hirsch S, Scheel M, Braun J, Sack I. Three-parameter shear wave inversion in MR elastography of incompressible transverse isotropic media: Application to in vivo lower leg muscles. Magn Reson Med. 2015 doi: 10.1002/mrm.25740. In press. Available online. [DOI] [PubMed] [Google Scholar]
- Holzapfel GA. Nonlinear Solid Mechanics: A Continuum Approach for Engineering. John Wiley & Sons, Ltd; 2000. [Google Scholar]
- Johnson CL, McGarry MDJ, Van Houten EEW, Weaver JB, Paulsen KD, Sutton BP, Georgiadis JG. Magnetic resonance elastography of the brain using multishot spiral readouts with self-navigated motion correction. Magn Reson Med. 2013;70:404–412. doi: 10.1002/mrm.24473. [DOI] [PMC free article] [PubMed] [Google Scholar]
- Klatt D, Friedrich C, Korth Y, Vogt R, Braun J, Sack I. Viscoelastic properties of liver measured by oscillatory rheometry and multifrequency magnetic resonance elastography. Biorheology. 2010a;47:133–141. doi: 10.3233/BIR-2010-0565. [DOI] [PubMed] [Google Scholar]
- Klatt D, Papazoglou S, Braun J, Sack I. Viscoelasticity-based MR elastography of skeletal muscle. Phys Med Biol. 2010b;55:6445–6459. doi: 10.1088/0031-9155/55/21/007. [DOI] [PubMed] [Google Scholar]
- Knutsson H, Westin C-F, Granlund G. Local multiscale frequency and bandwidth estimation. Proceedings of 1st International Conference on Image Processing; IEEE Comput. Soc. Press; 1994. pp. 36–40. [Google Scholar]
- Manduca A, Lake DS, Kruse SA, Ehman RL. Spatio-temporal directional filtering for improved inversion of MR elastography images. Med Image Anal. 2003;7:465–473. doi: 10.1016/s1361-8415(03)00038-0. [DOI] [PubMed] [Google Scholar]
- Mariappan YK, Glaser KJ, Manduca A, Romano AJ, Venkatesh SK, Yin M, Ehman RL. High-frequency mode conversion technique for stiff lesion detection with magnetic resonance elastography (MRE) Magn Reson Med. 2009;62:1457–1465. doi: 10.1002/mrm.22091. [DOI] [PMC free article] [PubMed] [Google Scholar]
- Murphy MC, Huston J, Jack CR, Glaser KJ, Senjem ML, Chen J, Manduca A, Felmlee JP, Ehman RL. Measuring the characteristic topography of brain stiffness with magnetic resonance elastography. PLoS One. 2013;8:1–14. doi: 10.1371/journal.pone.0081668. [DOI] [PMC free article] [PubMed] [Google Scholar]
- Muthupillai R, Ehman RL. Magnetic resonance elastography. Nat Med. 1996;2:601–603. doi: 10.1038/nm0596-601. [DOI] [PubMed] [Google Scholar]
- Muthupillai R, Lomas DJ, Rossman PJ, Greenleaf JF, Manduca A, Ehman RL. Magnetic resonance elastography by direct visualization of propagating acoustic strain waves. Science. 1995;269:1854–7. doi: 10.1126/science.7569924. [DOI] [PubMed] [Google Scholar]
- Namani R, Feng Y, Okamoto RJ, Jesuraj N, Sakiyama-Elbert SE, Genin GM, Bayly PV. Elastic characterization of transversely isotropic soft materials by dynamic shear and asymmetric indentation. J Biomech Eng. 2012;134:061004. doi: 10.1115/1.4006848. [DOI] [PMC free article] [PubMed] [Google Scholar]
- Namani R, Wood MD, Sakiyama-Elbert SE, Bayly PV. Anisotropic mechanical properties of magnetically aligned fibrin gels measured by magnetic resonance elastography. J Biomech. 2009;42:2047–2053. doi: 10.1016/j.jbiomech.2009.06.007. [DOI] [PMC free article] [PubMed] [Google Scholar]
- Okamoto RJ, Clayton EH, Bayly PV. Viscoelastic properties of soft gels: comparison of magnetic resonance elastography and dynamic shear testing in the shear wave regime. Phys Med Biol. 2011;56:6379–400. doi: 10.1088/0031-9155/56/19/014. [DOI] [PMC free article] [PubMed] [Google Scholar]
- Papazoglou S, Rump J, Braun J, Sack I. Shear wave group velocity inversion in MR elastography of human skeletal muscle. Magn Reson Med. 2006;56:489–497. doi: 10.1002/mrm.20993. [DOI] [PubMed] [Google Scholar]
- Qin EC, Lauriane J, Lambert SA, Paradis V, Sinkus R, Bilston LE. In Vivo Anisotropic Mechanical Properties of Dystrophic Skeletal Muscles Measured by Anisotropic MR Elastographic Imaging: The mdx Mouse Model of Muscular Dystrophy. Radiology. 2014;273:726–735. doi: 10.1148/radiol.14132661. [DOI] [PubMed] [Google Scholar]
- Qin EC, Sinkus R, Geng G, Cheng S, Green M, Rae CD, Bilston LE. Combining MR elastography and diffusion tensor imaging for the assessment of anisotropic mechanical properties: a phantom study. J Magn Reson Imaging. 2013;37:217–226. doi: 10.1002/jmri.23797. [DOI] [PubMed] [Google Scholar]
- Riek K, Klatt D, Nuzha H, Mueller S, Neumann U, Sack I, Braun J. Wide-range dynamic magnetic resonance elastography. J Biomech. 2011;44:1380–1386. doi: 10.1016/j.jbiomech.2010.12.031. [DOI] [PubMed] [Google Scholar]
- Romano A, Guo J, Prokscha T, Meyer T, Hirsch S, Braun J, Sack I, Scheel M. In vivo waveguide elastography: Effects of neurodegeneration in patients with amyotrophic lateral sclerosis. Magn Reson Med. 2014;1761:1755–1761. doi: 10.1002/mrm.25067. [DOI] [PubMed] [Google Scholar]
- Romano A, Scheel M, Hirsch S, Braun J, Sack I. In vivo waveguide elastography of white matter tracts in the human brain. Magn Reson Med. 2012;68:1410–1422. doi: 10.1002/mrm.24141. [DOI] [PubMed] [Google Scholar]
- Rouze NC, Wang MH, Palmeri ML, Nightingale KR. Finite element modeling of impulsive excitation and shear wave propagation in an incompressible, transversely isotropic medium. J Biomech. 2013;46:2761–2768. doi: 10.1016/j.jbiomech.2013.09.008. [DOI] [PMC free article] [PubMed] [Google Scholar]
- Royer D, Gennisson JL, Deffieux T, Tanter M. On the elasticity of transverse isotropic soft tissues. J Acoust Soc Am. 2011;129:2757–2760. doi: 10.1121/1.3559681. [DOI] [PubMed] [Google Scholar]
- Sack I, Beierbach B, Hamhaber U, Klatt D, Braun J. Non-invasive measurement of brain viscoelasticity using magnetic resonance elastography. NMR Biomed. 2008;21:265–271. doi: 10.1002/nbm.1189. [DOI] [PubMed] [Google Scholar]
- Sinkus R, Tanter M, Catheline S, Lorenzen J, Kuhl C, Sondermann E, Fink M. Imaging anisotropic and viscous properties of breast tissue by magnetic resonance-elastography. Magn Reson Med. 2005;53:372–387. doi: 10.1002/mrm.20355. [DOI] [PubMed] [Google Scholar]
- Tweten DJ, Okamoto RJ, Schmidt JL, Garbow JR, Bayly PV. Estimation of material parameters from slow and fast shear waves in an incompressible, transversely isotropic material. J Biomech. 2015;48:4002–4009. doi: 10.1016/j.jbiomech.2015.09.009. [DOI] [PMC free article] [PubMed] [Google Scholar]
- Wang M, Byram B, Palmeri M, Rouze N, Nightingale K. Imaging transverse isotropic properties of muscle by monitoring acoustic radiation force induced shear waves using a 2-D matrix ultrasound array. IEEE Trans Med Imaging. 2013;32:1671–1684. doi: 10.1109/TMI.2013.2262948. [DOI] [PMC free article] [PubMed] [Google Scholar]
Associated Data
This section collects any data citations, data availability statements, or supplementary materials included in this article.


