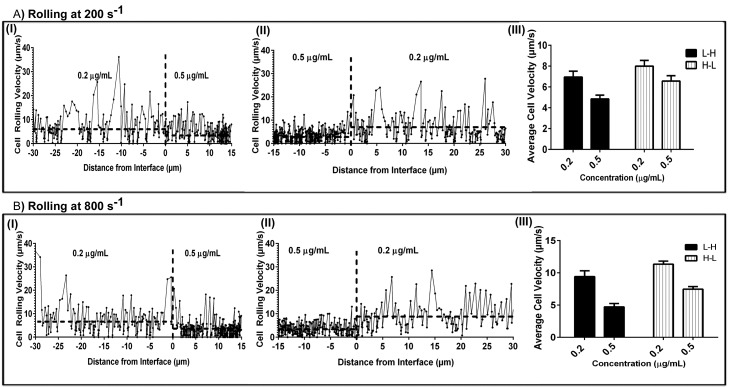
FIG. 9.
Neutrophil Rolling Behavior on P-selectin Step Patterns Instantaneous and average rolling velocities of neutrophils rolling on increasing (0.2 → 0.5 μg/ml) and decreasing (0.5 → 0.2 μg/ml) step patterns of mP-selectin. Frame by frame velocities of representative neutrophils rolling on an increasing (A.I, B.I) and decreasing (A.II, B.II) P-selectin step patterns at 200 s−1 and 800 s−1. The horizontal dotted lines represent the average rolling velocity for the representative cell on each side of the interface (indicated by vertical dotted line). The mean velocities for a population of neutrophils rolling on the step gradients of P-selectin are presented as average ± SEM at 200 s−1 (A.III) and 800 s−1 (B.III). mP-selectin step patterns were fabricated by perfusing two different concentrations of mP-selectin (0.2 and 0.5 μg/ml) through Y-shaped microfluidic channels (main channel cross-section 500 μm × 50 μm) for 15 min at 16.0 dyn/cm2.

