Abstract
Many prognostic studies in cirrhosis were performed without distinguishing between compensated and decompensated patients and/or have evaluated the prognostic role of variables that are not routinely used. The aim was to evaluate predictors of survival in compensated and decompensated cirrhosis separately but in a concurrent cohort and focused on routine clinical variables.
Methods
Secondary analysis of a prospective cohort with cirrhosis collected in a tertiary center between 08/2000 and 05/2002 and followed until death or 04/2006. Univariate, stratified univariate analysis and multivariate Cox regression analysis were performed. ROC curves were used to identify the best cutoff of variables predictive of death.
Results
242 patients were included (122 compensated, 120 decompensated). In a median follow up of 30 (6-50) months, 62 (26%) deaths occurred, 24 (20%) in the compensated and 38 (32%) in the decompensated group. In the whole cohort, decompensation was the strongest predictor of death. In the compensated group, age, albumin and platelets and in the decompensated group MELD, platelets and albumin were identified as independent predictors of death. A serum albumin of 4 g/dL was the best cutoff to identify patients at risk for death in the compensated group with a hazard ratio of 13.3 (95% CI 1.8-98.8) in those with an albumin <4.0 g/dL.
Conclusion
Albumin is a predictor of death in compensated and decompensated cirrhosis. In compensated cirrhosis it can identify a subset patients with particularly good prognosis. Different predictors were observed in both stages, confirming that compensated and decompensated cirrhosis are two separate disease stages.
Keywords: prognosis, survival prediction, natural history, end-stage liver disease
A systematic review of the literature (118 studies) that investigated predictors of death in patients with cirrhosis concluded that future studies should “include patients at a well-defined stage in the course of cirrhosis”, that is, that future studies should separately evaluate patients with compensated and decompensated cirrhosis (1). The majority of studies included in the review had defined cirrhosis as a single entity and had combined patients with both compensated and decompensated cirrhosis. Most of the studies included in this review were performed in the pre-MELD era and some studies were performed before the introduction of relevant advances in the management of patients with liver cirrhosis. The study further recommended that predictors of decompensation should be investigated in compensated cirrhosis, as patients with compensated cirrhosis decompensate before dying of liver related disease. These recommendations were further endorsed by EASL/AASLD (2).
Portal pressure has been thoroughly researched in compensated and decompensated cirrhosis. Our study derived from the NIH-funded timolol study (3), showed that portal pressure (assessed by the hepatic venous pressure gradient or HVPG) was the main predictor of decompensation and a recent study showed that an HVPG greater than 10mmHg was an independent predictor of death in compensated cirrhosis (4). Although the value of HVPG in determining outcomes in cirrhosis cannot be overemphasized, it is an invasive procedure that is not performed routinely in most centers and non-invasive predictors of death in cirrhosis are needed.
The current study therefore had the objective of determining the predictive value of routinely used parameters (other than HVPG) in compensated and decompensated patients with cirrhosis, evaluated separately but in a cohort of patients with cirrhosis accrued concurrently.
Patients and Methods
This study is a secondary analysis of a prospective cohort study conducted between August 2000 and May 2002 in which 242 patients with cirrhosis consecutively admitted to Yale-New Haven Hospital or the VA Connecticut Healthcare System for decompensation of cirrhosis were compared to a simultaneous cohort of consecutive patients with cirrhosis followed in the outpatient liver clinics of both hospitals and who had not been hospitalized in the previous 3 months (5). In the group of outpatients, some had had a previous decompensating event (including the presence of ascites, jaundice, hepatic encephalopathy, portal hypertensive bleed or renal failure compatible with hepatorenal syndrome), while others had compensated cirrhosis.
The diagnosis of cirrhosis was established based on clinical, biochemical, imaging and/or histological criteria. Data was collected prospectively in the original study including demographic characteristics, alcohol consumption, etiology of cirrhosis, biochemical tests and presence and type of prior decompensating events. In the present study, patients were divided in two groups: compensated and decompensated. Decompensation was defined by the presence (at inclusion or previous) of ascites, hepatic encephalopathy, variceal bleeding, and/or jaundice. Both hospitalized patients and outpatients with a history of decompensation were included in the decompensated group. This clinical definition of decompensation is the one that has been used in previous studies (2). Patients with variceal hemorrhage that were otherwise compensated (Child A) were considered decompensated, while patients with significantly altered liver synthetic function that could place them in a Child C category, but who had no ascites, encephalopathy or variceal hemorrhage, were considered compensated. Medical records were reviewed in order to complete follow-up from inclusion in the original study to death, liver transplant or April 2006 (end of study). Patients for whom there was no information up to April 2006 were censored at the time of their last follow-up visit. Patients in whom liver transplant was performed during follow-up were censored at the time of transplant. The end-point was to evaluate present day survival of compensated and decompensated patients and then finally to evaluate the present day predictors of death. Variables included in the prognostic analysis are data readily available to clinicians in the outpatient setting, specifically, age, etiology of liver disease, and variables related to liver function (albumin, INR, bilirubin, Child-Pugh score, MELD), portal hypertension (platelets), hepatic inflammation (AST) and renal function (creatinine).
Statistical analyses
Survival rates were evaluated by Kaplan-Meier curves and compared with the log rank test. Evaluation of predictors of death was done by multivariate stepwise backward Cox regression. In order to confirm that decompensation (even with newer standards of care) was, in itself an independent predictor of mortality in cirrhosis, we initially analyzed the whole group of patients with cirrhosis as a whole. Stratified analysis was performed to evaluate the presence of interaction, which would confirm the need for a separate evaluation of compensated and decompensated patients. Once we confirmed the predominant effect of decompensation of cirrhosis on survival, we performed survival analysis and multivariate Cox regression analysis separately in compensated and decompensated patients. Variables that were significant on univariate Cox analysis were included in the multivariate analysis. Overfitting and colinearity were avoided by maintaining a 1:10 variable:outcome ratio. The choice of the best model was based on the likelihood ratio. ROC curves were constructed to evaluate the discriminative ability of the variables. Cut-off points were identified in order to derive information that is easily applicable to clinical practice. Statistical significance was considered with a p-value <0.05. Statistical analysis was done with SPSS package 15.0. Patients gave their informed consent for inclusion in the initial study (5). Approval from the local institutional review board was obtained for the secondary analysis.
Results
As mentioned above, 242 consecutive patients with cirrhosis were included in the study, 122 compensated and 120 decompensated. Baseline characteristics of the patients are shown in Table 1. In a median follow up of 30 (6-50) months, 62 (26%) deaths occurred, 24 (20%) in the compensated group and 38 (32%) in the decompensated group.
Table 1.
Baseline characteristics of the patients included in the study.
| * | Total (n=242) | Compensated (n=122) | Decompensated (n=120) | p-value |
|---|---|---|---|---|
| Age | 52 (47-59) | 51 (45-59) | 53 (48-61) | 0,05 |
| Male sex (%) | 162 (67) | 80 (67) | 82 (67) | 0.963 |
| Mean BP (mmHg) | 89 (13) | 94 (13) | 85 (12) | <0.0001 |
| Heart Rate (bpm) | 76 (70-87) | 76 (70-82) | 78 (70-92) | 0.48 |
| Etiology (%) | 0.0003 | |||
| -alcohol | 64 (26) | 18 (15) | 46 (38) | |
| -viral | 120 (50) | 69 (57) | 51 (43) | |
| -others | 58 (24) | 35 (29) | 23 (19) | |
| Variceal bleeding (%) | 47 (19%) | - | 47 (39%) | - |
| Ascites (%) | 79 (33%) | - | 79 (66%) | - |
| Hepatic encephalopathy (%) | 44 (18%) | - | 44 (37%) | - |
| Jaundice (%) | 5 (2%) | - | 5 (4%) | - |
| Child Pugh Class (A/B/C) (%) (n=239) | 114/80/45 (48/33/19) | 96/21/4 (79/18/3) | 18/59/41 15/50/35) | <0.0001 |
| Child Pugh Score (n=239) | 7(5-9) | 5 (5-6) | 9 (7-11) | <0.0001 |
| MELD (n=239) | 12.1 (9.3-17.1) | 9.8 (7.9-12.1) | 15.6 (12.4-21.8) | <0.0001 |
| Bilirubin (mg/dL) (n=239) | 1.3 (0.8-2.6) | 0.9 (0.6-1.4) | 2.3 (1.1-3.9) | <0.0001 |
| Creatinine (mg/dL) (n=241) | 0.9 (0.8-1.1) | 0.9(0.7-1) | 1 (0.8-1.4) | 0.0039 |
| INR (IU) (n=239) | 1.39 (1.20-1.70) | 1.22(1.10-1.40) | 1.60(1.33-1.93) | <0.0001 |
| Albumin (g/dL) (n=239) | 3.26 (0.82) | 3.7(0.63) | 2.82 (0.76) | <0.0001 |
| AST (IU) (n=233) | 58 (36-98) | 49 (32-84) | 71 (40-115) | 0.0008 |
| ALT (IU) (n=233) | 35 (21-65) | 42 (25-75) | 30 (18-57) | 0.006 |
| Platelets (×109/L) (n=231) | 122 (83.5-173.8) | 138 (100.3-197) | 109 (69-139) | <0.0001 |
| Hemoglobin (mg/dL) (n=231) | 12.7 (2.3) | 13.9(1.7) | 11.6 (2.4) | <0.0001 |
| WBC (×103/mm3) (n=231) | 6.3 (4.6-8.3) | 5.9(4.6-7.7) | 7.0(4.7-9.8) | 0.05 |
| Liver transplant (%) | ||||
| Deaths (%) | 62 (26) | 24 (20) | 38 (32) | 0.13 |
| Follow-up (mo) | 30 (6-50) | 48 (22-54) | 14 (1-33) | <0.0001 |
Continuous variables are shown as mean(SD) or median (IQR) depending on their distribution. Some patients had more than one type of clinical decompensation. BP= blood pressure, bpm= beats per minute, MELD= Model for End-stage liver disease, WBC= white blood cells, mo= months.
Total number of patients with available data is specified. If there were no missing data, the total number of patients was 242.
Univariate analysis of factors predictive of death in the entire cohort is shown on table 2. Among all variables, decompensation was the variable associated with the highest hazard ratio (3.06 [95% CI 1.82 – 5.17]). As shown in Figure 1, the probability of death was significantly greater in the decompensated vs. the compensated group.
Table 2.
Univariate analysis of predictors of death in the overall study cohort.
| Hazard ratio | 95% CI | Beta | p value | |
|---|---|---|---|---|
| Decompensation | 3.07 | 1.81-5.18 | 1.12 | <0.0001 |
| Age | 1.04 | 1.01-1.06 | 0.035 | 0.0022 |
| Gender | 1.51 | 0.86-2.67 | 0.414 | 0.154 |
| Etiology * | ||||
| -OH | ---- | ---- | --- | 0.013 |
| -virus | 0.766 | 0.439-1.339 | −0.266 | 0.35 |
| -others | 0.272 | 0.114-0.652 | −1.3 | 0.003 |
| Child Pugh Class | ||||
| A | ----- | ------ | --- | <0.0001 |
| B | 2.93 | 1.55-5.54 | 1.075 | 0.001 |
| C | 12.24 | 6.17-24.26 | 2.505 | <0.0001 |
| Child-Pugh Score | 1.5 | 1.36-1.65 | 0.402 | <0.0001 |
| MELD | 1.11 | 1.09-1.14 | 0.107 | <0.0001 |
| Bilirubin | 1.06 | 1.03-1.08 | 0.053 | <0.0001 |
| Creatinine | 1.44 | 1.24-1.66 | 0.362 | <0.0001 |
| INR | 1.74 | 1.43-2.13 | 0.554 | <0.0001 |
| Albumin | 0.33 | 0.24-0.45 | −1.124 | <0.0001 |
| AST | 1.01 | 1.01-1.01 | 0.009 | 0.0001 |
| Platelets | 0.99 | 0.98-0.99 | −0.011 | <0.0001 |
The reference category is OH (alcohol disease). Beta is the regression coefficient, which is then used to calculate the HR. Decompensation is the variable with the highest hazard ratio. Child C, although with a higher hazard ratio, is part of a composite variable.
Figure 1.
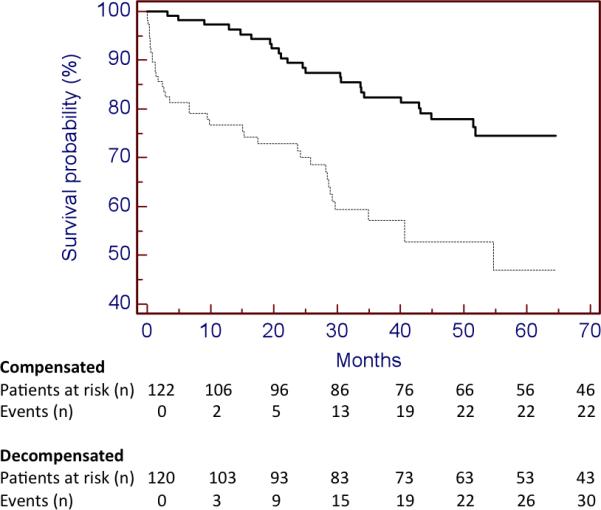
Kaplan-Meier curves of patients in compensated (continuous line) and decompensated cirrhosis (discontinuous line). Log rank test 19.113, p value <0.001.
Stratified univariate analysis (according to the presence of absence of decompensation) was then performed (table 3). Different variables were identified as predictors of death in the compensated and decompensated groups, for example age was identified as an independent predictor of death only in the compensated group while creatinine and INR were identified as independent predictors only in the decompensated group. The presence of interaction, as shown by the identification of different predictors according to the presence or absence of decompensation, underlines the need to evaluate predictors of death separately in compensated and decompensated patients (Suppl. Table 1; Appendix 1 for further explanation of interaction).
Table 3.
Stratified analysis of predictors of death in compensated and decompensated cirrhosis.
| Variables | Compensated (n=122) | Decompensated (n=120) |
|---|---|---|
| Age | 1.07 (1.03-1.11) | 1.00 (0.98-1.04) |
| Male sex | 2.25 (0.84-6.04) | 1.13 (0.56-2.26) |
| Etiology† | ||
| -alcohol | -- | -- |
| -virus | 0.43 (0.18-1.01) | 1.44(0.69-3.01) |
| -others | NE | 1.39 (0.54-3.59) |
| Child-Pugh score | 1.36 (1.12-1.66) | 1.53 (1.32-1.79) |
| MELD | 1.09 (1.02-1.17) | 1.1 (1.07-1.13) |
| Bilirubin | 1.47 (1.19-1.81) | 1.04 (1.01-1.06) |
| Creatinine | 0.98 (0.43-2.23) | 1.35 (1.16-1.56) |
| INR | 1.14 (0.63-2.06) | 1.81(1.44-2.26) |
| Albumin | 0.24 (0.13-0.45) | 0.46 (0.29-0.71) |
| AST | 1.01 (1.00-1.01) | 1.01 (1.01-1.01) |
| Platelets | 0.99 (0.99-1.00) | 0.99 (0.98-1.00) |
* Results refer to hazard ratio (95% confidence interval). When the confidence interval includes the unity, that parameter is not significantly predictive of death for that disease state.
The reference category is alcohol.
NE=not evaluable
Due to the identification of interaction between decompensation and other prognostic variables, two separate multivariate models were constructed for each group (Table 4). Variables included in the models were chosen based on the univariate Cox regression analysis and, in order to avoid overfitting and colinearity, variables that were considered more clinically relevant were chosen (Table 3). In the compensated group the combination of age, albumin and platelets was the best model predictive of death while in the decompensated group MELD, platelets and albumin were identified as independent predictors of death.
Table 4.
Multivariate models predictive of death in A) compensated cirrhosis, B) decompensated cirrhosis
| Table 4A | ||
|---|---|---|
| Compensated (n=122) 24 deaths | ||
| variables | HR (95% CI) | −2LL |
| NULL MODEL | --- | 211.614 |
| Age | 1.08 (1.04-1.13) | 180.674 |
| MELD | --- | |
| Albumin | 0.22 (0.11-0.41) | |
| Age | 1.09 (1.04-1.13) | 184.317 |
| Child-Pugh score | 1.47 (1.14-1.89) | |
| Platelet count | 0.99 (0.98-1) | |
| Age | 1.1 (1.05-1.15) | 174.894 |
| Albumin | 0.22 (0.11-0.44) | |
| Platelet count | 0.99 (0.98-1) | |
| Age | 1.09 (1.04-1.13) | 177.340 |
| Albumin | 0.26 (0.13-0.53) | |
| Bilirubin | 1.3 (1.01-1.69) | |
| Table 4B. | ||
|---|---|---|
| Decompensated (n=120) 35 deaths | ||
| variables | HR (95% CI) | −2LL |
| NULL MODEL | --- | 303.923 |
| Creatinine | 1.34 (1.12-1.60) | 259.745 |
| Child-Pugh Score | 1.50 (1.27-1.78) | |
| AST | 1.01 (1.00-1.01) | |
| Creatinine | 2.12 (1.51-2.97) | 241.702 |
| Child-Pugh Score | 1.33 (1.12-1.59) | |
| platetet count | 0.99 (0.98-1) | |
| MELD | 1.11 (1.07-1.14) | 261.074 |
| albumin | 0.51 (0.34-0.77) | |
| AST | -NP | |
| MELD | 1.12 (1.08-1.17) | 238.292 |
| Albumin | 0.547 (0.36-0.82) | |
| Platelet count | 0.99 (0.98-1) | |
| Creatinine | 1.28 (1.1-1.48) | 281.753 |
| INR | 1.74 (1.36-2.23) | |
| Bilirubin | -NP | |
| Creatinine | 1.37 (1.17-1.61) | 273.624 |
| INR | 1.45 (1.09-1.93) | |
| albumin | 0.49 (0.3-0.79) | |
The best model is shown in italic. When comparing 2 models with the same number of variables, the lower −2LL the better the model in explaining the outcome (in this case, death). NP=not independently predictive of death (and therefore not included in the model)
ROC curves were constructed to evaluate the discriminative ability of the different predictive variables in compensated patients (albumin: c statistic 0.732), and decompensated patients (albumin: c statistic 0.594, MELD: c statistic 0.717) (Fig 2) Interestingly, in the compensated patients, a cut-off albumin of 4 gr/dL (HR 13.3 (95% CI 1.8- 98.8) could identify a subgroup of patients with an extremely good prognosis at 5 years (Fig 3). In decompensated patients the discriminative ability of albumin was weaker, as shown by a worse c-statistic, so that a clinically relevant cut-off could not be identified.
Figure 2.
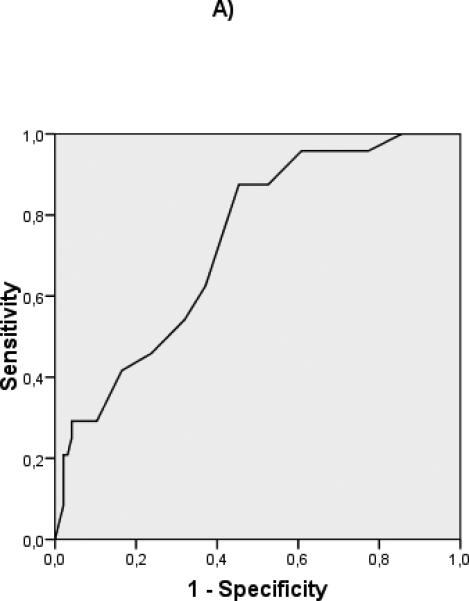
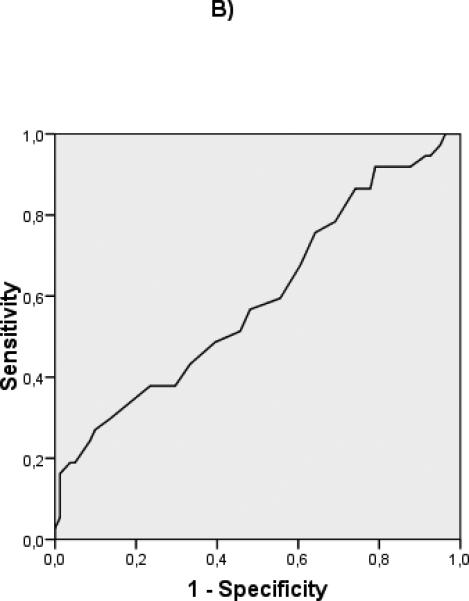
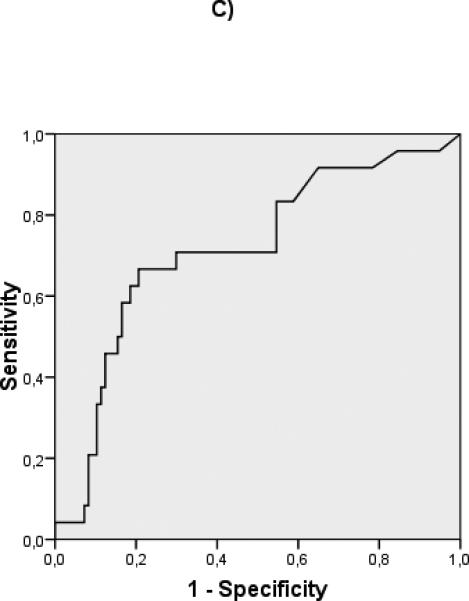
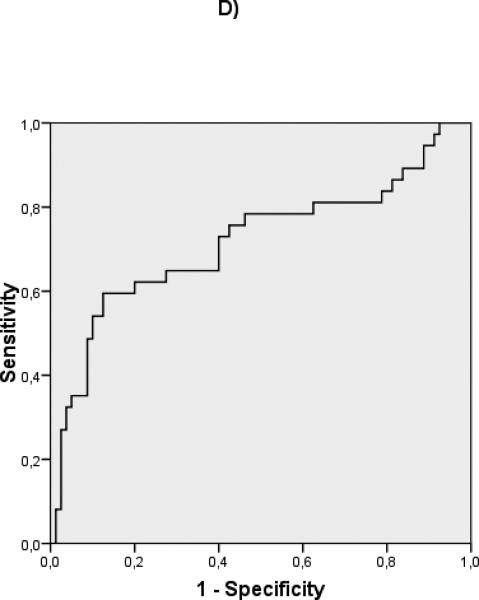
ROC curves of albumin for compensated (A) (c-statistic 0.732) and decompensated (B) (c-statistic 0.594) patients. ROC curves of MELD for compensated (C) (c-statistic 0.715) and decompensated (D) (c-statistic 0.717) patients.
Figure 3.
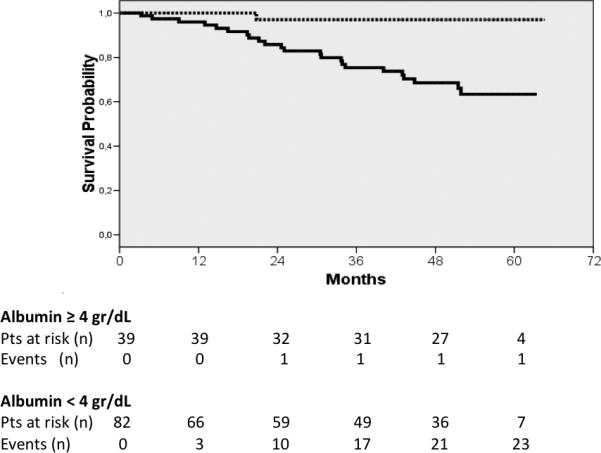
Kaplan-Meier curves of compensated patients according to the cut-off albumin (≥ 4 g/dL discontinuous line, < 4 g/dL continuous line). Log rank test 10.904, p value = 0.001.
Discussion
This study was aimed at evaluating routinely available parameters as predictors of death in a simultaneous cohort of compensated and decompensated patients with cirrhosis. Since this cohort was a more recent cohort of patients receiving state of the art therapies, our first goal was to confirm that decompensation was the strongest predictor of death in the whole cohort. Not unexpectedly, we confirmed this finding. Furthermore interaction between the presence of decompensation and other predictors of death was observed. This finding confirms mathematically that compensated and decompensated cirrhosis are separate entities that must be evaluated and treated separately in clinical and research settings.
As had been shown in the previously published systematic review (1), we found different predictors of death in compensated and decompensated patients. In compensated patients age was the most important predictor (indicating that age-related co-morbidities other than liver disease may play an important role in determining mortality in these patients). In decompensated patients, MELD score was one of the most important predictors of death indicating that advanced liver insufficiency and circulatory dysfunction (vasodilatation leading to activation of vasoconstrictive systems, decreased renal flow and renal dysfunction with consequent elevation in serum creatinine and development of hepatorenal syndrome (6)) are major determinants of death and further validates its use in organ allocation (7). Identification of different predictive variables according to the presence or absence of decompensation is a consequence of interaction, and further underlines the need to evaluate compensated and decompensated patients separately when considering prognosis and predictive factors in patients with end-stage liver disease.
Interestingly, and different from the findings of the systematic review (1), we found that serum albumin and platelet count were predictive of death in both groups, however the predictive weight of serum albumin was different between groups, with it being a more important predictor in compensated disease. In fact in these patients, incidence of decompensation was thirteen times greater in patients with albumin below 4 g/dL in comparison to patients with albumin above this cut-off.
While platelet count may be a surrogate for portal hypertension (i.e. HVPG) as shown by its correlation with the presence of varices (8), albumin is synthesized by the liver and in cirrhosis both the quantity and function of albumin are reduced (9). The quantity of albumin as measured by standard assays, has been previously identified in our timolol cohort of patients with compensated cirrhosis as a predictor of clinical decompensation (in compensated patients) independent of portal pressure. Interestingly, we found serum albumin to be predictive of decompensation at the same cutoff described in the present study of 4.0 g/dL (3, 10). Therefore, subtle abnormalities in serum albumin predicts both clinical decompensation and death in patients with compensated cirrhosis and indicates that, even at an early stage, this subtle liver dysfunction drives the development of poor outcomes. This is information that can be easily obtained in clinical practice in an outpatient setting and may help the physician identify those patients who are more likely to have an adverse outcome in a relatively short time period. Furthermore, it is possible that in decompensated patients, not only a decrease in synthesis but also albumin dysfunction may further impact the decrease in synthesis (9, 11). In fact, a recent study has associated the functional change of albumin in decompensated cirrhosis and mortality (12). This could explain that we observed a weaker relationship between quantitative evaluation of albumin and death in decompensated patients than in compensated patients.
The fact that different predictors are identified in compensated and decompensated disease suggests that the pathophysiological mechanisms implicated in end-stage liver disease are not parallel and linear in their progression, despite the fact that the underlying disease most likely progresses in a continuous fashion. The results of this study and other studies (3,10), suggest that in the compensated stage more information can be derived from markers of portal hypertension and serum albumin values, that mostly reflects the synthetic function of the liver. On the other hand in the decompensated stage of the disease, even though there is impairment of nutritional status and synthetic function, other markers associated to circulatory dysfunction (i.e. creatinine) and other markers of liver synthetic dysfunction (i.e bilirubin and INR) reflected in the MELD score acquire greater relevance for survival prediction (1,13).
Few previously published studies have evaluated predictors of death in concurrent cohorts of compensated and decompensated cirrhosis. A previous study published almost 30 years ago evaluated a consecutive group of compensated and decompensated patients from a very large cohort (14). In this study, and similarly to the present study, age was identified as a predictor of death only in compensated patients while in decompensated patients many variables associated to liver failure were identified. Furthermore, in this previous study, the presence of HBsAg was a relevant predictor both in compensated and decompensated disease. With the development of effective antiviral therapy, this affirmation no longer stands. A more recent study has also evaluated simultaneously survival predictors in compensated and decompensated patients, identifying age in compensated patients and MELD score in decompensated patients as independent predictors of survival (4). However, this study was aimed at evaluating the role of HVPG, an estimation of portal pressure, and therefore the study population was selected according to the performance of this measurement.
The limitations of the study are associated to its design, since it is a secondary analysis of a database that was collected for another aim (5). Other limitations are associated to the relatively small number of outcomes (deaths), however there was sufficient number of events and models were not overfitted. Furthermore, our results are in line with the results from previous studies that evaluate prognosis in compensated and decompensated patients (1, 3, 13, 14).
In summary, we found that albumin is a predictor of death both in compensated and decompensated disease and the use of albumin can help identify subsets of patients with compensated liver disease who have a particularly good prognosis. Furthermore the presence of a differential effect of predictors of death in the presence of clinical decompensation confirms that compensated and decompensated cirrhosis are two separate disease stages that should be evaluated separately in research and clinical practice.
Supplementary Material
Acknowledgements
Guadalupe Garcia-Tsao is the guarantor of the article.
Grant support: Supported by grants from Yale Liver Center NIH P30 DK34989 and partially funded by McNeil Pharmaceuticals.
Abbreviations
- MELD
Model for end stage liver disease
- HR
Hazard ratio
Footnotes
Author contributions: KB collected the data. CR did the analysis and wrote the paper. GGT supervised the data collection and analysis and wrote the paper.
Disclosures: The authors have nothing to disclose relevant to the topic of this manuscript.
References
- 1.D'Amico G, Garcia-Tsao G, Pagliaro L. Natural history and prognostic indicators of survival in cirrhosis: a systematic review of 118 studies. J Hepatol. 2006;44:217–231. doi: 10.1016/j.jhep.2005.10.013. [DOI] [PubMed] [Google Scholar]
- 2.Garcia-Tsao G, Bosch J, Groszmann RJ. Portal hypertension and variceal bleeding--unresolved issues. Summary of an American Association for the study of liver diseases and European Association for the study of the liver single-topic conference. Hepatology. 2008;47:1764–1772. doi: 10.1002/hep.22273. [DOI] [PubMed] [Google Scholar]
- 3.Ripoll C, Groszmann R, Garcia-Tsao G, et al. Hepatic venous pressure gradient predicts clinical decompensation in patients with compensated cirrhosis. Gastroenterology. 2007;133:481–488. doi: 10.1053/j.gastro.2007.05.024. [DOI] [PubMed] [Google Scholar]
- 4.Zipprich A, Garcia-Tsao G, Rogowski S, et al. Prognostic indicators of survival in patients with compensated and decompensated cirrhosis. Liver Int. 2012;32:1407–1414. doi: 10.1111/j.1478-3231.2012.02830.x. [DOI] [PMC free article] [PubMed] [Google Scholar]
- 5.Khalid SK, Lane J, Navarro V, et al. Use of over-the-counter analgesics is not associated with acute decompensation in patients with cirrhosis. Clin Gastroenterol Hepatol. 2009;7:994–999. doi: 10.1016/j.cgh.2009.04.015. quiz 913-994. [DOI] [PMC free article] [PubMed] [Google Scholar]
- 6.Salerno F, Gerbes A, Gines P, et al. Diagnosis, prevention and treatment of hepatorenal syndrome in cirrhosis. Gut. 2007;56:1310–1318. doi: 10.1136/gut.2006.107789. [DOI] [PMC free article] [PubMed] [Google Scholar]
- 7.Kamath PS, Wiesner RH, Malinchoc M. A model to predict survival in patients with end-stage liver disease. Hepatology. 2001;33:464–470. doi: 10.1053/jhep.2001.22172. [DOI] [PubMed] [Google Scholar]
- 8.Berzigotti A, Seijo S, Arena U, et al. Elastography, spleen size, and platelet count identify portal hypertension in patients with compensated cirrhosis. Gastroenterology. 2013;144:102–111. e101. doi: 10.1053/j.gastro.2012.10.001. [DOI] [PubMed] [Google Scholar]
- 9.Garcia-Martinez R, Caraceni P, Bernardi M, et al. Albumin: Pathophysiologic basis of its role in the treatment of cirrhosis and its complications. Hepatology. 2013 doi: 10.1002/hep.26338. [DOI] [PubMed] [Google Scholar]
- 10.Nahon P, Ganne-Carrie N, Degos F, et al. Serum albumin and platelet count but not portal pressure are predictive of death in patients with Child-Pugh A hepatitis C virus-related cirrhosis. Gastroenterol Clin Biol. 2005;29:347–352. doi: 10.1016/s0399-8320(05)80779-1. [DOI] [PubMed] [Google Scholar]
- 11.Klammt S, Mitzner S, Stange J, et al. Albumin-binding function is reduced in patients with decompensated cirrhosis and correlates inversely with severity of liver disease assessed by model for end-stage liver disease. Eur J Gastroenterol Hepatol. 2007;19:257–263. doi: 10.1097/MEG.0b013e3280101f7d. [DOI] [PubMed] [Google Scholar]
- 12.Oettl K, Birner-Gruenberger R, Spindelboeck W, et al. Oxidative albumin damage in chronic liver failure: Relation to albumin binding capacity, liver dysfunction and survival. J Hepatol. 2013 doi: 10.1016/j.jhep.2013.06.013. [DOI] [PubMed] [Google Scholar]
- 13.Ripoll C, Banares R, Rincon D, et al. Influence of hepatic venous pressure gradient on the prediction of survival of patients with cirrhosis in the MELD Era. Hepatology. 2005;42:793–801. doi: 10.1002/hep.20871. [DOI] [PubMed] [Google Scholar]
- 14.D'Amico G, Morabito A, Pagliaro L, et al. Survival and prognostic indicators in compensated and decompensated cirrhosis. Dig Dis Sci. 1986;31:468–475. doi: 10.1007/BF01320309. [DOI] [PubMed] [Google Scholar]
Associated Data
This section collects any data citations, data availability statements, or supplementary materials included in this article.


