

Abstract
Poor sleep quality or quantity impairs glycemic control and increases risk of disease under chronic conditions. Recovery sleep may offset adverse metabolic outcomes of accumulated sleep debt, but the extent to which this occurs is unclear. We examined whether recovery sleep improves glucose metabolism in mice subjected to prolonged sleep disruption, and whether high-fat intake during sleep disruption exacerbates glycemic control. Adult male C57BL/6J mice were subjected to 18-h sleep fragmentation daily for 9 days, followed by 1 day of recovery. During sleep disruption, one group of mice was fed a high-fat diet (HFD) while another group was fed standard laboratory chow. Insulin sensitivity and glucose tolerance were assessed by insulin and glucose tolerance testing at baseline, after 3 and 7 days of sleep disruption, and at the end of the protocol after 24 h of undisturbed sleep opportunity (recovery). To characterize changes in sleep architecture that are associated with sleep debt and recovery, we quantified electroencephalogram (EEG) recordings during sleep fragmentation and recovery periods from an additional group of mice. We now report that 9 days of 18-h daily sleep fragmentation significantly reduces rapid eye movement sleep (REMS) and non-rapid eye movement sleep (NREMS). Mice respond with increases in REMS, but not NREMS, during the daily 6-h undisturbed sleep opportunity. However, both REMS and NREMS increase significantly during the 24-h recovery period. Although sleep disruption alone has no effect in this protocol, high fat feeding in combination with sleep disruption impairs glucose tolerance, effects that are reversed by recovery sleep. Insulin sensitivity modestly improves after 3 days of sleep fragmentation and after 24 h of recovery, with significantly greater improvements in mice exposed to HFD during sleep disruption. Improvements in both glucose tolerance and insulin sensitivity are associated with NREMS rebound, raising the possibility that this sleep phase contributes to restorative effects of recovery sleep on glycemic control.
Keywords: Insulin Resistance, Glucose Tolerance, Sleep, EEG, Sleep Fragmentation
1. Introduction
Chronic sleep loss is a now a common feature of our modern society. Although it has long been known that sleep loss contributes to poor health, only recently has the magnitude of this impact been fully recognized. Epidemiologic studies reveal startling findings. Suboptimal sleep (short or long sleep) is associated with increased odds or hazard ratios for obesity, coronary heart disease, stroke, and diabetes (Ayas et al., 2003; Cappuccio and Miller, 2011; Mallon et al., 2005; von Ruesten et al., 2012).
Although it may be restricted or reduced in amount, a defining feature of sleep of patients with these aforementioned pathologies, and others [e.g., sleep apnea (Svanborg and Guilleminault, 1996), shift work (Akerstedt, 1998), and narcolepsy (Zorick et al., 1986)], is sleep fragmentation. Sleep fragmentation is characterized by recurrent arousals from sleep that disrupt restorative properties of sleep without necessarily curtailing its duration. Sleep fragmentation is more frequently observed in patients with type 2 diabetes than in individuals without (Trento et al., 2008). Moreover, sleep fragmentation reduces insulin sensitivity (Tasali et al., 2008; Stamatakis and Punjabi, 2010) and increases appetite (Gonnissen et al., 2013) even when experimentally induced in healthy individuals, suggesting that disrupted sleep may increase risk of metabolic disease independent of pre-existing conditions.
Chronic sleep loss appears to share some of the same pathophysiologic links to metabolic disease as more traditional risk factors (e.g., obesity). For instance, the relationship between obesity and cardiometabolic diseases is largely driven by the impact of accumulating intra-abdominal adiposity (Despres and Lemieux, 2006), and excessive consumption of dietary fat (particularly of saturated and trans-fatty acids) elicits insulin resistance, glucose intolerance, and pancreatic β-cell dysfunction (Poitout and Robertson, 2008). Poor sleep quality or short sleep duration likewise elicits deleterious effects on glucose metabolism (Reutrakul and Van, 2014). Healthy adults demonstrate reduced insulin sensitivity and impaired glucose tolerance when sleep is disrupted (Stamatakis and Punjabi, 2010; Tasali et al., 2008), and general sleep loss has been found to alter metabolic hormone concentrations (Spiegel et al., 2004; Gonnissen et al. 2013; St-Onge et al., 2012a), food intake (Markwald et al., 2013; Shechter et al., 2012), and brain responses to food stimuli (St-Onge et al., 2012b; Greer et al., 2013) in ways that may promote obesity and metabolic disease. Given that demands of an increasingly 24-7 lifestyle are often met at the expense of optimal sleep and diet, there is a growing need to understand repercussions of, and interactions between, diet-induced obesity and chronic sleep loss.
The aim of the present study was to determine the combined effects of two risk factors on glucose metabolism: high-fat diet (HFD) feeding and sleep disruption. To accomplish this goal, we developed a new protocol based on a validated method (Ringgold et al., 2013; Sutton and Opp, 2014; Trammell et al., 2014) for prolonged sleep disruption of laboratory mice.
2. Material and Methods
2.1. Animals
Adult male C57BL/6J mice (∼25 g at time of use; Jackson Laboratories, Bar Harbor, ME) were housed on a 12:12 light:dark cycle at 29±1°C with standard chow and water provided ad libitum. All procedures involving the use of animals were approved by the University of Washington IACUC in accordance with the US Department of Agriculture Animal Welfare Act and the National Institutes of Health policy on Humane Care and the Use of Laboratory Animals.
2.2. Sleep fragmentation method and protocol
The sleep fragmentation device (Ringgold et al., 2013; Sutton and Opp, 2014) consists of a cylindrical Plexiglas® cylinder divided into two separate compartments. One mouse was placed into each of the two compartments. Mice had visual, olfactory, and vocal contact with conspecifics during all phases of the protocol, and as such they were not isolated. In this study we used the same protocol that we previously published (Ringgold et al., 2013; Sutton and Opp, 2014), except the duration of the sleep fragmentation was extended (see section 2.3). Following habituation to the device, the sleep fragmentation protocol began. During the sleep fragmentation protocol, the disc (floor) of the chamber rotated once for 8 sec during each 30-sec interval, on average. The direction of the rotation was randomized, and the exact placement of the 8-sec rotation within each 30-sec interval was varied. As such, the mice did not habituate to the disc rotation, and as previously demonstrated (Ringgold et al., 2013; Sutton and Opp, 2014), their sleep was dramatically fragmented. During the sleep fragmentation protocol, disc rotations occurred during the last 6 h of the light period, and during the entire 12 h of the dark period. As such, sleep of mice was fragmented for 18 h each day, and spontaneous behavior (no disc rotation) was allowed during the first 6 h of the light period (Fig. 1).
Figure 1. Schematic representation of the sleep fragmentation protocol used in this study.

The 24-h day is depicted in 6-h time blocks beginning with light onset (zeitgeber time 0, ZT0). During the first 6 h of the light phase (ZT0 - ZT6), mice were undisturbed and allowed spontaneous behavior. The 18-h period of sleep fragmentation (ZT6 – ZT0) is depicted by the crosshatch pattern that overlays the light:dark cycle. Lights on: ZT0 – ZT12; Lights off: ZT12 – ZT0.
2.3. Experiment 1: Impact of sleep fragmentation on subsequent recovery sleep and EEG power spectra
In this experiment, mice (n=8) were used to determine the impact of 18-h sleep fragmentation per day for 9 consecutive days on sleep-wake behavior, spectral characteristics of the electroencephalogram (EEG), and general activity. To habituate the mice to the recording apparatus and sleep fragmentation device, all mice were placed on the disc for 3 days before the start of the experiment. During this 3-day period, mice were also connected to the EEG recording system (see section 2.3.1). General cage activity was detected using an infrared sensor (BioBserve, GmbH, Bonn, Germany). Recordings obtained on the last habituation day (day 3) constituted undisturbed baseline, and as such mice served as their own controls. After the 9 days of sleep fragmentation, all mice remained on the device but without disc rotation for an additional 24-h period to determine recovery responses to long-term sleep fragmentation.
2.3.1. Surgical procedures, determination of sleep-wake behavior, and EEG spectral analyses
All mice were surgically instrumented under deep anesthesia (isoflurane: 4% induction, 2% maintenance) with three stainless steel EEG recording electrodes. These electrodes were placed at coordinates over the frontal (from bregma AP: 1.0 mm; DL: 1.0 mm) and parietal (from bregma AP: -2.5 mm; DL: ±1.5 mm) cortices. A miniature calibrated 10 kΩ thermistor (AB6E3-GC16KA103L, Thermometrics, CA) was also implanted over the parietal cortex between the dura mater and skull to measure brain temperature. Leads from the EEG recording electrodes and the thermistor were gathered into a connector, which was fastened to the skull using dental acrylic (Mydent International, Hauppauge, NY). Analgesia was provided at the time of surgery by subcutaneous injection of buprenorphine (0.05 mg / kg) as well as topical application of 4% lidocaine at the incision site. Penicillin (1.2 × 10⁶ IU / kg; SC) was also provided to minimize risk of infection. Mice were allowed to recover for at least 10 days before the start of the experiment. The mice were connected to the recording system by plugging a lightweight, flexible tether into the headpiece connector. This tether was attached to a spring-loaded (counterbalanced) swing arm that could pivot, which allowed the animals unrestricted movement in the disruption device.
Arousal states were determined as previously described (Morrow and Opp, 2005; Baracchi and Opp, 2008; Olivadoti and Opp, 2008; Olivadoti et al., 2011; Febinger et al., 2014), and classified as non-rapid eye movement sleep (NREMS), rapid eye movement sleep (REMS), or wakefulness (WAKE). In our previous studies in which sleep of mice was not experimentally fragmented, we designated arousal state using a 10-sec epoch, which is an appropriate epoch length for describing mouse sleep-wake behavior. However, because the sleep fragmentation protocol consisted of an 8-sec disc rotation, in this and our previous studies in which mouse sleep was fragmented (Ringgold et al., 2013; Sutton and Opp, 2014), we used a 4-sec epoch length to assign arousal state. Artifact-free EEG epochs were subjected to fast Fourier transformation (FFT) to yield power spectra in 0.5 Hz frequency bins between 0.5 and 20 Hz. These artifact-free FFT spectra were matched to NREMS, REMS and WAKE epochs to obtain state-specific power spectra (Baracchi and Opp, 2008). Power in the delta (0.5 – 4.0 Hz) and theta (6.0 – 9.0 Hz) frequency bands within each hour was determined by averaging power density values from each epoch scored as NREMS or REMS, respectively. We restricted analysis of EEG spectra to the 6 h of undisturbed sleep opportunity that occurred at the beginning of the light period because the sleep fragmentation protocol resulted in experimentally shortened bouts of NREMS and REMS.
2.4. Experiment 2: Impact of sleep fragmentation with or without high-fat feeding on glucose metabolism and energy balance
Additional cohorts of un-operated mice were used to determine the impact of prolonged sleep fragmentation and recovery on glucose tolerance (n=28) and insulin sensitivity (n=16). These mice were subjected to the same sleep fragmentation protocol used in Experiment 1. Within each cohort, mice were randomly divided into two groups that were equivalent with respect to average body mass. All mice were habituated to housing in sleep disruption devices for 3 days prior to the start of sleep fragmentation and diet manipulation. On the day the sleep fragmentation protocol began, half of the mice (n=14 for glucose tolerance tests, n=8 for insulin sensitivity tests) were provided a high-fat diet (HFD, 60% kcal from fat; Research Diets, New Brunswick, NJ), whereas the remaining mice continued on standard laboratory chow diet (PicoLab Rodent Diet 20, 13.1% kcal from fat; Labdiet, St. Louis, MO). Mice were subjected to sleep fragmentation and diet conditions for 9 days, then allowed a 24-h period to recover. During recovery, all mice were fed standard laboratory chow, except a subset of mice from glucose tolerance studies that remained on HFD (n=6). Insulin and glucose tolerance was determined in separate cohorts of mice at 4 time points throughout the protocol: prior to the start of sleep fragmentation and diet manipulation (baseline); after 3 days and 7 days sleep fragmentation; and after the 24-h recovery period.
Body mass, food intake, and water consumption were measured daily in all mice at light onset throughout the habituation, sleep fragmentation, and recovery periods. Measures of food intake estimated and accounted for the amount of spilled, unconsumed food. However, food spillage could not be accurately ascribed to individual mice due to shared occupancy of the apparatus and disc (floor) rotation. Both mice in a given device were subjected to the same diet manipulation, and as such food intake was calculated as a mean value for pairs of mice housed within that device.
2.4.1. Insulin tolerance testing (ITT)
Insulin sensitivity was assessed via intraperitoneal (IP) insulin tolerance testing (IPITT). To habituate mice to testing procedures, mice were handled daily for at least 5 days. For 3 days prior to the initial IPITT, i.e., during habituation, all mice were given a daily IP injection of 0.9% pyrogen-free saline. On each of the test days, mice were fasted for 4 h at the start of the light cycle, and then received an IP injection of insulin (Humulin R, 1U / kg, Eli Lilly, Indianapolis, IN). As such, IPITTs occurred before any sleep fragmentation on the baseline day, and were timed just prior to the start of sleep fragmentation on day 4 and day 8 of the protocol. Blood samples were taken from the tail vein immediately after insulin injections, and blood glucose measured using a glucometer validated for use in rodents (AlphaTRAK2, Abbott Laboratories, North Chicago, IL). Blood glucose was measured from tail vein blood samples again at 30-, 60-, 90-, and 120 min after insulin injection. Food was returned after the last sample collection at 120 min, which was immediately before the start of sleep fragmentation.
2.4.2. Glucose tolerance testing (GTT)
Glucose tolerance was determined in a separate set of mice in a similar fashion as IPITTs, except that mice were fasted for 6 h at the start of the light cycle. Blood glucose was measured by glucometer before and 15-, 30-, 60-, 90-, and 120 min after IP injection of glucose (2 g/kg, Sigma-Aldrich, St. Louis, MO).
2.5. Statistical analyses
For NREMS, REMS, WAKE data and brain temperature, a one-way ANOVA was used. If appropriate, post-hoc evaluation was performed using Tukey's test. For EEG spectral analyses, paired t-tests were used to determine if the peak frequency for a given manipulation and behavioral state (0.5 – 4 Hz, NREM; 6.0 – 9.0 Hz, REM) differed between baseline and sleep fragmented conditions. For NREM delta power, a repeated-measures ANOVA was performed across the 6-h recovery period at the beginning of each light phase, followed by post-hoc evaluation with Tukey's test, if appropriate. Some hours during the 6 h at the beginning of the light period did not contain enough REMS to allow for spectral analysis. Consequently, REM delta power could not be analyzed using repeated-measures ANOVA because of missing data for some mice. For that reason, a one-way ANOVA was performed using the average REM theta power across the 6-h recovery period at the beginning of the light phase.
Responses to glucose and insulin tolerance testing were quantified by calculating area under the curve (AUC) with trapezoidal integration. Glycemic responses of HFD- and standard chow-fed mice were compared at each time point with unpaired t-tests and responses between baseline and subsequent days were compared with paired t-tests. Mice (chow, n=3; HFD, n=4) that failed to respond to glucose or insulin injections during tolerance tests were excluded from statistical analyses. Analyses of body mass, food intake, and water consumption were conducted in mice from glucose and insulin tolerance studies using repeated-measures ANOVAs for comparisons during sleep fragmentation. One-way ANOVAs were conducted for group comparisons on the recovery day. Post-hoc Tukey's or unpaired t-tests were conducted where significance was achieved. All data in text and figures are expressed as averages ± SEM. p<0.05 was considered statistically significant.
3. Results
3.1. Experiment 1: Impact of sleep fragmentation on subsequent recovery sleep and EEG power spectra
Fragmenting sleep of mice for 18 h / day for 9 days affected all sleep parameters (Fig. 2). During sleep fragmentation in the second half of the light phase (ZT7 – ZT12), time spent in REMS and NREMS were significantly decreased compared to baseline concomitant with increased time awake (REMS: F(5,36)= 75.340, p<0.001; NREMS: F(5,36)= 28.938, p<0.001; WAKE: F(3,36)= 42.410, p<0.001). Similar patterns were observed during the 12-h dark phase (ZT13 – ZT0) but changes in sleep/wake behavior were of smaller magnitude (REM: F(5,36)= 36.090, p<0.001; NREM: F(5,36)= 4.193, p<0.01; WAKE: F(3,36)= 3.827, p<0.01). Post-hoc tests revealed that for both phases of sleep fragmentation, time spent in REMS, but not NREMS, increased during the recovery day (p<0.05).
Figure 2. 18 h/day of sleep fragmentation (SF) decreases time in sleep and transiently increases brain temperature (Tbr).

Rebounds in rapid eye movement (REM) sleep, but not non-rapid eye movement (NREM) sleep, sleep occur during the daily 6-h opportunity for undisturbed sleep. Values are mean ± SEM percentage of recording time spent in sleep-wake states obtained from mice (n=8) housed on the SF device prior to disc rotation (baseline), during the SF protocol, and during the 24-h undisturbed recovery period. During the SF protocol, mice were undisturbed from light onset (zeitgeber time 0, ZT0) to ZT6. SF began at ZT6 and continued for the next 18 h. As such, SF occurred during the last 6 h of the light period and during the 12-h dark period. Data were analyzed using one-way ANOVAs and Tukey's HSD post-hoc test for multiple comparisons. * = p<0.05 vs. baseline; # = p<0.05 vs. recovery; + = p<0.05 vs. Day 1 SF; WAKE, wakefulness.
During the 6-h undisturbed sleep opportunity (ZT0 – ZT6), REMS time increased across all days of sleep fragmentation and during recovery (F(5,42)= 5.419, p<0.01). In turn, time spent awake decreased significantly during sleep manipulation and recovery (F(5,42)= 3.853, p<0.01). Time spent in NREMS also increased (F(5,42)= 4.703, p<0.01), but post-hoc comparisons suggest this effect was driven primarily by the increase during recovery.
Brain temperature increased during sleep fragmentation in the second half of the light phase (ZT7 – ZT12) (F(5,36)= 8.964, p<0.001; Fig. 2). However, post-hoc tests revealed that brain temperature is only significantly elevated from baseline on the first day of sleep fragmentation. Brain temperature was not significantly affected on other days or at any other time of day (p<0.05).
Because our sleep fragmentation protocol results in very short NREMS bouts and almost no bouts of REMS, EEG spectra were analyzed only during the first 6 h of the light period (ZT0 – ZT6) when mice were allowed undisturbed sleep. Spectral analyses of power in the peak frequency of the delta frequency band (0.5 – 4.0 Hz) during NREMS demonstrate an increase on Day 3 of the sleep fragmentation protocol that reached statistical significance on Day 7 and returned to baseline by recovery (Fig. 3; baseline vs. Day 1: t=-1.037, p=0.340; vs. Day 3: t=-026, p=0.089; vs. Day 7: t=-3.370, p=0.015; vs. Day 9: t=-1.618, p=0.157; vs. recovery: t=-0.801, p=0.453). NREM delta power increased significantly on days 7 and 9 of the protocol and returned to baseline by recovery (Fig. 3; baseline vs. Day 1: F(1,12)= 0.108, p=0.748; vs. Day 3: F(1,11)= 1.348, p=0.270; vs. Day 7: F(1,12)= 10.598, p=0.007; vs. Day 9: F(1,12)= 5.222, p=0.041; vs. recovery: F(1,12)= 0.610, p=0.410).
Figure 3. Sleep pressure accumulates during prolonged sleep fragmentation (SF).

The magnitude of the peak spectral power in the delta frequency band (0.5 - 4.0 Hz) increases during the 9-day SF protocol with a peak on Day 7 (left panels). Spectral analyses were conducted on artifact-free electroencephalogram epochs of non-rapid eye movement (NREM) sleep during the daily 6 h of undisturbed sleep opportunity. Hourly averages for NREM delta power were quantified prior to disc rotation (baseline), during the SF protocol, and during the 24-h recovery period (right panels). Values are means ± SEM for n=7 mice. NREM spectra in the delta frequency band (0.5 - 4.0 Hz) were analyzed with paired t-tests and NREM delta power was analyzed with repeated-measures ANOVA and Tukey's HSD post-hoc test for multiple comparisons. * = p<0.05; ** = p<0.01.
Spectral analyses of power in the peak frequency of the theta frequency band (6.0 – 9.0 Hz) during REMS revealed a significant decrease on Day 1 of sleep fragmentation, and significant increases on days 7, 9, and recovery (Fig. 4; baseline vs. Day 1: t=3.612, p=0.011; vs. Day 3: t=-0.795, p=0.457; vs. Day 7: t=-3.712, p=0.010; vs. Day 9: t=-3.500, p=0.013; vs. recovery: t=-3.355, p=0.015). REM theta power significantly decreased on Day 1 and increased slightly, albeit non-significantly, on Day 7 of sleep fragmentation (Fig. 4; baseline vs. Day 1: F(1,14)= 8.149, p=0.013; vs. Day 3: F(1,14)= 0.182, p=0.676; vs. Day 7: F(1,14)= 3.286, p=0.091; vs. Day 9: F(1,14)= 2.552, p=0.132; vs. recovery: F(1,14)= 1.995, p=0.180).
Figure 4. REM theta pressure accumulates during prolonged sleep fragmentation (SF).

The magnitude of the peak spectral power in the theta frequency band (6.0 - 9.0 Hz) increases across days of SF and continues into the recovery day (left panels). Spectral analyses were conducted on artifact-free electroencephalogram epochs of rapid eye movement (REM) sleep during the daily 6 h of undisturbed sleep opportunity. Hourly averages for REM theta power were quantified prior to disc rotation (baseline), during the SF protocol, and during the 24-h recovery period (right panels). Values are means ± SEM for n=7 mice. REM spectra in the theta frequency band (6.0 - 9.0 Hz) were analyzed with paired t-tests and REM theta power was analyzed using a one-way ANOVA. * = p<0.05.
3.2. Experiment 2: Impact of sleep fragmentation with or without high-fat feeding on glucose metabolism and energy balance
Sleep fragmentation alone did not appreciably alter glucose tolerance as quantified by 2-h integrated area under the curve (AUC) at any time during our protocol (Fig. 5). However, mice exposed to HFD during sleep disruption demonstrated significant reductions in glucose tolerance (Fig. 5; F(1,22)= 10.956, p=0.003) relative to baseline (t=-3.130, p=0.008) and chow-fed sleep-fragmented mice (t=-2.246, p=0.033) after 3 days. Further decrements in glucose tolerance were observed after 7 days in HFD-fed sleep-fragmented mice (7 days vs. baseline: t=-3.686, p=0.003; HFD vs. chow: t=-3.854, p=0.001). To isolate effects of sleep and diet on recovery, mice that were previously fed HFD during sleep fragmentation were randomly assigned to either remain on HFD or return to standard chow diet during the 24-h recovery period. Because no differences in glucose tolerance were observed between recovery diets Fig. 5; p>0.05), data from these mice were combined into one group (i.e., SF HFD) for subsequent analyses. After 24 h of undisturbed sleep opportunity, glucose tolerance did not differ among groups of mice relative to baseline values (Fig. 5, p>0.05).
Figure 5. Recovery sleep improves glucose metabolism.
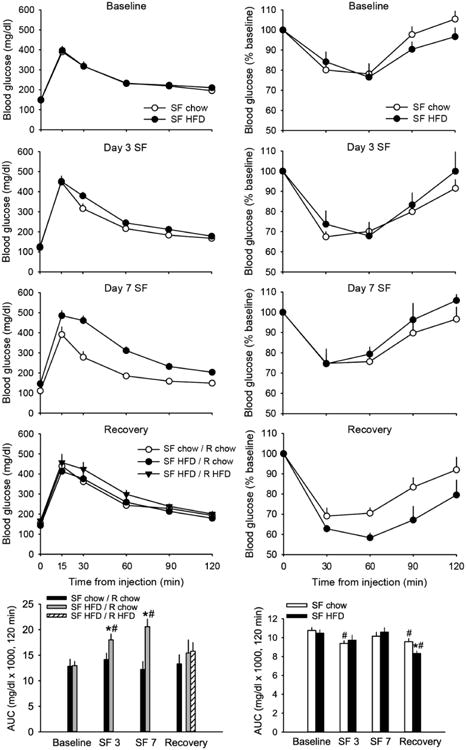
Glucose tolerance (left panels) decreases in mice exposed to high-fat diet (HFD) during sleep fragmentation (SF), but not in mice exposed to SF alone (SF chow / R chow). During recovery, mice fed HFD during SF either continued with high-fat feeding (SF HFD / R HFD) or returned to chow diet (SF HFD / R chow). Impairments are reversed with recovery sleep irrespective of recovery diet. Insulin sensitivity (right panels) increases in chow-fed mice after 3 days of SF and in both groups of mice after recovery. Glucose tolerance and insulin sensitivity were determined by quantifying area under the curve (AUC) of incremental and percent changes in blood glucose responses, respectively, in tolerance tests prior to disc rotation (baseline), after 3 and 7 days of SF, and after 24-h recovery. Some mice failed to respond to glucose or insulin administration at various time points during experimentation, which resulted in the following sample sizes: glucose tolerance tests: n=12-14/group during SF; n=6 for SF HFD groups during recovery; insulin tolerance tests: n=7-8/group. Values are expressed as means ± SEM. Statistical significance: # = p<0.05 vs. Baseline, * = p<0.05 HFD vs. chow.
Prior to sleep and diet manipulations (baseline), mice responded to IP insulin administration with a ∼20% reduction (at nadir) in blood glucose from fasting levels (Fig. 5). Responses following 3 or 7 days of 18-h SF increased to 25-30% reductions. When blood glucose responses were quantified as AUC across the 2-h test, analyses revealed a significant increase in sensitivity from baseline for chow- but not HFD-fed mice after 3 days of sleep fragmentation (Fig. 5; chow: t=2.994, p=0.024; HFD: t=1.550, p=0.172). No differences from baseline were observed after Day 7 for either group, and AUC did not significantly differ with diet at baseline or either time point during the course of sleep fragmentation (p>0.05). However, after the 24-h recovery period (and return to chow feeding for all mice), both groups of mice demonstrated significantly greater insulin sensitivity compared to baseline (Fig. 5; chow: t=2.524, p=0.045; HFD: t=4.558, p=0.004). In addition, mice previously subjected to HFD demonstrated significantly greater insulin sensitivity compared to chow-fed mice (as quantified by AUC). At this time point, HFD-fed mice exhibited a ∼40% decrement from fasting blood glucose levels that was significantly different from chow-fed mice (t=3.007, p=0.010).
Relative to chow-fed mice, mice fed HFD demonstrated greater reductions in body mass upon initial exposure to sleep fragmentation, particularly after the first two days. However, HFD-fed mice regained body mass over the course of the protocol such that the overall effect of diet was not statistically significant (Fig. 6; p>0.05). A significant main effect of diet was observed with respect to cumulative food intake (Fig. 6; F(1,42)=6.166, p=0.017). Post-hoc tests revealed significantly greater cumulative food intake across all days of SF (p<0.05). Water consumption decreased significantly with high-fat feeding (Fig. 6; F(1,42)=11.578, p=0.001) across all days of SF (p<0.05). During recovery, mice that remained on HFD continued to gain body mass, whereas those that were switched to standard chow lost weight relative to mice that remained on chow throughout experimentation (F(2,39)=11.393, p<0.001; one-way ANOVA). Whereas cumulative food intake remained higher in mice previously fed HFD during the SF, this was not statistically significant on the recovery day (F(2,39)=3.175, p=0.053; one-way ANOVA). Cumulative water intake remained higher in mice fed standard chow during recovery, but only differed significantly from mice that continued with HFD feeding (F(2,39)=7.010, p=0.003; oneway ANOVA).
Figure 6. High-fat feeding increases food intake, decreases water consumption and transiently decreases body mass during sleep fragmentation (SF).
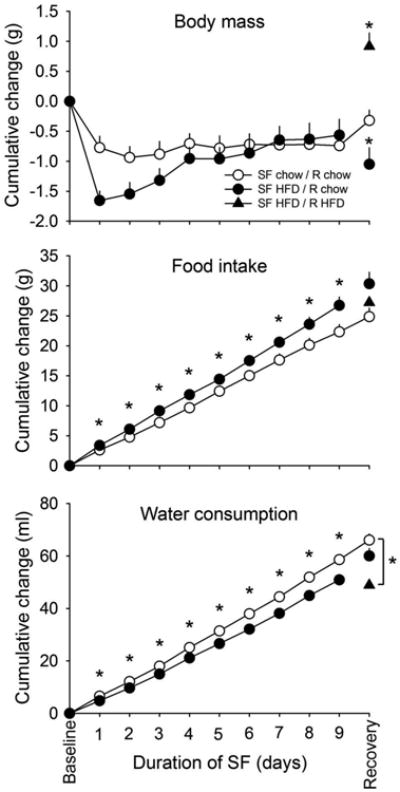
Cumulative changes in body mass, food intake, and water consumption during the 9-day SF protocol were determined in mice from glucose and insulin tolerance studies (n=20/group during SF; n=14 for SF HFD / R chow and n=6 for SF HFD / R HFD during recovery. Values are expressed as means ± SEM and were analyzed with repeated-measures ANOVAs during SF, one-way ANOVA during recovery, and post-hoc unpaired t-tests. Statistical significance: * = p<0.05
4. Discussion
Sleep insufficiency and poor sleep hygiene are major causes of concern for the health of today's society. Epidemiological studies demonstrate clear associations between chronic suboptimal sleep and chronic disease, including increased risk of incident diabetes (Liu et al., 2013). Moreover, chronic suboptimal sleep may impede efforts to improve existing health conditions. For example, sleep fragmentation is associated with less weight reduction following weight-loss intervention (Sawamoto et al., 2014) and with poorer indices of glycemic control in patients with type 2 diabetes (Knutson et al., 2011). These findings suggest that insufficient sleep promotes and exacerbates metabolic impairments. Here we demonstrate that REM and NREM sleep disruption combined with high-fat feeding significantly reduces glucose tolerance in the absence of impaired insulin sensitivity in mice. These effects are not observed in mice exposed to sleep disruption alone, but reversal of HFD effects on glucose tolerance appears to be driven by recovery sleep.
Chronic insufficient sleep quality or quantity negatively impacts glucose metabolism in part because contributions of insulin secretion and/or sensitivity fail to maintain glucose homeostasis (Reutrakul and Van Cauter, 2014). In the present study, chow-fed mice are more sensitive to insulin after 3 days of sleep fragmentation and after recovery without changes in glucose tolerance. Although unexpected, increased insulin sensitivity may reflect compensatory responses to impaired early insulin release, as suggested by heightened glucose excursions from baseline 15 min post-glucose load (Fig. 5). Interestingly, 2-h integrated insulin sensitivity does not vary significantly during the course of sleep fragmentation in mice fed HFD, which may contribute to the development of glucose intolerance. However, blood glucose nadirs after insulin challenge decrease in both groups over time. In a previous study, Zhang and colleagues observed initial increases in visceral fat insulin sensitivity in mice after 3 days of 12-h sleep fragmentation (Zhang et al., 2014). Insulin sensitivity eventually decreased with prolonged exposure to sleep fragmentation, such that after 14 days visceral fat and systemic insulin sensitivity were significantly lower than baseline values. Thus, whereas 7-day sleep disruption in our protocol is not sufficient to impair insulin sensitivity or glucose tolerance, exaggerated postchallenge glucose excursions suggest responses to prolonged sleep disruption that may eventually manifest as glucose intolerance and/or insulin resistance.
Sleep fragmentation in this model only impairs glucose tolerance when combined with high-fat feeding. The reasons that sleep fragmentation per se does not impair glucose tolerance are not clear, but could be due to conservation of delta power during NREM sleep. Tasali and colleagues (Tasali et al., 2008) report that 3 nights of selective suppression of slow wave sleep without reducing total sleep time impairs glucose tolerance. Additionally, insulin sensitivity correlates strongly with the magnitude of slow wave sleep suppression, suggesting that slow wave sleep contributes to the maintenance of normal glucose homeostasis. Similarly, slow wave activity in adolescents correlates with insulin sensitivity such that individuals with low insulin sensitivity demonstrate significantly lower delta power during the first NREM period (Armitage et. al., 2013). These studies in human volunteers suggest mice in our study maintain glucose homeostasis in spite of sleep fragmentation because delta power (slow wave activity) is elevated during the period of sleep fragmentation, which may counter some of the effects of sleep disruption. Additional experiments are necessary to directly test this hypothesis.
The effects of high-fat feeding combined with sleep disruption on glucose tolerance are reversed with 24 h of undisturbed recovery sleep opportunity. The effect of recovery on glucose tolerance appears to be driven by rebound sleep, rather than cessation of high-fat feeding, because improvements in glucose tolerance are indistinguishable between mice that continue on HFD and those that return to standard chow diet during sleep recovery (Fig. 5). These findings demonstrate a novel effect of sleep per se on ameliorating HFD-induced deficits in glucose tolerance. That post-recovery insulin sensitivity also improves to a greater extent in HFD-fed mice may further demonstrate interactions between sleep and diet on metabolic outcomes. Indeed, rodents fed high-energy diets respond with increased NREMS (Danguir, 1987; Hansen et al., 1998; Jenkins et al., 2006). These findings suggest that sleep disruption may elicit greater sleep propensity in HFD-fed mice than in chow-fed mice, and may explain why only HFD-fed mice demonstrate impaired glucose tolerance in our protocol.
The metabolic consequences of suboptimal sleep are widespread, and the extent to which recovery sleep ameliorates deficits induced by sleep loss remains an active area of investigation (Killick et al., 2012). Although few have examined metabolic effects of recovery sleep after sleep restriction, studies to date indicate that recovery sleep is associated with improvements in metabolic status. In studies that compare metabolic outcomes after 5-6 nights of sleep restriction (e.g., 4-h time in bed) to those after 2-7 nights of sleep recovery/extension (e.g., 8-12-h time in bed), deficits in glucose metabolism including glucose tolerance, hyperinsulinemia, and impaired insulin responses to glucose were found to improve or normalize after recovery (Spiegel et al., 1999). In a model of weekend recovery sleep, significant improvements in fasting insulinemia and insulin sensitivity occur after 3 nights of “catch-up” sleep (10-h time in bed) (Killick et al., 2015). Additionally, a recent study found that increased sleep durations as a result of 6-week sleep intervention (1 h increased nightly time in bed) is associated with improved fasting insulin concentrations and indices of insulin sensitivity. Correlations with improved metabolic indices were particularly evident with increased N2 sleep time, thus providing further evidence that NREMS contributes positively to glucose metabolism.
Rodent sleep shares many characteristics and features with human sleep. However, whereas human sleep is primarily monophasic and occurs during the night, sleep of laboratory mice is polyphasic and occurs during the light period and the dark period. Because of this feature, manipulations aimed at determining the impact of disrupting their sleep must also account for the fact that mice spend a substantial amount of time asleep during the dark period. In the present studies, we used a mouse model in which sleep fragmentation occurred for 18 h per day. Using a similar protocol and methods to disrupt sleep, we previously published that sleep fragmentation restricted to the 12-h light period essentially abolishes REMS during the light period without affecting time in REMS during subsequent (undisturbed) dark periods across all time points (1, 3, and 9 days) of sleep fragmentation (Ringgold et al., 2013). NREMS during the 12-h fragmentation period is modestly reduced only on the first day of sleep fragmentation, and no rebound in NREMS occurs during dark periods. We now demonstrate that 18 h of sleep fragmentation per day significantly decreases REMS and NREMS across all time points (i.e., 1, 3, 7, and 9 days of sleep fragmentation). During the 6-h period of uninterrupted sleep opportunity (ZT0 – ZT6), increases in REMS, but not NREMS are observed across all days of sleep fragmentation. That is, there is a daily rebound in REMS, but not NREMS. When allowed 24 h of undisturbed recovery time, mice spend more time in REMS during all times of day and more time in NREMS during the first half of the light period, the 6-h period that previously was the undisturbed sleep opportunity. Thus, whereas 9 days of 18-h sleep fragmentation/day elicits daily rebounds in REMS upon immediate opportunity for undisturbed sleep, a rebound in NREMS occurs only when a prolonged (24-h) period of recovery is allowed. However, power in the delta frequency band (0.5-4.0 Hz) during uninterrupted sleep opportunities increases across the 9-day protocol, indicating increased sleep pressure with prolonged exposure to sleep fragmentation
It is increasingly evident that chronic insufficient sleep, whether of recreational, vocational, or clinical origin, elicits profound effects on metabolic health. In the present study, we demonstrate that sleep disruption alone does not impact glucose tolerance during the 9-day protocol we use suggesting that glucose homeostasis, at least initially, is strongly defended. However, we report the novel finding that recovery sleep may be important in ameliorating deficits induced by other factors, such as high-fat feeding. Additional studies are needed to address the extent and time course by which metabolic impairment induced by sleep debt is resolved during recovery sleep. Current research of mechanisms by which chronic suboptimal sleep promotes metabolic disease implicates multiple contributing factors, including, but not limited to, oxidative stress, circadian misalignment, changes in the gut microbiome, and inflammation. A better understanding of underlying relationships among these predisposing factors and metabolic disease will improve our ability to mitigate adverse outcomes of chronic suboptimal sleep.
Highlights.
Sleep fragmentation for 18-h per day reduces time in REMS and NREMS with dialy rebounds in REMS
NREMS rebound occurs only during the 24-h recovery period after 9 days of sleep fragmentation
Insulin sensitivity is sustained during sleep disruption and improves after recovery sleep
HFD-induced glucose intolerance during sleep disruption improves after recovery sleep
Acknowledgments
This work was funded by the University of Washington Department of Anesthesiology and Pain Medicine, and by NIH training grants 2T32DK007247 and 1F32DK103491 (JMH).
JMH conceived of the study to determine the impact of sleep fragmentation on insulin sensitivity in mice. RPB designed the sleep fragmentation protocol. JMH and RPB analyzed data and wrote the first draft of the manuscript. MRO provided overall leadership to the project, obtained funds from the Department of Anesthesiology & Pain Medicine to support the project, and edited the final version of the manuscript.
Role of funding source: The University of Washington Department of Anesthesiology and Pain Medicine provided discretionary funds to conduct this research. Dr. Ho's NRSA stipend was provided by awards from NIH.
Footnotes
Conflict of interest: The authors declare there are no conflicts of interest
Publisher's Disclaimer: This is a PDF file of an unedited manuscript that has been accepted for publication. As a service to our customers we are providing this early version of the manuscript. The manuscript will undergo copyediting, typesetting, and review of the resulting proof before it is published in its final citable form. Please note that during the production process errors may be discovered which could affect the content, and all legal disclaimers that apply to the journal pertain.
References
- Akerstedt T. Shift work and disturbed sleep/wakefulness. Sleep Med Rev. 1998;2:117–128. doi: 10.1016/s1087-0792(98)90004-1. [DOI] [PubMed] [Google Scholar]
- Armitage R, Lee J, Bertram H, Hoffmann R. A preliminary study of slow-wave EEG activity and insulin sensitivity in adolescents. Sleep Med. 2013;14:257–260. doi: 10.1016/j.sleep.2012.11.012. [DOI] [PMC free article] [PubMed] [Google Scholar]
- Ayas NT, White DP, Manson JE, Stampfer MJ, Speizer FE, Malhotra A, Hu FB. A prospective study of sleep duration and coronary heart disease in women. Arch Intern Med. 2003;163:205–209. doi: 10.1001/archinte.163.2.205. [DOI] [PubMed] [Google Scholar]
- Baracchi F, Opp MR. Sleep-wake behavior and responses to sleep deprivation of mice lacking both interleukin-1 beta receptor 1 and tumor necrosis factor-alpha receptor 1. Brain Behav Immun. 2008;22:982–993. doi: 10.1016/j.bbi.2008.02.001. [DOI] [PMC free article] [PubMed] [Google Scholar]
- Cappuccio FP, Miller MA. Are short bad sleep nights a hindrance to a healthy heart? Sleep. 2011;34:1457–1458. doi: 10.5665/sleep.1372. [DOI] [PMC free article] [PubMed] [Google Scholar]
- Danguir J. Cafeteria diet promotes sleep in rats. Appetite. 1987;8:49–53. doi: 10.1016/s0195-6663(87)80026-0. [DOI] [PubMed] [Google Scholar]
- Despres JP, Lemieux I. Abdominal obesity and metabolic syndrome. Nature. 2006;444:881–887. doi: 10.1038/nature05488. [DOI] [PubMed] [Google Scholar]
- Febinger HY, George A, Priestley J, Toth LA, Opp MR. Effects of housing condition and cage change on characteristics of sleep in mice. J Am Assoc Lab Anim Sci. 2014;53:29–37. [PMC free article] [PubMed] [Google Scholar]
- Gonnissen HK, Hursel R, Rutters F, Martens EA, Westerterp-Plantenga MS. Effects of sleep fragmentation on appetite and related hormone concentrations over 24 h in healthy men. Br J Nutr. 2013;109:748–756. doi: 10.1017/S0007114512001894. [DOI] [PubMed] [Google Scholar]
- Greer SM, Goldstein AN, Walker MP. The impact of sleep deprivation on food desire in the human brain. Nat Commun. 2013;4:2259. doi: 10.1038/ncomms3259. [DOI] [PMC free article] [PubMed] [Google Scholar]
- Hansen MK, Kapás L, Fang J, Krueger JM. Cafeteria diet-induced sleep is blocked by subdiaphragmatic vagotomy in rats. Am J Physiol. 1998;274:R168–R174. doi: 10.1152/ajpregu.1998.274.1.R168. [DOI] [PubMed] [Google Scholar]
- Jenkins JB, Omori T, Guan Z, Vgontzas AN, Bixler EO, Fang J. Sleep is increased in mice with obesity induced by high-fat food. Physiol Behav. 2006;87:255–262. doi: 10.1016/j.physbeh.2005.10.010. [DOI] [PubMed] [Google Scholar]
- Killick R, Banks S, Liu PY. Implications of sleep restriction and recovery on metabolic outcomes. J Clin Endocrinol Metab. 2012;97:3876–3890. doi: 10.1210/jc.2012-1845. [DOI] [PMC free article] [PubMed] [Google Scholar]
- Killick R, Hoyos CM, Melehan KL, Dungan GC, Poh J, Liu PY. Metabolic and hormonal effects of ‘catch-up’ sleep in men with chronic, repetitive, lifestyle-driven sleep restriction. Clin Endocrinol (Oxf) 2015 doi: 10.1111/cen.12747. [DOI] [PMC free article] [PubMed] [Google Scholar]
- Knutson KL, Van Cauter E, Zee P, Liu K, Lauderdale DS. Cross-sectional associations between measures of sleep and markers of glucose metabolism among subjects with and without diabetes: the Coronary Artery Risk Development in Young Adults (CARDIA) Sleep Study. Diabetes Care. 2011;34:1171–1176. doi: 10.2337/dc10-1962. [DOI] [PMC free article] [PubMed] [Google Scholar]
- Liu Y, Croft JB, Wheaton AG, Perry GS, Chapman DP, Strine TW, McKnight-Eily LR, Presley-Cantrell L. Association between perceived insufficient sleep, frequent mental distress, obesity and chronic diseases among US adults, 2009 behavioral risk factor surveillance system. BMC Public Health. 2013;13:84. doi: 10.1186/1471-2458-13-84. [DOI] [PMC free article] [PubMed] [Google Scholar]
- Mallon L, Broman JE, Hetta J. High incidence of diabetes in men with sleep complaints or short sleep duration: a 12-year follow-up study of a middle-aged population. Diabetes Care. 2005;28:2762–2767. doi: 10.2337/diacare.28.11.2762. [DOI] [PubMed] [Google Scholar]
- Markwald RR, Melanson EL, Smith MR, Higgins J, Perreault L, Eckel RH, Wright KP., Jr Impact of insufficient sleep on total daily energy expenditure, food intake, and weight gain. Proc Natl Acad Sci USA. 2013;110:5695–5700. doi: 10.1073/pnas.1216951110. [DOI] [PMC free article] [PubMed] [Google Scholar]
- Morrow JD, Opp MR. Sleep-wake behavior and responses of interleukin-6-deficient mice to sleep deprivation. Brain Behav Immun. 2005;19:28–39. doi: 10.1016/j.bbi.2004.02.003. [DOI] [PubMed] [Google Scholar]
- Olivadoti MD, Opp MR. Effects of i.c.v administration of interleukin-1 on sleep and body temperature of interleukin-6-deficient mice. Neuroscience. 2008;153:338–348. doi: 10.1016/j.neuroscience.2008.02.008. [DOI] [PMC free article] [PubMed] [Google Scholar]
- Olivadoti MD, Weinberg JB, Toth LA, Opp MR. Sleep and fatigue in mice infected with murine gammaherpesvirus 68. Brain Behav Immun. 2011;25:696–705. doi: 10.1016/j.bbi.2011.01.010. [DOI] [PMC free article] [PubMed] [Google Scholar]
- Poitout V, Robertson RP. Glucolipotoxicity: fuel excess and beta-cell dysfunction. Endocr Rev. 2008;29:351–366. doi: 10.1210/er.2007-0023. [DOI] [PMC free article] [PubMed] [Google Scholar]
- Reutrakul S, Van Cauter E. Interactions between sleep, circadian function, and glucose metabolism: implications for risk and severity of diabetes. Ann NY Acad Sci. 2014;1311:151–173. doi: 10.1111/nyas.12355. [DOI] [PubMed] [Google Scholar]
- Ringgold KM, Barf RP, George A, Sutton BC, Opp MR. Prolonged sleep fragmentation of mice exacerbates febrile responses to lipopolysaccharide. J Neurosci Methods. 2013;219:104–112. doi: 10.1016/j.jneumeth.2013.07.008. [DOI] [PMC free article] [PubMed] [Google Scholar]
- Sawamoto R, Nozaki T, Furukawa T, Tanahashi T, Morita C, Hata T, Komaki G, Sudo N. Higher sleep fragmentation predicts a lower magnitude of weight loss in overweight and obese women participating in a weight-loss intervention. Nutr Diabetes. 2014;4:e144. doi: 10.1038/nutd.2014.41. [DOI] [PMC free article] [PubMed] [Google Scholar]
- Shechter A, O'Keeffe M, Roberts AL, Zammit GK, RoyChoudhury A, St-Onge MP. Alterations in sleep architecture in response to experimental sleep curtailment are associated with signs of positive energy balance. Am J Physiol Regul Integr Comp Physiol. 2012;303:R883–R889. doi: 10.1152/ajpregu.00222.2012. [DOI] [PMC free article] [PubMed] [Google Scholar]
- Spiegel K, Leproult R, Van Cauter E. Impact of sleep debt on metabolic and endocrine function. Lancet. 1999;354:1435–1439. doi: 10.1016/S0140-6736(99)01376-8. [DOI] [PubMed] [Google Scholar]
- Spiegel K, Tasali E, Penev P, Van Cauter E. Brief communication: Sleep curtailment in healthy young men is associated with decreased leptin levels, elevated ghrelin levels, and increased hunger and appetite. Ann Intern Med. 2004;141:846–850. doi: 10.7326/0003-4819-141-11-200412070-00008. [DOI] [PubMed] [Google Scholar]
- St-Onge MP, O'Keeffe M, Roberts AL, RoyChoudhury A, Laferrere B. Short sleep duration, glucose dysregulation and hormonal regulation of appetite in men and women. Sleep. 2012a;35:1503–1510. doi: 10.5665/sleep.2198. [DOI] [PMC free article] [PubMed] [Google Scholar]
- St-Onge MP, McReynolds A, Trivedi ZB, Roberts AL, Sy M, Hirsch J. Sleep restriction leads to increased activation of brain regions sensitive to food stimuli. Am J Clin Nutr. 2012b;95:818–824. doi: 10.3945/ajcn.111.027383. [DOI] [PMC free article] [PubMed] [Google Scholar]
- Stamatakis KA, Punjabi NM. Effects of sleep fragmentation on glucose metabolism in normal subjects. Chest. 2010;137:95–101. doi: 10.1378/chest.09-0791. [DOI] [PMC free article] [PubMed] [Google Scholar]
- Sutton BC, Opp MR. Sleep fragmentation exacerbates mechanical hypersensitivity and alters subsequent sleep-wake behavior in a mouse model of musculoskeletal sensitization. Sleep. 2014;37:515–524. doi: 10.5665/sleep.3488. [DOI] [PMC free article] [PubMed] [Google Scholar]
- Svanborg E, Guilleminault C. EEG frequency changes during sleep apneas. Sleep. 1996;19:248–254. [PubMed] [Google Scholar]
- Tasali E, Leproult R, Ehrmann DA, Van Cauter E. Slow-wave sleep and the risk of type 2 diabetes in humans. Proc Natl Acad Sci USA. 2008;105:1044–1049. doi: 10.1073/pnas.0706446105. [DOI] [PMC free article] [PubMed] [Google Scholar]
- Trammell RA, Verhulst S, Toth LA. Effects of sleep fragmentation on sleep and markers of inflammation in mice. Comp Med. 2014;64:13–24. [PMC free article] [PubMed] [Google Scholar]
- Trento M, Broglio F, Riganti F, Basile M, Borgo E, Kucich C, Passera P, Tibaldi P, Tomelini M, Cavallo F, Ghigo E, Porta M. Sleep abnormalities in type 2 diabetes may be associated with glycemic control. Acta Diabetol. 2008;45:225–229. doi: 10.1007/s00592-008-0047-6. [DOI] [PubMed] [Google Scholar]
- von Ruesten A, Weikert C, Fietze I, Boeing H. Association of sleep duration with chronic diseases in the European Prospective Investigation into Cancer and Nutrition (EPIC)Potsdam study. PLoS One. 2012;7:e30972. doi: 10.1371/journal.pone.0030972. [DOI] [PMC free article] [PubMed] [Google Scholar]
- Zhang SX, Khalyfa A, Wang Y, Carreras A, Hakim F, Neel BA, Brady MJ, Qiao Z, Hirotsu C, Gozal D. Sleep fragmentation promotes NADPH oxidase 2-mediated adipose tissue inflammation leading to insulin resistance in mice. Int J Obes (Lond) 2014;38:619–624. doi: 10.1038/ijo.2013.139. [DOI] [PMC free article] [PubMed] [Google Scholar]
- Zorick F, Roehrs T, Wittig R, Lamphere J, Sicklesteel J, Roth T. Sleep-wake abnormalities in narcolepsy. Sleep. 1986;9:189–193. doi: 10.1093/sleep/9.1.189. [DOI] [PubMed] [Google Scholar]