

Abstract
Blood and urine acylcarnitine profiles are commonly used to diagnose long-chain fatty acid oxidation disorders (FAOD: i.e., long-chain hydroxy-acyl-CoA dehydrogenase [LCHAD] and carnitine palmitoyltransferase 2 [CPT2] deficiency), but the global metabolic impact of long-chain FAOD has not been reported. We utilized untargeted metabolomics to characterize plasma metabolites in 12 overnight-fasted individuals with FAOD (10 LCHAD, 2 CPT2) and 11 healthy age-, sex-, and body mass index (BMI)-matched controls, with the caveat that individuals with FAOD consume a low-fat diet supplemented with medium-chain triglycerides (MCT) while matched controls consume a typical American diet. 832 metabolites were identified in plasma, and partial least squared-discriminant analysis (PLS-DA) identified 114 non-acylcarnitine variables that discriminated FAOD subjects and controls. FAOD individuals had significantly higher triglycerides and lower specific phosphatidylethanolamines, ceramides and sphingomyelins. Differences in phosphatidylcholines were also found but the directionality differed by species. Further, there were few differences in non-lipid metabolites indicating the metabolic impact of FAOD specifically on lipid pathways. This analysis provides evidence that LCHAD/CPT2 deficiency significantly alters complex lipid pathway flux. This metabolic signature may provide powerful clinical tools capable of confirming or diagnosing FAOD, even in subjects with a mild phenotype, and provide clues regarding the biochemical and metabolic impact of FAOD that could be relevant to the etiology of FAOD symptoms.
Introduction
Mitochondrial fatty acid oxidation disorders (FAOD) are a family of inherited autosomal recessive disorders [1] whose patients suffer from a metabolic defect in fatty acid catabolism, with an estimated incidence of one in every 5,000–10,000 births [2]. Diagnosis is made through tandem mass spectrometry profiling of blood or urine lipid metabolites, acylcarnitines, since unique patterns of acylcarnitines track acyl-CoA metabolite pools upstream and downstream of specific enzymatic lesions [3]. The inability to efficiently or completely combust fatty acids leads to a number of symptoms and complications affecting multiple tissue systems with a wide range of severity [4]. Symptoms can include fatigue, muscle weakness, hypoketotic hypoglycemia, hepatic steatosis, cardiomyopathy, peripheral neuropathy, rhabdomyolysis and, if not recognized and treated, sudden unexpected death [4]. For FAODs involving enzymes that participate in the catabolism of long-chain fatty acids (LCFAs), treatment can include decreased consumption of fats containing LCFAs, increased intake of medium-chain triglycerides (MCT) that provide fatty acid fuel downstream of the enzyme lesions, carnitine supplementation to maintain carnitine status in light of higher tissue acylcarnitine generation and loss, and avoidance of fasting or strenuous exercise that can trigger lipolysis and thus increase tissue LCFA load [5, 6].
Examples of FAODs affecting LCFA β-oxidation at its earliest stages include the long-chain 3-hydroxyacyl-CoA dehydrogenase (LCHAD), a of the mitochondrial trifunctional protein (TFP) complex required for β-oxidation of LCFA with chain length >12, and carnitine palmitoyltransferase 2 (CPT2). Once LCFA are transported into the mitochondrion as a LCFA-carnitine, CPT2 exchanges the carnitine moiety for a CoA molecule, providing the LCFA-CoA substrate for subsequent β-oxidation. Dysfunction of either of these proteins leads to increases in tissue, plasma and urine long-chain acylcarnitine derivatives of saturated, unsaturated, and hydroxy-LCFA-CoA metabolites [7].
While plasma acylcarnitine profiles have been well-characterized as diagnostic for specific FAODs, little is known regarding the broad-scale impact of human long-chain FAOD on the fates of other metabolite and lipid classes, especially in the asymptomatic condition. In the case of LCHAD or CPT2 deficiency, such an effort could reveal how attenuation of mitochondrial LCFA oxidative catabolism impacts intermediary metabolism of other fuels and LCFA trafficking in cells and tissues. To address these outstanding questions, we analyzed the fasting plasma lipidome and metabolome of 12 individuals with FAOD (10 LCHAD and 2 CPT2) and 11 healthy control age-, sex-, and body mass index (BMI)-matched subjects. Using both univariate and multivariate statistical methods, novel lipid and metabolic signatures were identified that readily differentiate asymptomatic individuals with FAOD compared to age-, sex- and BMI-matched controls.
Results
Participant Characteristics
Twenty-three participants were included in the final study analysis, including 11 control and 12 FAOD (10 LCHAD, 2 CPT2) (Table S3) subjects. We preserved our small sample size by assessing LCHAD and CPT2 subjects together and focusing our investigation on identifying metabolites that can distinguish overnight-fasted asymptomatic long-chain FAOD subjects relative to healthy age-, sex- and BMI-matched controls. Furthermore, although it is well-known that patients with LCHAD and CPT2 defects display disparate acylcarnitine profiles (i.e., patients with LHCAD deficiency have elevations in long-chain hydroxylated acylcarnitines not observed in patients with CPT2), the global changes in the metabolome have not been assessed for the family of long-chain FAODs. As previously described for the LCHAD subjects [8], there were no significant differences in age or body mass index (BMI) between controls and long-chain FAOD subjects; however, there were modest differences in total and high-density lipoproteins cholesterol (Table 1).
Table 1.
LCHAD and CPT2 in Table
Subject and biochemical characteristics samples derived from 10 h fasted long-chain FAOD and healthy control subjects.
| Parameters | LCHAD | n | CPT2 | n | Control | n |
|---|---|---|---|---|---|---|
| Age, years | 12.3 (1.3) | 10 | 26.5 (10.5) | 2 | 15.7 (2.3) | 11 |
| Weight, kg | 55.9 (5.2) | 10 | 73.4 (12.4) | 2 | 61 (6.4) | 11 |
| BMI_kg/m2 | 22.8 (1.3) | 10 | 26.3 (3.6) | 2 | 23.1 (1.4) | 11 |
| BMI, Z-score | 1.1 (0.2) | 10 | 0.5 (NA) | 1 | 0.7 (0.3) | 9 |
| BMI, percentile | 84.6 (4.5) | 10 | 70 (NA) | 1 | 72.3 (6.7) | 9 |
| Triglycerides, mg/dL | 74.9 (6.7) | 7 | 85.5 (5.5) | 2 | 68.9 (10.6) | 10 |
| Total cholesterol, mg/dL | 143.4 (6) | 7 | 134 (12) | 2 | 167.4 (9.7)* | 10 |
| LDL cholesterol, mg/dL | 92.3 (6.5) | 7 | 79.5 (15.5) | 2 | 95.8 (8.5) | 10 |
| HDL cholesterol, mg/dL | 36.3 (0.7) | 7 | 37.5 (2.5) | 2 | 57.8 (5.4)* | 10 |
| Fasting glucose, mg/dL | 96.9 (4.1) | 10 | 103 (16) | 2 | 100.9 (3.8) | 11 |
| Fasting insulin, uU/mL | 17.4 (3.1) | 10 | 18.7 (3.4) | 2 | 14.8 (1.6) | 11 |
| HOMA-IR | 4.1 (0.7) | 10 | 4.9 (1.6) | 2 | 3.7 (0.4) | 11 |
| Subcutaneous adipose tissue, cm2 | 20.4 (3.1) | 9 | 43.5 (NA) | 1 | 23.3 (4) | 9 |
| Visceral adipose tissue, cm2 | 2.9 (0.4) | 9 | 8.5 (NA) | 1 | 4.4 (0.9) | 9 |
Data are mean (SEM). Control values denoted with an ‘*’ are statistically different (independent t-test). Statistical significance was set at P < 0.05)
Metabolomics Results
A total of 822 metabolites were detected by metabolomics assessment of complex lipids and primary metabolism and used in statistical analyses (Table S1): 481 complex lipids were detected in the untargeted lipidomics platform and 341 small molecules in the untargeted metabolomics analysis of primary metabolism. Of all of the metabolites detected between both platforms, 349 metabolites were structurally identified and annotated. The remaining as-yet non-annotated metabolites are identified by either a BinBase (BB) number [9] or similar LipidBlast identifying number [10] and were included in all statistical analyses. Univariate assessment of all metabolites revealed 167 metabolites that statistically differed between FAOD and control subjects; after correction for multiple comparisons, only 74 metabolites remained statistically significant (Table S1). The vast majority of metabolites differing between FAOD and control subjects were of lipid origin (Table S1). In fact, only 5 unknown metabolites were statistically different after correction for multiple comparisons (BB223548, BB223521, BB223597, BB943961, and BB223675).
Multivariate statistical analysis of plasma metabolites discriminate individuals with FAOD from controls
Our goal in this study is to identify novel markers of FAOD, independent of acylcarnitines, using two analytical metabolomics platforms. We first modeled results from the metabolomics assessment of primary metabolism and found only 10 metabolites (γ-tocopherol, malic acid, BB223597, BB223548, BB223521, BB267805, BB223675, BB944107, and BB214533) that accurately discriminated FAOD subjects from matched controls (Model 1), illustrated by a subjects scores plot showing separation of the groups (Figure 1A). The small number of metabolites included in Model 1 mirrored the results in the univariate analysis where very few non-lipid metabolites were found to be significantly different between FAOD and control subjects. Interestingly, γ-tocopherol and malic acid were found to be significant before adjustment for multiple comparisons in univariate analyses (Table S1).
Figure 1. Results from partial least squares-discriminant analysis (PLS-DA) scores plot displaying discrimination between control and fatty acid oxidation disorder (FAOD) subjects due to differences in plasma metabolite patterns after a 10 h fast.
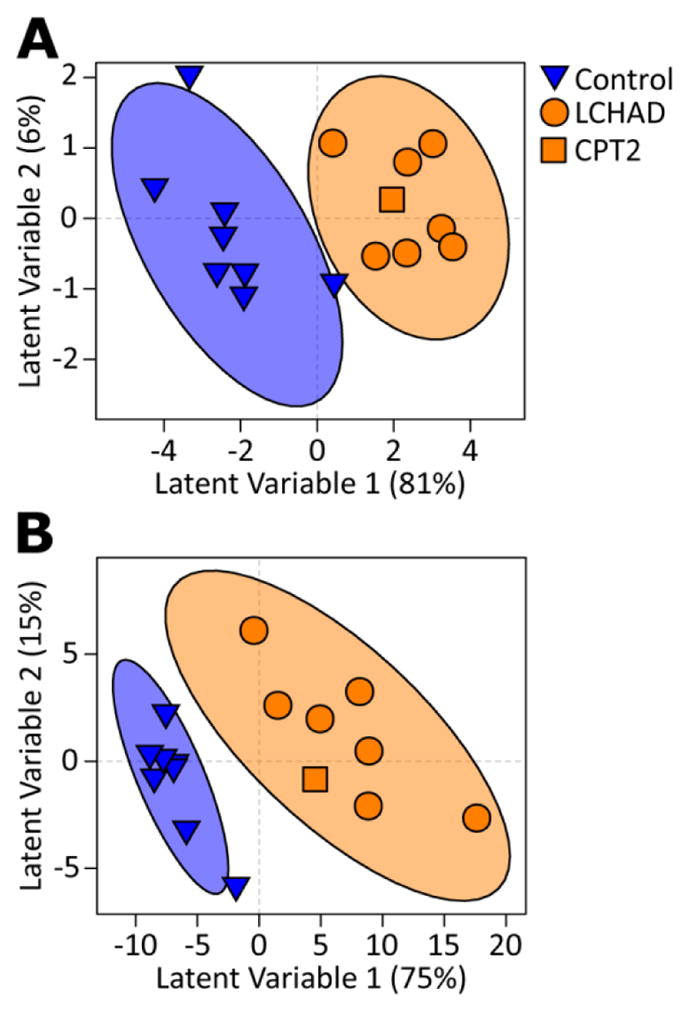
Subjects scores plot allowing visualization of individual subjects’ clustering due to differential metabolite-based PLS-DA scores; Illustrated are the healthy control (blue-triangles, n=8) and FAOD (orange circles and square, n=9) cohorts. PLS-DA analysis was developed with training samples; therefore, subjects in the test set (3 from each group) are not included in the current analysis and figure. Each triangle/circle/square represents an individual subject. Ellipses surrounding each cluster are 95% confidence ellipses based on Hotelling’s T2 statistic. Each plot represents a different statistical model, i.e., only including untargeted metabolomics assessment of primary metabolism (A, Model 1) and untargeted metabolomics of complex lipids (B, Model 2).
We then modeled results from the metabolomics assessment of complex lipids (Model 2). Projection of subjects in the PLS-DA scores plot illustrates that metabolites selected in Model 2 successfully discriminated controls from individuals with FAOD (Figure 1B). Contrary to the small number of metabolites identified in Model 1, 117 variables were featured in Model 2 (Table S2). Model 2 featured multiple complex lipids derived from triglycerides, phosphatidylcholines, sphingomyelins, ceramides, unknowns, and a single representative glycerophospholipid and phosphatidylethanolamine (PE36:3ox).
We further filtered features obtained from multivariate analyses, based on univariate results adjusted for multiple comparisons, thus identifying only the most robust discriminating variables. A total of 36 annotated metabolites in 6 distinct classes met these criteria (Figure 2), all derived from the lipidomics platform. An additional 36 unknown metabolites also met these criteria (Figure 2). Examining the FAOD fold changes in these metabolites revealed a FAOD-associated increase in 7 TG species, 2 PC metabolites, and 12 non-annotated metabolites indicated by orange shading in Figure 2. All TG species but TG14:0/14:0/14:0 had total carbon lengths between 44 and 58, and a wide range of double bonds (1 – 9). Both PC species increased in FAOD were 40 carbons long with 5 double bonds. All other metabolites were decreased in FAOD subjects relative to controls. These included the remaining PCs and unknown lipids, ceramides, a PE, a glycerophospholipid, and all of the unknown metabolites as indicated by blue shading (Figure 2). These results strongly support the notion that FAOD involving LCFA enzymes can affect complex lipid metabolism.
Figure 2. Comparison of individuals with FAOD relative to controls in discriminant metabolites.

Metabolites were featured in heatmap if selected in multivariate models and also significantly different between FAOD and control subjects after adjusting for multiple comparisons (Benjamini and Hochberg). Heatmap represents data from all individuals with FAOD (i.e., no training/test set split) and is separated by metabolite classes. Colors depict changes relative to the mean of control subjects’ concentrations for each metabolite. CPT2, carnitine palmitoyltransferase 2 deficiency; LCHAD, long-chain hydroxyl-acyl-CoA dehydrogenase deficiency.
Correlation of long-chain acylcarnitines and other lipid species
We then asked the question, “How do non-acylcarnitine markers of FAOD disorders associate with more traditionally-used acylcarnitine clinical markers?” Correlations among plasma long-chain acylcarnitines that were significantly different between FAOD and controls (Table S4), and annotated lipid species identified in univariate and multivariate statistical analyses were determined (Figure 3). FAOD and control subjects were analyzed separately to determine if metabolite correlation patterns are altered by FAOD status, and this revealed differences. First, 10 lipids correlated with acylcarnitines (ACs) in the individuals with FAOD, in contrast to 18 in the controls. Second, FAOD subjects displayed negative associations among several acylcarnitines and 3 TGs (TG46:2, TG42:0, and TG44:1), while 3 other TGs (TG52:6, TG52:6.1, and TG46:3) mainly lost their negative association with acylcarnitines, or, in the case of TG52:6, reversed its negative association in FAOD compared to associations in controls. Third, a small sub-set of associations were shared by both controls and individuals with FAOD, including (correlation directionality in parentheses): C12:1-OH-AC and PC35_3 (negative); C12-OH-AC and PC40:5B (positive); C18:1-AC and TG44:1 (negative); C14-AC, C18:1-AC and TG46:2 (negative); C18:1-AC, C18:2-AC and TG14:0/14:0/14:0 (negative). Finally, there was one correlation that differed in direction comparing controls to FAOD: C16-OH-AC was positively correlated with TG52:6 in individuals with FAOD, but this relationship was negative in controls. In controls, there was also a consistent negative correlation of PE36:3Ox with acylcarnitines >C12. Interestingly, the triglycerides overwhelmingly had negative correlations with many acylcarnitines in the control subjects.
Figure 3. Correlation among plasma acylcarnitines (≥C12) and metabolites discriminating FAOD relative to control subjects.

Acylcarnitine species with ≥12 carbons that were significantly different between FAOD and control subjects (Table S1) were correlated with metabolites selected in multivariate models and also significantly different between FAOD and control subjects after adjusting for multiple comparisons (Benjamini and Hochberg). Significant correlations are represented with ellipses. Directionality of ellipses represents either a positive or negative correlation, respectively. Thinner ellipses represent higher strength of correlation.
Discussion
Elevated plasma and blood spot acylcarnitines are a hallmark of FAOD [7, 8], but comprehensive assessments of other metabolites is rarely considered. Thorough examination of metabolomics patterns may yield additional FAOD diagnostic markers and provide further insight into disease pathology. Thus, we leveraged metabolomics technologies to compare plasma from a cohort of overnight-fasted asymptomatic long-chain FAOD subjects relative to age-, sex- and BMI-matched control subjects [8]. While it was anticipated that defects in mitochondrial long-chain fatty acid combustion would impact lipid homeostasis, it is not known which lipid classes are impacted and whether non-lipid pathways are concomitantly distressed. The data from the current study support the idea that LCFA partitioning into complex lipids in FAOD is dramatically altered, with much more limited effects seen on plasma non-lipid metabolites.
To our knowledge, the current study represents the first metabolomics evaluation of an inborn error of long chain fatty acid oxidation metabolism. A recent manuscript by Najdekr et al. showed elevated oxidized phosphatidylcholines in patients with medium-chain acyl-CoA dehydrogenase deficiency [11], a result not seen in this study. Nevertheless, our findings and those of Najdekr et al indicate that compromised mitochondrial fatty acid oxidation clearly impacts complex lipid homeostasis.
A number of distinct lipid classes were altered during the fasting FAOD condition, which we hypothesize is due to differential flux of fatty acids through complex lipid pathways. Specifically, a number of triglyceride (TG) species were significantly elevated in fasting FAOD plasma compared to controls. Previously, plasma clinical measurements identified only a modest difference in total TG between groups (Table 1); however, we can conclude from our metabolomics data that increases occur in TG containing fatty acid chains with a sum of 44 carbons or more (e.g. TG46:3, Figure 2), which would be expected given the specific genetic blockades in enzymes associated with LCFA metabolism in these subjects. It remains to be determined which lipoprotein class or classes drive the plasma TG phenotype in FAOD.
Individuals with long-chain FAOD also showed a significant reduction in many specific sphingomyelins (SMs); critical sphingolipids produced from de novo synthesis of ceramide (Cer) in the endoplasmic reticulum [12]. Considering the close relationship between SM and Cer biochemistry, it is perhaps not surprising that both types of metabolites were concurrently decreased in FAOD. Therefore, it seems plausible that there could be an FAOD-associated alteration in enzymology affecting either Cer production or degradation. Importantly, the SM and Cer are being measured in the plasma lipid fraction which almost certainly stems from lipoproteins [13] and it remains possible that Cer and SM are sequestered in membranes in the FAOD condition and are not reaching the plasma as components of lipoproteins. Although subjects were tested in the overnight-fasted state, an important consideration is that there were dietary differences between controls and FAOD subjects (i.e., high carbohydrate, low fat diet in FAOD); this might have impacted lipoprotein dynamics and hence contributed to differences in blood complex lipid profiles.
There were also significant changes in metabolites from another membrane lipid class, phosphatidylcholines (PC), that contain two fatty acid chains esterified to glycerol and a phosphodiester linkage to choline [14]. PCs are one of the most abundant lipid classes in cell membranes [15] and comprise between 60–80% of lipoprotein shells [14]. Interestingly, different classes of PC had opposing directionality in plasma concentrations in FAOD subjects. PC species with 33–36 carbons (two acyl chains whose carbons added together equal 33–36, i.e. PC33=C16+C17) were decreased or unchanged, and two with 40 carbons were increased in the FAOD plasma. These differences in odd long-chain fatty acids (i.e. C17) could be due to likely greater intake of dairy fat in the control subjects [16] or differences in gut microbial metabolism [17]. The totality of these findings again point to the potential impact of FAOD on lipid enzymology and fatty acid partitioning.
One hypothesis regarding FAOD-associated increase in PC40 metabolites and several species of TGs, suggests a reflection of enhanced LCFA elongation, somehow channeled toward incorporation into PCs and TGs. In contrast, SM40 and Cer40 metabolite concentrations were generally reduced, further suggestive of a preferential incorporation of products of LCFA elongation into PCs and TG. It is possible that only certain classes of fatty acids are more robustly utilized (via trafficking/channeling, differential enzymatic regulation, etc.) by the FAOD liver for incorporation into very low-density and HDL [18]. Future analysis into specific lipoprotein pools would prove fruitful in identifying such alterations in the FAOD condition.
We had anticipated much more broad shifts in intermediary metabolism of non-lipid pathways in individuals with FAOD [19], i.e., carbohydrates and amino acids. Changes in alanine have been noted in fed CPT2 patients vs. healthy controls post-exercise, although no differences were seen at rest [20]. Although only plasma, and not tissue, concentrations of alanine were lower in overnight fasted and post-absorptive murine LCAD knockout mice, Houten et al. postulated that systemic amino acid metabolism was altered due to a dysregulation in tissue alanine aminotransferase activity [19]. Further, cardiac glucose uptake was increased in cardiac tissue of VLCAD KO mice compared to wild-type animals [21]. Yet, our novel global metabolomics data support the idea that in well-controlled overnight fasted FAOD individuals, there is only a limited effect on non-lipid pathways. Notably, although our results for organic acids (citrate, isocitrate, aconitate and malate) involved in TCA function did not meet stringent statistical significance in an omics-based study, differential effects of FAOD on TCA metabolites have been previously observed in cardiac tissue of fasted LCAD knockout mice [22]. A form of vitamin E that is found predominantly in seeds, γ-tocopherol, was also reduced in the individuals with FAOD but did not achieve statistical significance in this study. The FAOD-associated reduction is likely due to low dietary intake.
These data have been assessed with a few limitations that may impact interpretation. FAOD subjects were fed a low-fat diet compared to controls and had been taking MCTs prior to study participation, which may have an impact on plasma lipids. We obtained plasma samples after a 10 h overnight fast in order to minimize post-prandial difference in the diet; however, this period of fasting may not completely remove the effect of diet. Interestingly, Tucci et al. observed elevated cardiac concentrations of ketone bodies in post-prandial VLCAD KO and wild-type mice fed 12% of total energy from MCT [21]. They did not measure plasma concentrations of ketone bodies, but it would suggest that post-prandial production of ketone bodies would have been substantially increased following MCT feeding. In contrast, we found no differences in plasma 3-hydroxybutanoic acid between post-absorptive FAOD subjects and controls, even though FAOD subjects consumed supplemental MCT at 9–12% of total energy intake. This would suggest that plasma concentrations of ketone bodies normalize after an overnight fast, and, perhaps tissue concentrations could serve as a more sensitive marker of MCT consumption. Regardless, it is likely that a combination of genetic and nutritional factors are driving nutrient partitioning in patients with long-chain FAOD, but future studies controlling for dietary intake will be required to de-convolute genetic-specific differences.
In summary, we have for the first time applied metabolomics tools to determine broad metabolic shifts that accompany long-chain FAOD (LCHAD or CPT2 deficiency). The results clearly indicate that limited mitochondrial LCFA oxidation triggers selective re-partitioning of LCFA into specific complex lipids, especially TGs and PCs, in liver and possibly other tissues, with a reduced partitioning toward the SM/Cer pathways. The specific mechanisms by which this takes place remain unknown, but may involve altered metabolite channeling or enzyme activities associated with complex lipid flux (i.e., in pathways associated with ceramide and sphingolipid metabolism). Prospective studies that control for the potential confounder of diet and that assess enzyme flux should help better define the origins of FAOD-associated metabolite patterns. It remains to be seen if under more challenged conditions in which lipolysis is triggered (i.e., illness, heavy exercise, poor nutritional control or prolonged fasting), metabolomics patterns would be even more dramatically altered in FAOD, with the possibility of local long-chain acylcarnitines impacting membrane-associated enzyme systems leading to changes in blood SM, Cer, PC and TG signatures [23]. The specific metabolites altered in FAOD, described herein, might enable development of new diagnostic tools (complementary to traditional acylcarnitine profiling) with the potential to identify disease risk, FAOD sub-types or severity.
Methods
Subjects
Detailed information regarding the study and subject recruitment has been published previously [8]. Briefly, age-, sex-, and BMI-matched FAOD and control subjects were recruited to Oregon Health & Science University (OHSU) for a study approved by the OHSU Institutional Review Board (IRB no. 817). There were 11 subjects (6 male, 5 female) in the control group and 12 subjects in the FAOD (7 male, 5 female) with average ages of 15.7 and 14.7 years, respectively. FAOD was confirmed via medical record reviews and diagnostic evidence, except for one subject who did not present clinically with metabolic disease by traditional measures, but was diagnosed via genotype following diagnosis of a sibling’s disease. All subjects were admitted to the OHSU Clinical and Translational Research Center for completion of the study procedures. FAOD subjects were all following a low-fat diet upon admission for 1.5 days prior to fast (10–20% total energy from long-chain triglycerides – LCT, 9–13% medium-chain triglycerides (MCT), 56–76% carbohydrate, 8–15% protein); 11 subjects regularly consumed oil supplements containing MCT (9–12% of total energy from MCT), 10 subjects were on prescribed carnitine supplementation (0.9 to 4 grams per day) and no subjects were consuming triheptanoin. The control subjects were consuming their regular diet (approximately 31% total energy from lipids, 10% from protein and 59% from carbohydrates). The participants were subjected to a 10 h overnight fast after which plasma was collected in EDTA, frozen at −80°C, and subjected to one to two freeze-thaw cycles prior to metabolomics and lipidomics analysis. Blood samples were stored in a study-specific data repository and released with prior subject consent for this analysis (OHSU IRB 817).
Plasma metabolomics and lipidomics analyses
Plasma acylcarnitines were determined by electrospray tandem mass spectrometry at the Mayo Clinic Biochemical Genetics Laboratory as described previously [8, 24]. An exemption for a full board review was obtained from the UC Davis IRB (625805–1) for the plasma metabolomics analysis portion of the study, as de-identified samples were used. Plasma samples were thawed on ice, aliquoted and submitted to the West Coast Metabolomics Center at the University of California Davis for an untargeted metabolomics analysis. Briefly, plasma samples (15 μL) were extracted using 1 mL of degassed acetonitrile:isopropanol: water (3:3:2; v/v/v) at −20°C, centrifuged, decanted, and dried. Membrane lipids and triglycerides were removed by adding 500 μL of acetonitrile/water (1:1; v/v), followed by evaporation to dryness. Internal standards were added (13 C8–C30 fatty acid methyl esters) and samples were derivatized by 10 μL methoxyamine hydrochloride in pyridine followed by 90 μL MSTFA for trimethylsilylation of acidic protons. Samples were injected into an Agilent 6890 gas chromatograph and separated using a 30 m long, 0.25 mm i.d. Rtx5Sil-MS column at a constant flow of 1 mL/min while ramping the oven temperature from 50°C to 330°C with 22 min total run time. Mass spectrometry was conducted on a Leco Pegasus IV time of flight mass spectrometer with a 280°C transfer line temperature, electron ionization at −70eV and an ion source temperature of 250C. Mass spectrometer operated between m/z 85–500 at 17 spectra s−1. The resulting data were annotated using the BinBase method using an automated database at the West Coast Metabolomics Center [9]. The BinBase database matches the sample mass spectrum information and retention index against the Fiehn lab mass spectral library of over 1,200 authentic standards spectra and NIST05 commercial library. Metabolites were reported if they met the following criteria: they must be present in greater than 25% of all of the samples and true peak detection must have occurred in at least 50% of a given condition (i.e. FAOD or control) [25]. Reliably measured peaks found in some samples, but not of the quality matching others, were replaced by searching the raw data for the highest signal with 2 s of the target retention time minus the lowest signal within 5 seconds of the target retention time. Individual metabolites were normalized by the sum of identified metabolite quantifier ion peak heights (QIPH) present in each sample. These relative abundances were used for all subsequent statistical analyses. In depth details of the protocol can be found elsewhere [26].
Plasma lipidomics were also analyzed at the West Coast Metabolomics Center by charged-surface hybrid column-electrospray ionization quadrupole time of flight tandem mass spectrometry (CSH-ESI QTOF MS/MS) in both positive and negative modes using methods described previously [27]. Samples were extracted using the Matyash protocol using methyl tert-butyl ether (MTBE) [28]. Briefly, 20 μL of plasma was mixed with 225 μL of ice cold degassed MeOH and vortexed for 10 s, 750 μL of ice-cold degassed MTBE was then added followed by 10s vortex and shaking (6m at 4°C). MilliQ water was added (188 μL) followed by vortexing (20 s) and centrifugation (2min; 14,000g). The resulting upper phase is then transferred (350 μL) to separate tube, dried, and reconstituted with 65 μL MeOH:toluene + CUDA (9:1, v/v). Aliquots of 30 μL were transferred to two separate vials with micro-inserts for UHPLC-QTOF-MS analysis. Samples (3 μL) were injected at 65°C and separated using a Waters Acquity UPLC CSH C18 column (100 mm × 2.1 mm) with a particle size of 1.9 μm and a flow rate of 0.6 mL/min. Mass spectrometry was conducted for positively charged ions (PC, lysoPC, PE, and PS) with an Agilent 6530 QTOF MS (resolution: 10,000) and for negatively charged ions (free fatty acids and phosphatidylinositols) with an Agilent 6550 QTOF MS (resolution: 20,000). Both mass spectrometers operated at full scan range m/z 65–1700. Peak identification was processed in MassHunter Qual (Agilent) using the MS/MS information and Fiehn laboratory LipidBlast spectral library [10] and then imported to MassProfilerProfessional for peak alignment. Results are provided as quantifier ion peak heights and normalized to the sum of all peak heights for all identified metabolites for each sample. In-depth details of the protocol can be found through the Metabolomics Workbench under protocol number 163 (http://www.metabolomicsworkbench.org/protocols/protocoldetails.php?file_id=163).
Statistical analyses
All statistical analyses were performed in R version 3.0.2 [29]. Group differences among clinical characteristics were assessed previously [8]. Clinically-relevant acylcarnitines were assessed for normality using Anderson-Darling tests. Acylcarnitines that were not normally distributed were log transformed and again assessed for normality using Anderson-Darling tests. If normality was still not achieved after log transformation, then non-parametric tests were used on un-transformed data. Group differences in acylcarnitine data were assessed with independent t-tests for normally distributed data (including log-transformed data) and Mann Whitney U tests for non-normally distributed data. Metabolomic and lipidomic data were assessed for group differences by Mann Whitney U tests. P-values from group comparisons were corrected for false discovery rate [30] at Q = 0.05. Associations among acylcarnitines and lipidomics/metabolomics data were assessed with Spearman’s correlations. All statistical tests were significant at α = 0.05.
Data used in multivariate analyses were first assessed for univariate outliers with Grubbs’ test for outliers at α = 0.01. Outliers were removed from analysis and all missing data (including removed outliers) were imputed via Indirect Least Squares [31, 32]. Outlier assessment and removal effected < 0.4% of the data from the lipidomics data and < 0.6% of the untargeted metabolomics data. Data were log transformed, mean-centered, and scaled to unit variance before all multivariate analyses. Partial least squares-discriminant analysis (PLS-DA) was used to determine variables that discriminate individuals with FAOD from controls [33]. An external cross-validation scheme was used to determine PLS-DA model validity, where 2/3 of the subjects were randomly selected to develop the model (“training set”) and the remaining 1/3 was used to measure the predictive performance (“test set”). Feature selection was assessed with variable importance in projection (VIP) scores [34, 35] from bootstrapped PLS-DA models [36]. No data from the test set was utilized in model development or feature selection. An iterative backwards elimination strategy was utilized to determine final PLS-DA models. In short, variables with bootstrapped VIP scores ≥1 were ranked and PLS-DA models were iteratively fit with each successive model removing the highest ranked variable. Elimination of variables terminated when a PLS-DA model failed to predict at least 67% of test subjects within the first three latent variables. Remaining variables were considered non-important and the variables removed during the elimination strategy were chosen to fit the final PLS-DA from bootstrapped PLS-DA models.
Supplementary Material
Complete data set containing quant ion peak heights (QIPH) for untargeted plasma metabolomics and lipidomics from healthy control subjects (n=11) and individuals with FAOD diagnosed with LCHAD (n=10) or CPT2 (n=2).
Bootstrapped variable importance to projection (VIP) statistics from partial least squared-discriminant analyses of Model 1 and Model 2 from plasma of healthy control (n=11) and FAOD (n=12) individuals with FAOD.
Diagnostic and supplementation information for FAOD subjects
Plasma acylcarnitine analysis performed on 10 h fasted FAOD and healthy control subjects.
Synopsis.
We have leveraged metabolomics to assess plasma phenotypes in two distinct fatty acid oxidation disorders (LCHAD and CPT2) suggestive of altered lipid partitioning of long-chain fatty acids into specific complex lipids under conditions of impaired long-chain fatty acid catabolism.
Acknowledgments
The authors would like to thank Dr. Oliver Fiehn of the West Coast Metabolomics Center at UC Davis for his support of the metabolomics and lipidomics analysis. The West Coast Metabolomics Center is supported by NIH Grant U24 DK097154. Additionally, the authors would like to thank Dr. John Newman of the USDA Western Human Nutrition Research Center for his support in interpretation of the lipidomics analysis as well as Dr. Paul Coen of the Translational Research Institute for Metabolism and Diabetes for his insightful comments and review of this manuscript. The genesis of this project emerged from results from grants awarded by the NIH-NIDDK (R01DK078328 and R01DK078328-02S1, to S.H.A. and K01DK071869, to M.G.) and USDA-ARS intramural Project 5306-51530-019-00, and the studies supported by a UC Davis Clinical and Translational Science Center (CTSC) Pilot Award (to S.H.A., J.V., M.G.) funded by the NIH National Center for Advancing Translational Sciences, through grant number UL1TR000002. This project was also supported by a NIH T32 pre-doctoral training award (to C.S.M.), funded by the National Center for Advancing Translational Sciences, National Institutes of Health, through grant number UL1 TR000002 and linked award TL1 TR000133. J.V. was supported in part by R01-DK78755. The content is solely the responsibility of the authors and does not necessarily represent the official views of the NIH.
Footnotes
Conflict of Interest:
Colin S. McCoin, Brian D. Piccolo, Trina A. Knotts, Dietrich Matern, Jerry Vockley, Melanie B. Gillingham and Sean H. Adams declare that they have no conflict of interest.
Author Contributions:
CM, TA, JV, MG and SA were involved in the conception and design of this study. MG conducted the clinical study and sample collection. CM, BP, and SA were responsible for the primary analysis of metabolomics data; all authors were involved in the interpretation of the data as well as the drafting and/or revising of the manuscript.
Compliance with Ethics Guidelines:
Informed Consent:
All procedures followed were in accordance with the ethical standards of the responsible committee on human experimentation (institutional and national) and with the Helsinki Declaration of 1975, as revised in 2000. Written informed consent was obtained from all patients or legal guardians prior to inclusion in the study.
References
- 1.Wanders RJ, et al. Disorders of mitochondrial fatty acyl-CoA beta-oxidation. J Inherit Metab Dis. 1999;22(4):442–87. doi: 10.1023/a:1005504223140. [DOI] [PubMed] [Google Scholar]
- 2.Newborn screening: toward a uniform screening panel and system. Genet Med. 2006;8(Suppl 1):1s–252s. doi: 10.1097/01.gim.0000223891.82390.ad. [DOI] [PMC free article] [PubMed] [Google Scholar]
- 3.Wilcken B, et al. Screening Newborns for Inborn Errors of Metabolism by Tandem Mass Spectrometry. New England Journal of Medicine. 2003;348(23):2304–2312. doi: 10.1056/NEJMoa025225. [DOI] [PubMed] [Google Scholar]
- 4.Rinaldo P, Matern D, Bennett MJ. Fatty acid oxidation disorders. Annu Rev Physiol. 2002;64:477–502. doi: 10.1146/annurev.physiol.64.082201.154705. [DOI] [PubMed] [Google Scholar]
- 5.Bach AC, V, Babayan K. Medium-chain triglycerides: an update. The American Journal of Clinical Nutrition. 1982;36(5):950–62. doi: 10.1093/ajcn/36.5.950. [DOI] [PubMed] [Google Scholar]
- 6.Roe CR, et al. Treatment of cardiomyopathy and rhabdomyolysis in long-chain fat oxidation disorders using an anaplerotic odd-chain triglyceride. The Journal of Clinical Investigation. 2002;110(2):259–269. doi: 10.1172/JCI15311. [DOI] [PMC free article] [PubMed] [Google Scholar]
- 7.Rinaldo P, Cowan TM, Matern D. Acylcarnitine profile analysis. Genet Med. 2008;10(2):151–6. doi: 10.1097/GIM.0b013e3181614289. [DOI] [PubMed] [Google Scholar]
- 8.Gillingham MB, et al. Altered body composition and energy expenditure but normal glucose tolerance among humans with a long-chain fatty acid oxidation disorder. Am J Physiol Endocrinol Metab. 2013;305(10):E1299–308. doi: 10.1152/ajpendo.00225.2013. [DOI] [PMC free article] [PubMed] [Google Scholar]
- 9.Fiehn O, Wohlgemuth G, Scholz M. Setup and Annotation of Metabolomic Experiments by Integrating Biological and Mass Spectrometric Metadata. In: Ludäscher B, Raschid L, editors. Data Integration in the Life Sciences. Springer; Berlin Heidelberg: 2005. pp. 224–239. [Google Scholar]
- 10.Kind T, et al. LipidBlast in silico tandem mass spectrometry database for lipid identification. Nat Methods. 2013;10(8):755–8. doi: 10.1038/nmeth.2551. [DOI] [PMC free article] [PubMed] [Google Scholar]
- 11.Najdekr L, et al. Oxidized phosphatidylcholines suggest oxidative stress in patients with medium-chain acyl-CoA dehydrogenase deficiency. Talanta. 2015;139:62–6. doi: 10.1016/j.talanta.2015.02.041. [DOI] [PubMed] [Google Scholar]
- 12.Gault CR, Obeid LM, Hannun YA. An overview of sphingolipid metabolism: from synthesis to breakdown. Advances in experimental medicine and biology. 2010;688:1–23. doi: 10.1007/978-1-4419-6741-1_1. [DOI] [PMC free article] [PubMed] [Google Scholar]
- 13.Kontush A, Chapman MJ. Lipidomics as a tool for the study of lipoprotein metabolism. Curr Atheroscler Rep. 2010;12(3):194–201. doi: 10.1007/s11883-010-0100-0. [DOI] [PubMed] [Google Scholar]
- 14.Cole LK, Vance JE, Vance DE. Phosphatidylcholine biosynthesis and lipoprotein metabolism. Biochimica et Biophysica Acta (BBA) - Molecular and Cell Biology of Lipids. 2012;1821(5):754–761. doi: 10.1016/j.bbalip.2011.09.009. [DOI] [PubMed] [Google Scholar]
- 15.Domingues MRM, Reis A, Domingues P. Mass spectrometry analysis of oxidized phospholipids. Chemistry and Physics of Lipids. 2008;156(1–2):1–12. doi: 10.1016/j.chemphyslip.2008.07.003. [DOI] [PubMed] [Google Scholar]
- 16.Jenkins B, West JA, Koulman A. A review of odd-chain fatty acid metabolism and the role of pentadecanoic Acid (c15:0) and heptadecanoic Acid (c17:0) in health and disease. Molecules. 2015;20(2):2425–44. doi: 10.3390/molecules20022425. [DOI] [PMC free article] [PubMed] [Google Scholar]
- 17.Lahti L, et al. Associations between the human intestinal microbiota, Lactobacillus rhamnosus GG and serum lipids indicated by integrated analysis of high-throughput profiling data. PeerJ. 2013;1:e32. doi: 10.7717/peerj.32. [DOI] [PMC free article] [PubMed] [Google Scholar]
- 18.Jacobs RL, et al. Hepatic CTP:phosphocholine cytidylyltransferase-alpha is a critical predictor of plasma high density lipoprotein and very low density lipoprotein. J Biol Chem. 2008;283(4):2147–55. doi: 10.1074/jbc.M706628200. [DOI] [PubMed] [Google Scholar]
- 19.Houten SM, et al. Impaired amino acid metabolism contributes to fasting-induced hypoglycemia in fatty acid oxidation defects. Human Molecular Genetics. 2013;22(25):5249–5261. doi: 10.1093/hmg/ddt382. [DOI] [PubMed] [Google Scholar]
- 20.Orngreen MC, et al. Fuel utilization in subjects with carnitine palmitoyltransferase 2 gene mutations. Ann Neurol. 2005;57(1):60–6. doi: 10.1002/ana.20320. [DOI] [PubMed] [Google Scholar]
- 21.Tucci S, et al. Development and pathomechanisms of cardiomyopathy in very long-chain acyl-CoA dehydrogenase deficient (VLCAD−/−) mice. Biochimica et Biophysica Acta (BBA) - Molecular Basis of Disease. 2014;1842(5):677–685. doi: 10.1016/j.bbadis.2014.02.001. [DOI] [PubMed] [Google Scholar]
- 22.Bakermans AJ, et al. Myocardial energy shortage and unmet anaplerotic needs in the fasted long-chain acyl-CoA dehydrogenase knockout mouse. Cardiovascular Research. 2013;100(3):441–449. doi: 10.1093/cvr/cvt212. [DOI] [PubMed] [Google Scholar]
- 23.McCoin CK, TA, Adams SH. Acylcarnitines: old actors auditioning for new roles in metabolic physiology. Nature Reviews Endocrinology. 2015 doi: 10.1038/nrendo.2015.129. [DOI] [PMC free article] [PubMed] [Google Scholar]
- 24.Smith EH, Matern D. Acylcarnitine analysis by tandem mass spectrometry. Curr Protoc Hum Genet. 2010;Chapter 17(Unit 17.8.1–20) doi: 10.1002/0471142905.hg1708s64. [DOI] [PubMed] [Google Scholar]
- 25.Scholz M, Fiehn O. SetupX--a public study design database for metabolomic projects. Pac Symp Biocomput. 2007:169–80. [PubMed] [Google Scholar]
- 26.Fiehn O, Kind T. Metabolite profiling in blood plasma. Methods Mol Biol. 2007;358:3–17. doi: 10.1007/978-1-59745-244-1_1. [DOI] [PubMed] [Google Scholar]
- 27.Cajka T, Fiehn O. Comprehensive analysis of lipids in biological systems by liquid chromatography-mass spectrometry. TrAC Trends in Analytical Chemistry. 2014;61(0):192–206. doi: 10.1016/j.trac.2014.04.017. [DOI] [PMC free article] [PubMed] [Google Scholar]
- 28.Matyash V, et al. Lipid extraction by methyl-tert-butyl ether for high-throughput lipidomics. J Lipid Res. 2008;49(5):1137–46. doi: 10.1194/jlr.D700041-JLR200. [DOI] [PMC free article] [PubMed] [Google Scholar]
- 29.Development Core Team. R: A language and environment for statistical computing. R Foundation for Statistical Computing; Vienna, Austria: 2005. [Google Scholar]
- 30.Benjamini Y, Hochberg Y. Controlling the False Discovery Rate: A Practical and Powerful Approach to Multiple Testing. Journal of the Royal Statistical Society Series B (Methodological) 1995;57(1):289–300. [Google Scholar]
- 31.Kim H, Golub GH, Park H. Missing value estimation for DNA microarray gene expression data: local least squares imputation. Bioinformatics. 2005;21(2):187–98. doi: 10.1093/bioinformatics/bth499. [DOI] [PubMed] [Google Scholar]
- 32.Troyanskaya O, et al. Missing value estimation methods for DNA microarrays. Bioinformatics. 2001;17(6):520–5. doi: 10.1093/bioinformatics/17.6.520. [DOI] [PubMed] [Google Scholar]
- 33.Mevik BH, Wehrens R. The pls Package: Principal Component and Partial Least Squares Regression in R. Journal of Statistical Software. 2007;18(2):1–24. [Google Scholar]
- 34.Mehmood T, et al. A review of variable selection methods in Partial Least Squares Regression. Chemometrics and Intelligent Laboratory Systems. 2012;118(0):62–69. [Google Scholar]
- 35.Wold S, Sjöström M, Eriksson L. PLS-regression: a basic tool of chemometrics. Chemometrics and Intelligent Laboratory Systems. 2001;58(2):109–130. [Google Scholar]
- 36.Piccolo BD, et al. Whey Protein Supplementation Does Not Alter Plasma Branched-Chained Amino Acid Profiles but Results in Unique Metabolomics Patterns in Obese Women Enrolled in an 8-Week Weight Loss Trial. The Journal of Nutrition. 2015 doi: 10.3945/jn.114.203943. [DOI] [PubMed] [Google Scholar]
Associated Data
This section collects any data citations, data availability statements, or supplementary materials included in this article.
Supplementary Materials
Complete data set containing quant ion peak heights (QIPH) for untargeted plasma metabolomics and lipidomics from healthy control subjects (n=11) and individuals with FAOD diagnosed with LCHAD (n=10) or CPT2 (n=2).
Bootstrapped variable importance to projection (VIP) statistics from partial least squared-discriminant analyses of Model 1 and Model 2 from plasma of healthy control (n=11) and FAOD (n=12) individuals with FAOD.
Diagnostic and supplementation information for FAOD subjects
Plasma acylcarnitine analysis performed on 10 h fasted FAOD and healthy control subjects.