Abstract
Rapid eye movement (REM) sleep is a distinct brain state characterized by activated electroencephalogram (EEG) and complete skeletal muscle paralysis, and it is associated with vivid dreams1-3. Transection studies by Jouvet first demonstrated that the brainstem is both necessary and sufficient for REM sleep generation2, and the neural circuits in the pons have since been studied extensively4-8. The medulla also contains neurons that are active during REM sleep9-13, but whether they play a causal role in REM sleep generation remains unclear. Here we show that a GABAergic pathway originating from the ventral medulla (vM) powerfully promotes REM sleep. Optogenetic activation of vM GABAergic neurons rapidly and reliably initiated REM sleep episodes and prolonged their durations, whereas inactivating these neurons had the opposite effects. Optrode recordings from channelrhodopsin 2 (ChR2)-tagged vM GABAergic neurons showed that they were most active during REM sleep (REM-max), and during wakefulness they were preferentially active during eating and grooming. Furthermore, dual retrograde tracing showed that the rostral projections to the pons and midbrain and caudal projections to the spinal cord originate from separate vM neuron populations. Activating the rostral GABAergic projections was sufficient for both the induction and maintenance of REM sleep, which are likely mediated in part by inhibition of REM-suppressing GABAergic neurons in the ventrolateral periaqueductal gray (vlPAG). These results identify a key component of the pontomedullary network controlling REM sleep. The capability to induce REM sleep on command may offer a powerful tool for investigating its functions.
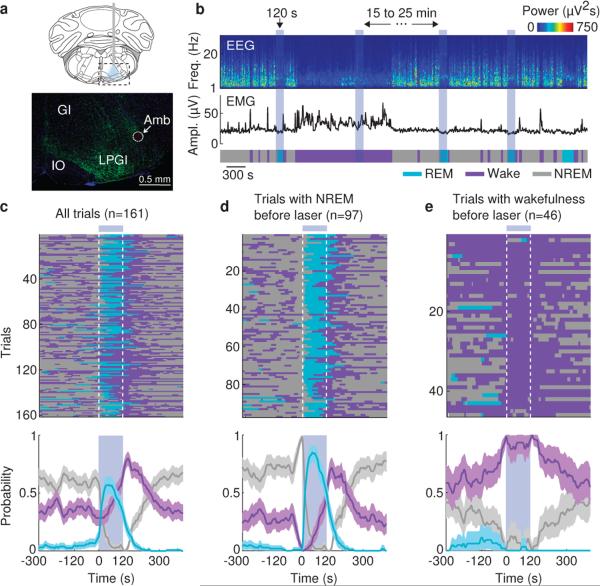
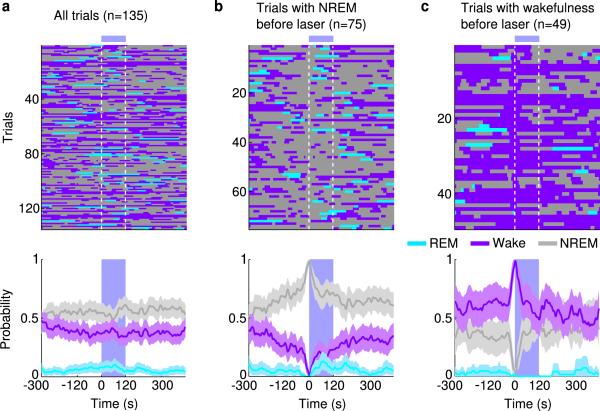
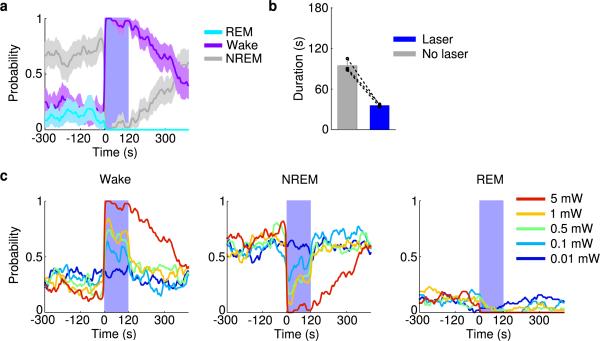
Previous studies showed that the vM contains GABAergic neurons expressing the immediate early gene c-fos following deprivation-induced REM sleep rebound11,12, suggesting REM sleep-related activity. To test the causal relationship between vM GABAergic neuron activity and brain states, we injected Cre-inducible adeno-associated viruses (AAV) expressing ChR2-eYFP locally into the vM of GAD2-Cre mice (Fig. 1a). Laser stimulation (20 Hz, 120 s/trial) was applied every 15-20 min, and brain states – wake, REM and non-REM (NREM) sleep – were classified based on EEG and electromyogram (EMG) recordings. REM sleep was observed at a high probability during laser stimulation (Fig. 1b and Supplementary Video 1). To quantify the effect, we aligned all trials from 6 mice by the time of laser stimulation (Fig. 1c). We found a rapid, ~12 fold increase in REM sleep within 30 s of laser onset (P<0.001, bootstrap) and a complementary decrease of NREM sleep. The EEG power spectrum and EMG activity during the laser-induced REM state were indistinguishable from those during spontaneous REM sleep outside of laser stimulation periods (Extended Data Fig. 1). In control mice expressing eYFP without ChR2, laser had no effect (Extended Data Fig. 2), and the laser-induced change in REM sleep probability was significantly different between the ChR2 and control mice (P<0.001, bootstrap). Furthermore, ChR2-mediated activation of vM glutamatergic neurons reliably induced wakefulness rather than REM sleep (Extended Data Fig. 3), indicating that the REM-promoting effect was specific to GABAergic neurons.
Figure 1. Optogenetic activation of vM GABAergic neurons induces REM sleep.
a, Top, schematic of optogenetic experiment (adapted from Paxinos and Franklin mouse brain atlas). Bottom, fluorescence image of vM (dashed box in schematic) in a GAD2-Cre mouse injected with AAV expressing ChR2-eYFP (green). Blue, DAPI. GI, gigantocellular reticular nucleus; LPGI, lateral paragigantocellular nucleus; IO, inferior olive; Amb, ambiguus nucleus. ChR2-eYFP was expressed within ~400 μm from injection site and mainly localized within the LPGI. b, Example experiment. Shown are EEG power spectrogram, EMG amplitude, and brain states (color coded). Blue shading, laser stimulation period (20 Hz, 120 s). c, Brain states in all trials from 6 mice (top) and probability of wake, NREM or REM states (bottom) before, during, and after laser stimulation. Shading, 95% confidence intervals (CI). Blue bar, laser stimulation period. d, Similar to (c), for trials with laser onset falling on NREM sleep (probability of NREM is 1 immediately before laser onset). e, Trials with laser onset falling on wakefulness.
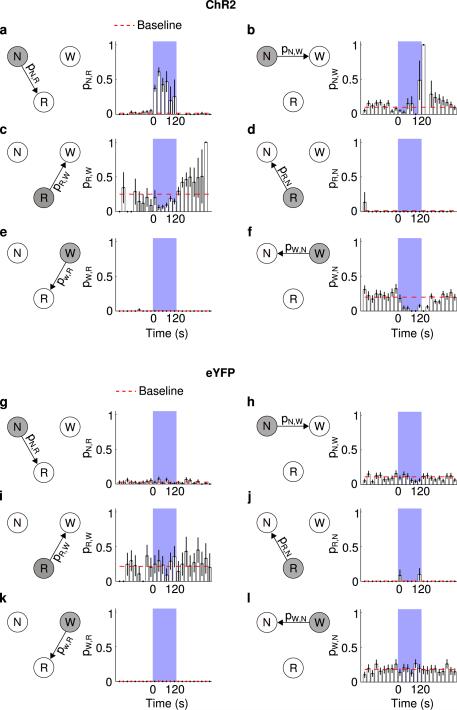
The complementary changes in REM and NREM probabilities (Fig. 1c) suggest that vM GABAergic neuron activation primarily triggered NREM→REM transitions. To test this possibility, we analyzed the effect of laser on the transition probability between each pair of brain states. Laser stimulation markedly enhanced the NREM→REM transitions (P=0.02, bootstrap; Extended Data Fig. 4a). As a result, for trials in which laser onset fell on NREM sleep, the probability of REM sleep increased to 85% within 50 s (Fig. 1d), and NREM→REM transitions occurred in 94% of these trials. Notably, laser stimulation caused no significant change in NREM→wake (P=0.24) and a reduction in REM→wake (P<0.001) transition probability (Extended Data Fig. 4b, c). Thus the gradual increase of wakefulness during laser stimulation (Fig. 1c, purple) was not due to a direct induction of wakefulness, but a secondary consequence of laser-induced increase in REM sleep (in rodents REM sleep periods are often shorter than 120 s and typically followed by wakefulness). Furthermore, direct wake→REM transitions, characteristic of narcolepsy, were not observed (Extended Data Fig. 4e), indicating that optogenetic activation of vM GABAergic neurons triggered normal but not pathological transitions into REM sleep. This also explains why in trials in which laser was turned on during wakefulness, no increase in REM sleep was observed (Fig. 1e, Trial 3 in Supplementary Video 1).
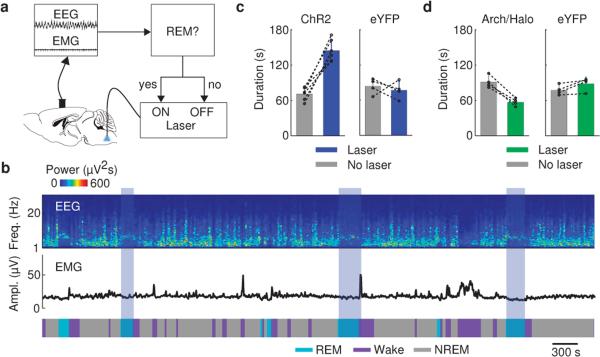
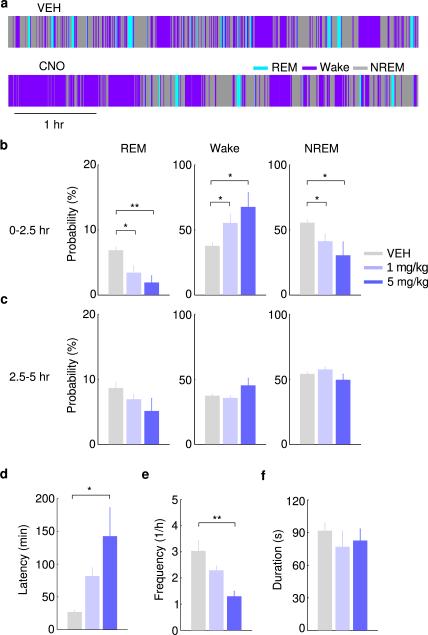
To test whether these neurons also contribute to REM sleep maintenance, we applied a closed-loop protocol14, in which laser stimulation was initiated after spontaneous REM sleep onset and maintained throughout the REM episode (Fig. 2a). The stimulation was applied randomly in ~50% of the episodes, and REM duration was compared between the episodes with and without stimulation (Fig. 2b). Laser stimulation increased the mean duration of REM episodes by 111% in GAD2-ChR2 mice (laser, 148.0±19.2 s, s.d.; no laser, 70.2±10.1 s; P=0.00037, paired t-test, n=6 mice) but not in eYFP control mice (laser, 77.0±14.9 s; no laser, 83.8±13.6 s; P=0.62, n=4; Fig. 2c). Conversely, archaerhodopsin (Arch) or halorhodopsin (Halo)-mediated silencing of vM GABAergic neurons (green laser) caused a 41% reduction of REM duration (laser, 54.1±9.8 s, s.d.; no laser, 91.2±11.7 s; P=0.001, n=4), an effect not observed in eYFP control mice (laser, 90.0±12.9 s; no laser, 79.5±9.6 s; P=0.075, n=4, Fig. 2d). Thus, vM GABAergic neuron activity also contributes strongly to REM sleep maintenance. In addition, we pharmacogenetically silenced vM GABAergic neurons by expressing hM4Di15. Compared to vehicle injection, inhibition of these neurons by clozapine-N-oxide (CNO) injection strongly reduced REM sleep in a dose-dependent manner (Extended Data Fig. 5), further indicating the importance of vM GABAergic neurons in REM sleep generation.
Figure 2. Activation of vM GABAergic neurons prolongs REM sleep duration.
a, Schematic of closed-loop stimulation. Laser was turned on after spontaneous REM onset and turned off at REM termination. b, Example recording containing REM episodes with and without laser stimulation (blue shading). c, Mean REM sleep duration with and without laser stimulation, in ChR2 (left, n=6 mice) and eYFP control mice (right, n=4). Each pair of dots, data from one mouse. Error bar, ±s.d. d, Similar to (c), but with green laser stimulation in Arch/Halo (left, n=4 mice) and eYFP control (right, n=4) mice.
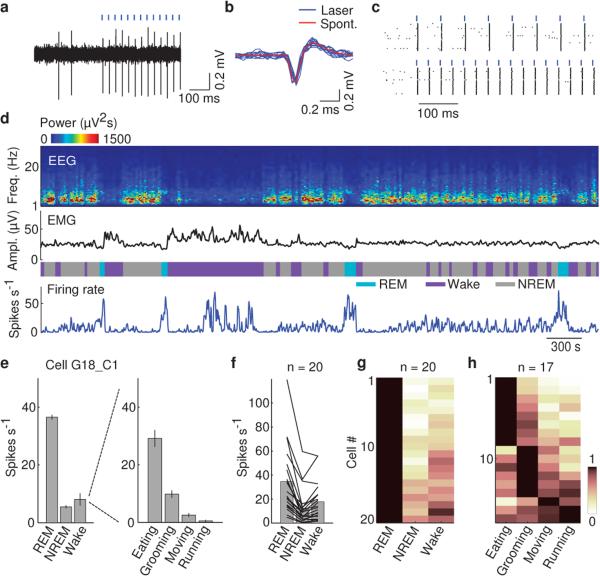
Although vM GABAergic neurons have been shown to express c-fos following deprivation-induced REM sleep rebound11,12, the slow time course of c-fos expression and its modulation by non-activity-related factors16 limit its precision in identifying REM-active neurons. To understand how vM GABAergic neurons regulate REM sleep under natural conditions, we recorded their spiking activity across brain states. Since the vM contains multiple spatially intermingled cell types17, we tagged the GABAergic neurons with ChR2 by crossing GAD2-Cre with ChR2 reporter (Ai 32) mice. Recordings were made in freely moving mice using optrodes, consisting of an optic fiber surrounded by multiple microelectrodes. High-frequency laser pulses (15 or 30 Hz) were applied intermittently, and single units exhibiting reliable laser-evoked responses with short latencies and low jitter were identified as GABAergic neurons (Fig. 3a-c and Extended Data Fig. 6a). The identified neurons consistently fired at high rates during REM sleep, low rates during NREM sleep, and variable rates during wakefulness9 (Fig. 3d and Supplementary Video 2). When the firing rates were averaged within each state, all 20 identified GABAergic neurons were most active during REM sleep (P<0.005, Wilcoxon rank sum test; Fig. 3e-g, referred to as “REM-max” neurons). The mean firing rate of these neurons during REM sleep (34.6 spikes/s, 95% confidence interval (CI): 23.6 – 48.0 spikes/s) was in fact higher than the laser stimulation frequency applied in our experiments (Figs. 1 and 2), suggesting that their activity is sufficient for the observed REM promoting effects. Their firing rates increased gradually over ~30 s before the NREM→REM transition and decreased abruptly at the end of REM sleep (Extended Data Fig. 7). Such a temporal profile is well suited for both the induction and maintenance of REM sleep.
Figure 3. Firing rates of identified vM GABAergic neurons across brain states.
a, Example recording of spontaneous and laser-evoked spikes from a vM neuron. Blue ticks, laser pulses (30 Hz). b, Comparison between laser-evoked (blue) and averaged spontaneous (red) spike waveforms from this unit. c, Spike raster showing multiple trials of laser stimulation at 15 and 30 Hz. d, Firing rates of an example vM GABAergic neuron. e, Left, mean firing rates of the neuron in (d) during different brain states. Error bar, ±s.e.m. Right, firing rates of the neuron during different wakeful behaviors. f, Firing rates of 20 identified vM GABAergic neurons during different brain states. Each line shows firing rates of one unit; gray bar, average across units. g, Relative firing rates across brain states. The rates of each neuron were normalized by its maximum. All 20 neurons showed maximum firing rates during REM sleep (the difference was significant at P<0.005 for all 20 neurons compared to NREM and wakefulness; Wilcoxon rank sum test, post-hoc Bonferroni correction). h, Relative firing rates of 17 vM GABAergic neurons during different wakeful behaviors.
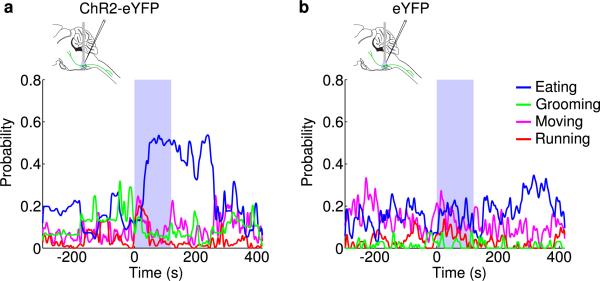
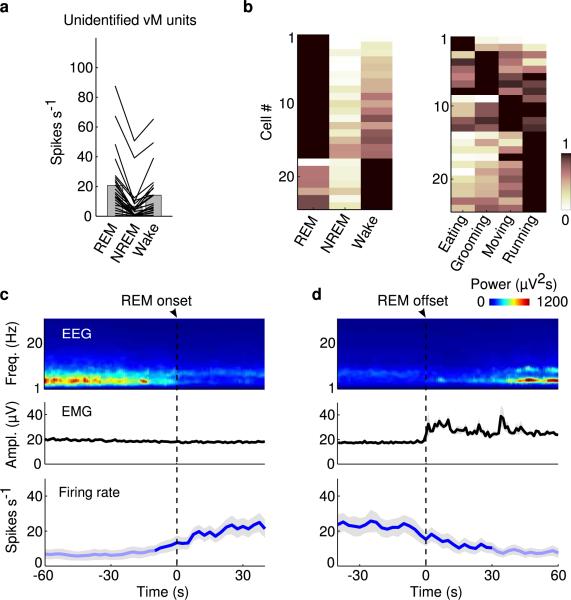
Since during wakefulness the firing rates of vM GABAergic neurons were highly variable, we analyzed their relationship with different wakeful behaviors (classified based on video recordings, Supplementary Video 2). Of the 17 identified GABAergic neurons with recording periods encompassing multiple behaviors, 82% were most active during eating (n=8) or grooming (n=6) and much less active during moving or running (Fig. 3h and Extended Data Fig. 6c). Such a firing pattern is distinct from that of noradrenergic neurons in the locus coeruleus (a known postsynaptic target of vM GABAergic neurons18), which are strongly suppressed during eating and grooming19. Interestingly, activation of vM GABAergic neurons during wakefulness increased eating (Extended Data Fig. 8), indicating a causal relationship between their firing and the eating behavior. Among the 24 unidentified neurons recorded in the vM (likely to include non-GABAergic neurons), 71% were also REM-max9,10,13 (Extended Data Fig. 9a, b). Compared to the identified GABAergic neurons, however, the unidentified group showed a delayed firing rate increase before REM sleep onset (~10 s) and a more gradual decrease at REM termination (Extended Data Fig. 9c, d). In addition, many of them were most active during running or moving (Extended Data Fig. 9b, right).
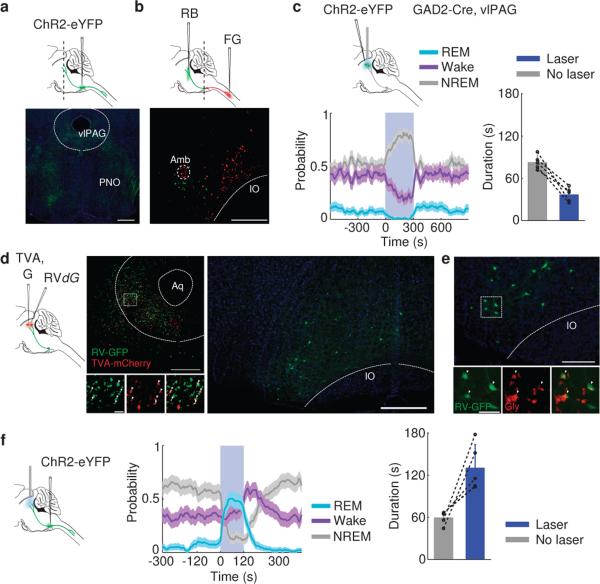
Previous studies showed that vM neurons project both rostrally to the pons, midbrain, and other brain regions and caudally to the spinal cord13,20. We wondered which pathway mediates the REM-promoting effect. The pons and midbrain are known to be crucial for REM sleep generation2,4,6-8,12. Injection of Cre-inducible AAV expressing ChR2-eYFP into the vM of GAD2-Cre mice revealed extensive axon projections to these regions (Fig. 4a). In particular, the vlPAG is thought to suppress REM sleep by providing GABAergic inhibition to REM-promoting neurons7,12. To test the effect of vlPAG GABAergic neuron activity on brain states, we injected Cre-inducible AAV expressing ChR2-eYFP into the vlPAG of GAD2-Cre mice. Laser stimulation almost completely suppressed REM sleep onset (P<0.001, bootstrap, n=6) and shortened REM episode duration (laser, 37.1±10.2 s, s.d.; no laser, 82.8±9.9 s; P=0.003, paired t-test, n=5) while strongly promoting NREM sleep (P<0.001, bootstrap; Fig. 4c). Rabies virus–mediated monosynaptic retrograde tracing confirmed that vlPAG GABAergic neurons receive direct inhibitory innervation from vM neurons (Fig. 4d, e). Furthermore, optogenetic activation of vM GABAergic neuron axons within the vlPAG caused large increases in both the initiation (P<0.001, bootstrap, n=5) and duration (laser, 130.7±32.9 s, s.d.; no laser, 59.6±9.6 s; P=0.02, paired t-test, n=5) of REM sleep episodes (Fig. 4f), with magnitudes comparable to those found with vM cell body stimulation (Figs. 1 and 2). Although in principle axon fiber stimulation in the vlPAG could antidromically activate neuronal cell bodies in the vM and axon collaterals to other regions, simultaneous injections of retrograde tracers to both the pons and spinal cord showed little overlap between the labeled neurons (1.3%, Fig. 4b), indicating that the rostral and caudal projections arise largely from separate vM neuron populations. Thus, the rostral projections from vM GABAergic neurons exert a strong REM sleep-promoting effect, likely mediated at least in part by direct inhibition of the REM-suppressing vlPAG GABAergic neurons.
Figure 4. Inhibition of vlPAG GABAergic neurons by vM projections promotes REM sleep.
a, Top, schematic showing injection of AAV expressing ChR2-eYFP into the vM of a GAD2-Cre mouse. Bottom, fluorescence image of vM axons in the pons and midbrain (position of coronal section indicated by dashed line in schematic). Scale bar, 500 μm; Green, eYFP; Blue, DAPI. b, Top, schematic showing simultaneous injections of RetroBeads (RB) in the pons and FluoroGold (FG) in the spinal cord. Bottom, fluorescence image of vM, showing neurons labeled by RB and FG. Among the 1235 FG- and 881 RB-labeled neurons, only 27 were double labeled. Scale bar, 500 μm. c, Left, probability of wake, NREM or REM states before, during, and after laser stimulation of vlPAG GABAergic neurons (20 Hz, 300 s; n=6 mice). Shading, 95% CI; Blue bar, laser stimulation period (20 Hz, 300s). Right, mean REM durations with and without vlPAG stimulation (n=5 mice). Each pair of dots, data from one mouse. Error bar, ±s.d. d, Left, schematic showing rabies-mediated transsynaptic tracing. TVA, EnvA receptor; G, rabies glycoprotein; RVdG, G-deleted rabies virus. Middle, fluorescence image of vlPAG in a GAD2-Cre mouse. Scale bar, 500 μm. Bottom middle, enlarged view of region in white box showing starter cells (yellow, expressing both GFP and mCherry, arrowheads; Scale bar, 20 μm). Right, rabies-labeled presynaptic neurons in vM (same brain as in middle panel). Scale bar, 500 μm. e, Rabies-labeled presynaptic neurons in vM are GABAergic and glycinergic. Lower panel, enlarged view of region in white box, containing GFP labeled neurons expressing glycine (Gly, arrowheads; Scale bar, 50 μm). GABA and glycine co-exist in a high percentage of vM neurons (Extended Data Fig. 10), suggesting that the glycinergic rabies-labeled neurons in the vM are also GABAergic. In total, 82% (185/226) rabies-labeled cells were glycine positive (n=3 mice). f, Left, probability of wake, NREM or REM states before, during, and after laser stimulation of vM axons in vlPAG (20 Hz, 120 s; n=5 mice). Shading, 95% CI. Right, mean REM durations with and without vM axon stimulation (n=5 mice). Error bar, ± s.d.
Although the medulla is known to be involved in REM sleep generation, previous studies have focused primarily on its role in inducing muscle atonia, through projections to the spinal cord21,22. Our findings indicate that vM GABAergic neurons constitute a critical component of the core network, generating not only muscle atonia but also the cortical activation associated with REM sleep17,23,24. The effect is largely, if not completely, attributable to the rostral projections (Fig. 4), consistent with the previous finding that inactivation of the pons or transection at the pontomedullary junction blocks the muscle atonia evoked by medulla stimulation25,26. The projection to the locus coeruleus is likely to provide GABAergic inhibition of noradrenergic neurons13,18, whose activity enhances wakefulness27 and spinal motor neuron excitability28. Inhibition of the vlPAG GABAergic neurons (Fig. 4c) should cause disinhibition of the REM-promoting neurons in the pons5-8,12, which may in turn trigger muscle atonia through their projections to the medulla and spinal cord, and cortical activation through their projections to midbrain and forebrain regions. The glutamatergic REM-active neurons in the dorsal pons6 may also innervate the vM GABAergic neurons13, thus shaping their firing rates across different brain states (Fig. 3).
In addition to the vM, the dorsal medulla also contains REM-max GABAergic neurons projecting to the locus coeruleus29, which may also contribute to REM sleep generation. The induction of NREM→REM but not wake→REM transitions by vM neurons points to a robust wake maintenance mechanism – likely to involve orexin/hypocretin neurons30 – that cannot be overridden by activating the vM GABAergic neurons. How this mechanism interacts with the REM sleep generation circuit remains to be elucidated. Furthermore, a long-standing mystery is what functions are served by REM sleep and its associated dreaming. The ability to control REM sleep at a high temporal precision, as demonstrated in this study, provides a powerful tool for studying its functions.
METHODS
Animals
All experimental procedures were approved by the Animal Care and Use Committee at the University of California, Berkeley. Optogenetic manipulation experiments were performed in male or female GAD2-Cre (Jackson Lab stock #010702) and VGLUT2-Cre (#016963) mice. Pharmacogenetic, rabies-mediated transsynaptic tracing and anterograde tracing experiments were performed in male or female GAD2-Cre mice. For optrode recording experiments, male GAD2-Cre mice were crossed with female loxP-flanked-ChR2-eYFP mice (#012569). Retrograde tracing experiments with RetroBeads (Lumafluor) and FluoroGold (Fluorochrome) were carried out in male or female wild-type (C57) mice.
Surgery
Adult (6 - 12 week old) mice were anesthetized with isoflurane (3% induction, 1.5% maintenance) and placed on a stereotaxic frame. Body temperature was kept stable throughout the procedure using a heating pad. After asepsis, the skin was incised to expose the skull, and the overlying connective tissue was removed. For optogenetic experiments, a craniotomy (~1 mm diameter) was made above the right cerebellum (6.8 mm posterior to bregma, 0.6-0.9 mm lateral). Virus (AAV2-EF1α-FLEX-ChR2-eYFP, AAV2-EF1α-FLEX-eYFP, AAV2-EF1α-FLEX-eNpHR3.0-EYFP, AAV2-CAG-FLEX-ArchT-tdTomato, produced by University of North Carolina Vector Core, or AAV-DJ-EF1α-FLEX-ChR2-eYFP) was loaded into a sharp micropipette mounted on a Nanoject II and injected slowly at a depth of 4.8 mm from brain surface (600-800 nL). An optical fiber (200 μm diameter) was inserted with the tip ~ 400 μm above the virus injection site. To stimulate axon projections of vM GABAergic neurons in the vlPAG, the optical fiber was implanted on top of the vlPAG (4.8 mm posterior to bregma, 0.6 mm lateral, 2.3 mm depth). To activate vlPAG GABAergic neurons, AAV expressing ChR2-eYFP was injected into the vlPAG. For pharmacogenetic experiments, AAV8-hSyn-FLEX-hM4D(Gi)-mCherry was injected bilaterally (300-800 nL on each side). For EEG and EMG recordings, a reference screw was inserted into the skull on top of the left cerebellum. EEG recordings were made from two screws on top of the left and right cortex (1 mm posterior to bregma). Two EMG electrodes were inserted into the left and right neck muscles. The optical fiber, screws, and EEG/EMG electrodes were secured to the skull using dental cement. Without optogenetic manipulation, the sleep architecture quantified by the percentage, average duration and frequency of each brain state of these implanted animals is well within the range reported for mice without these implants, indicating that virus injection and optic fiber implantation did not cause large chronic changes in sleep architecture. For optogenetic experiments, data from animals where the tip of the optic fiber was not within the aimed location were excluded. For pharmacogenetic experiments, data from animals where virus expression was not restricted to the vM were excluded.
For optrode recording experiments, the optrode assembly was inserted at a depth of 4.8 mm. A screw was attached to the frontal skull for EEG recording, and an EMG electrode was inserted into the right neck muscle. The optrode assembly, screws, and EEG/EMG electrodes were secured to the skull using dental cement.
For rabies-mediated retrograde tracing experiments, we first injected 100-150 nL of a combination of AAV5-CAG-FLEX-TCB (2.6 × 10¹² vector genomes/mL) and AAV8-CAG-FLEX-RG (1.3 × 10¹² vector genomes/mL)31 (addgene #48332 and #48333, respectively) into the vlPAG (4.8 mm posterior to bregma, 0.6 mm lateral, 2.5 mm depth) of GAD2-Cre mice.
Three weeks later, RVdG (titer 5 × 10⁸ colony forming units/mL) pseudotyped with EnvA was injected into the vlPAG. AAV5-CAG-FLEX-TCB and AAV-CAG-FLEX-RG were purchased from the University of North Carolina viral core, and RVdG was amplified in house from a stock derived from the Salk Institute viral core. Data from mice where starter cells were found outside the vlPAG were excluded. For controls, we injected the same viruses in the same temporal sequence into wild-type mice (n=2). No GFP-labeled cells were detected in the vM.
For dual retrograde tracing experiments, we injected RetroBeads bilaterally into the pons (5.0-5.2 mm posterior to bregma, 0.9 mm lateral) at several depths (3.0, 3.5, and 4.0 mm, 150-200 nl at each depth). The spinal cord was exposed by a unilateral laminectomy of a cervical vertebra. After a small incision in the dura, FluoroGold was injected (0.7 mm lateral, 1 mm depth, 400-700 nl). Histology and in vivo experiments were performed >10 and >21 days after injection.
Polysomnographic recordings
Animals were housed on a 12-hr dark/12-hr light cycle (light on between 7:00 and 19:00). Behavioral experiments were carried out between 13:30 and 18:30. EEG and EMG electrodes were connected to flexible recording cables via a mini-connector, and recordings were made in the animal's home cage placed in a sound-attenuation box. Recordings started after >1 hr of habituation. The signals were recorded with a TDT RZ5 amplifier, filtered (1-750 Hz) and digitized at 1500 Hz. Brain states were classified into NREM sleep, REM sleep, and wakefulness using a custom-written MATLAB software. The classification was performed without any information regarding the identity of the animal or laser stimulation timing. First, we calculated the power spectrum of the EEG and EMG using a 5 s sliding window, sequentially shifted by 2.5 s increments. Next, we summed the EEG power in the ranges from 1 to 4 Hz and from 6 to 12 Hz, yielding a time dependent delta and theta power, respectively. For further analysis, we divided the theta by the delta power (theta/delta ratio). We also computed the total EMG power from 20 to 300 Hz. For each time point, we determined the brain state using a threshold algorithm. A state was classified as NREM if the delta power was lower than its mean (averaged over the whole recording session) and if the EMG power was lower than its mean plus one standard deviation. A state was classified as REM if (1) the delta power was lower than the average, (2) the theta/delta ratio deviated more than one standard deviation from its mean, and (3) the EMG power was lower than its mean plus one standard deviation. All remaining states were classified as wake. The wake state thus encompassed states with high EMG power (active awake), or low delta power without elevated EMG activity or theta/delta ratio (quiet awake). Finally, we manually verified the automatic classification to ensure that all states were correctly assigned.
Behavioral monitoring
To classify different wakeful behaviors, we made video recordings (sampling rate, 5 Hz) using a camera placed on top of the cage. Wakeful behaviors were divided into four categories: eating, grooming, moving, and running. The classification was performed manually, based on the video, EEG, and EMG recordings, using a custom-written graphical user interface (programmed in MATLAB). The experimenter classifying the wakeful behaviors was blind to the timing of laser stimulation or the identity of the animal.
Optogenetic manipulation
For optogenetic experiments, the experimenter randomly assigned mice to the control group or one of the experimental groups. Experimental and control animals were subjected to exactly the same surgical and behavioral manipulations. To test the role of vM GABAergic neurons in REM sleep induction, we applied blue laser stimulation (473 nm, 5 mW at fiber tip) at 20 Hz (10 ms/pulse). Each trial lasted for 120 s (stimulation of vM GABAergic neurons and axon projections) or 300 s (stimulation of vlPAG GABAergic neurons), and the inter-trial interval was chosen randomly from a uniform distribution between 15 and 25 min. For each animal we recorded at least two 5-hr sessions.
To test the role of vM or vlPAG GABAergic neurons in REM sleep maintenance, we applied a closed-loop stimulation protocol. The animal's brain state was classified by real-time analysis of EEG/EMG recordings. As soon as REM sleep was detected, the laser was turned on with 50% probability, and turned off only when the REM episode ended. This allowed comparison of the durations of REM episodes with and without laser stimulation within the same recording session. REM periods were assigned to either the experimental or control group according to a pseudo-random Bernoulli sequence generated before the start of the experiment. For each animal at least two 5 hr sessions were recorded. In ChR2-mediated activation experiments, we used a blue laser (473 nm, 5 mW, 20 Hz). In Arch/Halo-mediated inhibition experiments, we used a green laser (532 nm, 20 mW, step pulse).
Pharmacogenetic manipulation
To inhibit vM GABAergic neurons, we injected clozapine N-oxide (CNO) dissolved in 0.1 ml vehicle solution (PBS with 0.5% DMSO) into GAD2-Cre mice expressing hM4Di in the vM, 20 min prior to the recording session. CNO was administered intraperitoneally at two doses (1 and 5 mg/kg body weight) on different days. For the control experiment, we injected the vehicle solution without CNO.
Optrode recording
To record the activity of vM GABAergic neurons, we used a custom-built optrode32, consisting of an optical fiber (0.1 or 0.2 mm diameter) surrounded by 12 microwire electrodes (Stablohm 675) twisted into stereotrodes or tetrodes. The electrode tips were electroplated in a chloride-platinum solution to an impedance of ~600 kΩ. The optical fiber and electrodes were inserted into a screw-driven microdrive. The optrode was slowly lowered in 25 to 50 μm steps to search for light-responsive neurons. The signals were recorded using a TDT RZ5 amplifier, filtered (0.3-8 kHz) and digitized at 25 kHz. Recordings were carried out over a period of 1-2 months from each mouse. At the end of the experiment electrolytic lesions were made by passing a current (100 μA, 10 s) through one or two electrodes to identify the end of the recording tract.
Spike sorting
Spikes were sorted offline based on the waveform energy and the first three principal components of a spike waveform on each stereotrode or tetrode channel. Single units were identified either manually using the software Klusters (http://neurosuite.sourceforge.net) or automatically using the software klustakwik (http://klustakwik.sourceforge.net). The quality of each unit was assessed by the presence of a refractory period and quantified using isolation distance and L-ratio33. Units with an isolation distance <19 or L-ratio >0.1 were discarded. For units recorded with stereotrodes, the median values of isolation distance and L-ratio were 34.4 and 0.001. For units recorded with tetrodes, the corresponding median values were 38.3 and 0.023.
Identification of GABAergic units
To identify ChR2-expressing vM GABAergic neurons, high-frequency laser pulse trains (15 and 30 Hz with duration of 1 and 0.5 s, respectively) were delivered every one or two min. The laser power and pulse duration were optimized to identify light-responsive neurons without changing the brain state. A unit was identified as GABAergic if spikes were evoked by laser pulses (both 15 and 30 Hz trains) at high reliability (>0.6), short first-spike latency (<6 ms), and small jitter (<2 ms), and if the waveforms of the laser-evoked and spontaneous spikes were highly similar (correlation coefficient >0.9; Extended Data Fig. 6a). To compute the mean firing rate of each neuron in each brain state, spikes during the laser pulse trains were excluded. Twenty out of 21 identified GABAergic units had their recording periods encompassing all three brain states. For 17 units the recording periods encompassed all four wakeful behaviors.
In total we recorded from 21 identified GABAergic units and 24 unidentified units. However, the ratio (21/24) is likely affected by sampling bias and thus may not reflect the actual percentage of ChR2-labeled GABAergic neurons in the vM. In general, the success rate for finding a neuron that is reliably activated by laser is very low. To maximize the rate of data collection from identified neurons, we spent the 1-2 hrs on recording (instead of moving the electrode to a new location) only if we found at least one unit that appeared to be activated by the laser pulses. As a result, most of the unidentified units were recorded simultaneously with other laser-driven, putative GABAergic units.
Histology and immunohistochemistry
Mice were deeply anesthetized and transcardially perfused with 0.1 M PBS followed by 4% paraformaldehyde (wt/vol) in PBS. For fixation, brains stayed overnight in 4% paraformaldehyde. For cryoprotection, brains were placed in 30% sucrose (wt/vol) in PBS solution for at least two nights. After embedding and freezing, brains were sectioned into 20, 30 or 60 μm coronal slices using a cryostat. For immunohistochemistry, non-specific binding sites were blocked by incubating the sections in 2% donkey or goat serum in PBST (0.3% Triton X-100 in PBS). Brain sections were stained with an anti-choline acetyltransferase antibody (AB144, Millipore; 1:250) for cholinergic neurons, and anti-glycine (AB5020, Millipore, 1:100) for glycinergic neurons. To amplify the fluorescence of axon fibers expressing ChR2-eYFP, we used an antibody against GFP (A11122 or A11120, Life technologies, 1:1000). Brain sections were incubated with the primary antibody in blocking solution for two nights. Species-specific secondary antibodies conjugated with red or green Alexa fluorophores (donkey anti-mouse, A21202, 1:1000; goat anti-rabbit, A11008, 1:1000; donkey anti-goat, A11058, 1:250) in PBS were applied for 2 hrs. Finally, slides were washed for 2 hrs in PBS and mounted with Fluoromount. Fluorescence images were taken using a confocal microscope (LSM 710 AxioObserver Inverted 34-Channel Confocal) and Nanozoomer.
Statistics
All statistical tests (paired t-test, Wilcoxon rank sum test, Wilcoxon signed-rank test, bootstrap) were two-sided. For both paired and unpaired tests, we ensured that the variance of the data is similar between the compared groups. For t-tests, we verified that the data are normally distributed using Lilliefors test for normality.
The 95% confidence intervals (CI) for brain state probabilities were calculated using a bootstrap procedure: For an experimental group of n mice, with mouse i comprising mi trials, we calculated the CI as follows: we repeatedly resampled the data by randomly drawing for each mouse mi trials (random sampling with replacement). For each of the 10,000 iterations, we recalculated the mean probabilities for each brain state across the n mice. The lower and upper confidence intervals were then extracted from the distribution of the resampled mean values. To test whether a given brain state is significantly modulated by laser stimulation, we calculated for each bootstrap iteration the difference between the mean probabilities during laser stimulation and the preceding period of identical duration. From the resulting distribution of difference values, we then calculated a P-value to assess whether laser stimulation significantly modulated the brain state.
Samples sizes
To determine the sample sizes of the experimental groups for optogenetic and pharmacogenetic experiments, for each group we first performed pilot experiments with two or three mice. Given the strength of the effect and the variance across this group, we then predicted the number of animals required to reach sufficient statistical power. To determine the sample size (number of units) for optrode recordings, we first recorded from two animals. Given the success rate of finding identified units and the homogeneity of units in the initial data set, we set a target sample size of 20 units. For rabies-mediated, anterograde, or dual retrograde tracing experiments the selection of the sample size was based on numbers reported in previous studies.
Extended Data
Extended Data Figure 1. Comparison of spontaneous and laser-induced REM sleep.
a, Mean EEG spectrogram and EMG amplitude before and after laser onset (averaged across all trials with laser onset falling on NREM sleep). b, Mean EEG spectrogram and EMG amplitude before and after spontaneous REM onset outside of laser stimulation periods (only REM episodes with duration >70 s were included). c, Comparison of EEG power spectra during spontaneous (gray) and laser-induced (blue) REM sleep. Blue shading, ±s.e.m. for laser-induced REM sleep.
Extended Data Figure 2. Effect of laser stimulation on brain states in eYFP control mice.
a, Brain states in all trials from 5 mice aligned by time of laser stimulation (top) and probability of wake, NREM or REM states before, during, and after laser stimulation (bottom). Shading, 95% confidence intervals (CI). Blue bar, period of laser stimulation. Laser stimulation caused no significant change in the probability of any brain state (P > 0.34, bootstrap). b, Similar to (a), for trials in which laser onset fell on NREM sleep. c, Trials in which laser onset fell on wakefulness.
Extended Data Figure 3. Optogenetic activation of vM glutamatergic neurons induces wakefulness.
a, Probability of wake, NREM or REM states before, during, and after laser stimulation (20 Hz, 120 s) in VGLUT2-Cre mice injected with AAV expressing ChR2-eYFP into the vM (n=3 mice). Shading, 95% CI. Blue bar, period of laser stimulation. Laser stimulation caused a significant increase in wakefulness (P<0.001, bootstrap) and decrease in NREM sleep (P<0.001). b, Mean durations of REM sleep episodes with and without laser stimulation. Each pair of dots represent data from one mouse. Laser stimulation shortened the duration of REM sleep episodes (n=3 mice, P=0.008, paired t-test). Error bar, ±s.d. c, Probability of wake (left), NREM (middle), and REM (right) states before, during, and after laser stimulation (20 Hz, 120 s) at different laser powers (color coded).
Extended Data Figure 4. Effect of laser stimulation of vM GABAergic neurons on transition probability between each pair of brain states in ChR2 (a-f) and eYFP control (g-l) mice.
a, Probability of NREM (N)→REM (R) state transition within each 20 s period in ChR2 mice. Blue shading, period of laser stimulation (20 Hz, 120 s). Error bar, ± s.d. (bootstrap, n=6 mice). Baseline transition probability (red dashed line) was computed after excluding the laser stimulation period. The probability during laser stimulation was significantly higher than the baseline (P=0.02, bootstrap). b, Similar to (a), for NREM→wake (W) transition. The probability during laser stimulation was not significantly different from baseline (P=0.24). c, REM → wake, probability during laser stimulation was significantly lower than baseline (P<0.001), consistent with the effect of vM GABAergic neurons on prolonging REM duration (Fig. 2). d, REM→NREM, which rarely occurs in rodents. Laser stimulation caused no significant effect (P>0.99). e, Wake→REM, which rarely occurs in normal mice. Laser stimulation had no significant effect (P>0.99). f, Wake→NREM. Laser stimulation caused a significant reduction of the transition probability (P<0.001), indicating that during wakefulness vM GABAergic neuron activity has a wake-maintenance effect. g-l, Similar to (a-f), for eYFP control mice. Laser stimulation had no significant effect on any transition probability (P>0.05).
Extended Data Figure 5. Pharmacogenetic inactivation of vM GABAergic neurons reduces REM sleep.
a, Brain states in a control (vehicle injection) and a CNO session from an example mouse. The recording session started 20 min after vehicle or CNO injection. b, Probability of each brain state during the first 2.5 hrs of the recording session, following injection of vehicle (gray) or two dosages of CNO (different shades of blue). Error bar, ±s.e.m. (n=6 mice). *, P<0.05; **, P<0.01; one-way ANOVA with post hoc Dunnett's test. c, Similar to (b), but during the second half of the recording session (2.5 to 5 hrs). There was no significant difference between control and CNO at any dosage (P>0.12). d, Latency of first REM sleep episode (from the beginning of each recording session). e, Frequency of REM episodes during the first 2.5 hrs of the recording session. f, Duration of REM episodes during the first 2.5 hrs of the session. The reduction of REM sleep caused by pharmacogenetic inactivation of vM GABAergic neurons appears to be due to the reduction of frequency rather than duration of REM episodes.
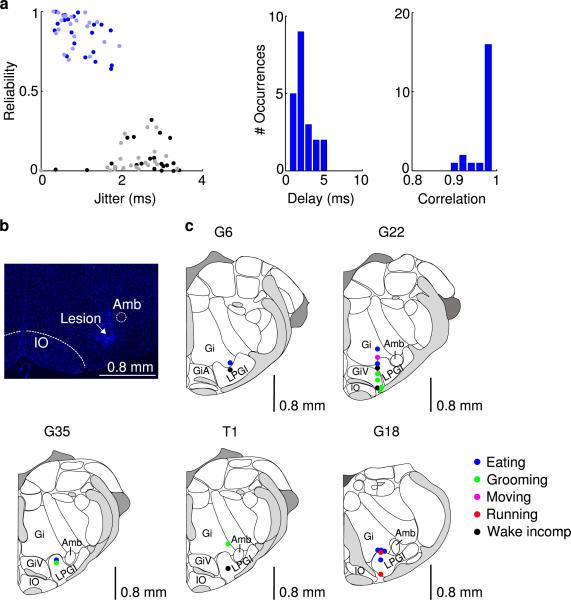
Extended Data Figure 6. Optogenetic identification of vM GABAergic neurons.
a, Left, reliability and temporal jitter of laser-evoked spikes in identified (blue) and unidentified (gray) units recorded in the vM. Note that the identified and unidentified units form two distinct clusters, with high reliability and low jitter for identified units. Dark/light symbols, data during 30/15 Hz laser stimulation. Middle, distribution of delays of laser-evoked spiking for 21 identified GABAergic neurons. Delay is defined as timing of the first spike following each laser pulse. Right, distribution of correlation coefficient between laser-evoked and spontaneous spike waveforms for all 21 identified vM GABAergic neurons. b, Fluorescence image of a coronal section showing the position of an electrolytic lesion at the end of the optrode tract (arrow). Blue, DAPI staining. c, Positions of the 21 identified vM GABAergic neurons from 5 mice. Each dot indicates one neuron. All 20 neurons with recording periods encompassing all three brain states showed maximal firing rates during REM sleep. The wakeful behavior during which the neuron showed the maximal firing rate is color-coded. Black, neurons for which the recording period did not include all wakeful behaviors. Schemes of brain sections adapted from Allen Mouse Brain Atlas (Website: © 2015 Allen Institute for Brain Science. Allen Mouse Brain Atlas [Internet]. Available from: http://mouse.brain-map.org).
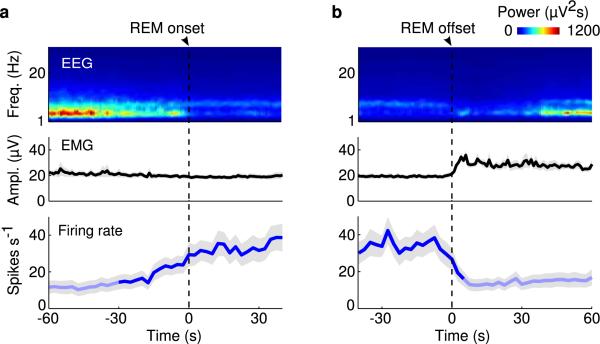
Extended Data Figure 7. Activity of vM GABAergic neurons at REM sleep onset and offset.
a, Mean firing rates of vM GABAergic neurons at REM onset. Shading, ±s.e.m. Dark blue, period in which firing rate was significantly higher than baseline (P<0.05, Wilcoxon signed-rank test); baseline was defined as the average firing rate during the 10 s intervals 60 s before and after REM sleep. b, Mean firing rates at REM offset.
Extended Data Figure 8. Effect of laser stimulation of vM neurons on several wakeful behaviors.
a, Probability of moving (MV), running (RU), eating (ET), and grooming (GR) before, during, and after laser stimulation (20 Hz, 120 s) in GAD2-Cre mice injected with AAV expressing ChR2-eYFP into the vM (n=8 mice). Unclassified behaviors are not shown. Blue bar, period of laser stimulation. Laser stimulation caused a significant increase in eating (P=0.008, Wilcoxon signed-rank test). b, Similar to a, but in control mice expressing eYFP (n=4 mice).
Extended Data Figure 9. Firing rates of unidentified vM neurons.
a, Firing rates of unidentified units in the three brain states. Each line represents data from one neuron. Gray bar represents average over units (n=24). b, Left, relative firing rates of the units across brain states. The firing rates of each unit were normalized by its maximum. Right, normalized firing rates across different wakeful behaviors. c, Mean firing rates of unidentified vM neurons at REM onset. Shading, ±s.e.m. Dark blue, period in which firing rate was significantly higher than baseline (P<0.05, Wilcoxon signed-rank test). d, Mean firing rates of unidentified vM neurons at REM offset.
Extended Data Figure 10. Co-expression of GABA and glycine in vM neurons.
a, Fluorescence image of ChR2-eYFP expressing neurons in the vM of a GAD2-Cre mouse injected with Cre-inducible AAV. b, Immunohistochemical staining for glycine. c, Superposition of eYFP-expression and glycine staining. In total, 94% (273/289) of eYFP-expressing cells were glycine positive (n=3 mice).
Supplementary Material
Acknowledgements
We thank M. Xu for the help with in vivo physiology and M. Bikov and S. Chung for technical assistance, University of North Carolina Virus Core for AAV supply, and T. Kilduff, A. Popescu and J. Cox for helpful discussions. This work was supported by EMBO and HFSP postdoctoral fellowships (to F.W.). All primary histological, electrophysiological, and behavioral data are archived in the Department of Molecular and Cell Biology, University of California, Berkeley.
Footnotes
The authors declare no competing financial interests. Readers are welcome to comment on the online version of this article at www.nature.com/nature.
Author Contributions F.W. and Y.D. conceived and designed the experiments. F.W. performed all optogenetic stimulation experiments and optrode recordings. S.C. performed a subset of pharmacogenetic experiments and fluorescence microscopy. K.T.B. and L.L. provided viral reagents for rabies-mediated transsynaptic experiments. F.W. and Y.D. wrote the manuscript, and all authors participated in the revision of the manuscript.
Online Content Methods, along with any additional Extended Data display items and Source Data, are available in the online version of the paper; references unique to these sections appear only in the online paper.
Supplementary Information is available in the online version of the paper at www.nature.com/nature.
References
- 1.Aserinsky E, Kleitman N. Regularly occurring periods of eye motility, and concomitant phenomena, during sleep. Science. 1953;118:273–274. doi: 10.1126/science.118.3062.273. [DOI] [PubMed] [Google Scholar]
- 2.Jouvet M. Research on the neural structures and responsible mechanisms in different phases of physiological sleep. Arch Ital Biol. 1962;100:125–206. [PubMed] [Google Scholar]
- 3.Dement W. The occurrence of low voltage, fast, electroencephalogram patterns during behavioral sleep in the cat. Electroencephalogr Clin Neurophysiol. 1958;10:291–296. doi: 10.1016/0013-4694(58)90037-3. [DOI] [PubMed] [Google Scholar]
- 4.Hobson JA, McCarley RW, Wyzinski PW. Sleep cycle oscillation: reciprocal discharge by two brainstem neuronal groups. Science. 1975;189:55–58. doi: 10.1126/science.1094539. [DOI] [PubMed] [Google Scholar]
- 5.Boissard R, Fort P, Gervasoni D, Barbagli B, Luppi PH. Localization of the GABAergic and non-GABAergic neurons projecting to the sublaterodorsal nucleus and potentially gating paradoxical sleep onset. Eur J Neurosci. 2003;18:1627–1639. doi: 10.1046/j.1460-9568.2003.02861.x. [DOI] [PubMed] [Google Scholar]
- 6.Clement O, Sapin E, Berod A, Fort P, Luppi PH. Evidence that neurons of the sublaterodorsal tegmental nucleus triggering paradoxical (REM) sleep are glutamatergic. Sleep. 2011;34:419–423. doi: 10.1093/sleep/34.4.419. [DOI] [PMC free article] [PubMed] [Google Scholar]
- 7.Lu J, Sherman D, Devor M, Saper CB. A putative flip-flop switch for control of REM sleep. Nature. 2006;441:589–594. doi: 10.1038/nature04767. [DOI] [PubMed] [Google Scholar]
- 8.Van Dort CJ, et al. Optogenetic activation of cholinergic neurons in the PPT or LDT induces REM sleep. Proc Natl Acad Sci USA. 2015;112:584–589. doi: 10.1073/pnas.1423136112. [DOI] [PMC free article] [PubMed] [Google Scholar]
- 9.Siegel JM, Wheeler RL, McGinty DJ. Activity of medullary reticular formation neurons in the unrestrained cat during waking and sleep. Brain Res. 1979;179:49–60. doi: 10.1016/0006-8993(79)90488-8. [DOI] [PMC free article] [PubMed] [Google Scholar]
- 10.Sakai K, Kanamori N, Jouvet M. Neuronal activity specific to paradoxical sleep in the bulbar reticular formation in the unrestrained cat. C R Seances Acad Sci D. 1979;289:557–561. [PubMed] [Google Scholar]
- 11.Maloney KJ, Mainville L, Jones BE. c-Fos expression in GABAergic, serotonergic, and other neurons of the pontomedullary reticular formation and raphe after paradoxical sleep deprivation and recovery. J Neurosci. 2000;20:4669–4679. doi: 10.1523/JNEUROSCI.20-12-04669.2000. [DOI] [PMC free article] [PubMed] [Google Scholar]
- 12.Sapin E, et al. Localization of the brainstem GABAergic neurons controlling paradoxical (REM) sleep. PLoS One. 2009;4:e4272. doi: 10.1371/journal.pone.0004272. [DOI] [PMC free article] [PubMed] [Google Scholar]
- 13.Sirieix C, Gervasoni D, Luppi PH, Leger L. Role of the lateral paragigantocellular nucleus in the network of paradoxical (REM) sleep: an electrophysiological and anatomical study in the rat. PLoS One. 2012;7:e28724. doi: 10.1371/journal.pone.0028724. [DOI] [PMC free article] [PubMed] [Google Scholar]
- 14.Jego S, et al. Optogenetic identification of a rapid eye movement sleep modulatory circuit in the hypothalamus. Nat Neurosci. 2013;16:1637–1643. doi: 10.1038/nn.3522. [DOI] [PMC free article] [PubMed] [Google Scholar]
- 15.Armbruster BN, Li X, Pausch MH, Herlitze S, Roth BL. Evolving the lock to fit the key to create a family of G protein-coupled receptors potently activated by an inert ligand. Proc Natl Acad Sci U S A. 2007;104:5163–5168. doi: 10.1073/pnas.0700293104. [DOI] [PMC free article] [PubMed] [Google Scholar]
- 16.Kovacs KJ. c-Fos as a transcription factor: a stressful (re)view from a functional map. Neurochem Int. 1998;33:287–297. doi: 10.1016/s0197-0186(98)00023-0. [DOI] [PubMed] [Google Scholar]
- 17.Holmes CJ, Jones BE. Importance of cholinergic, GABAergic, serotonergic and other neurons in the medial medullary reticular formation for sleep-wake states studied by cytotoxic lesions in the cat. Neuroscience. 1994;62:1179–1200. doi: 10.1016/0306-4522(94)90352-2. [DOI] [PubMed] [Google Scholar]
- 18.Aston-Jones G, Ennis M, Pieribone VA, Nickell WT, Shipley MT. The brain nucleus locus coeruleus: restricted afferent control of a broad efferent network. Science. 1986;234:734–737. doi: 10.1126/science.3775363. [DOI] [PubMed] [Google Scholar]
- 19.Aston-Jones G, Bloom FE. Activity of norepinephrine-containing locus coeruleus neurons in behaving rats anticipates fluctuations in the sleep-waking cycle. J Neurosci. 1981;1:876–886. doi: 10.1523/JNEUROSCI.01-08-00876.1981. [DOI] [PMC free article] [PubMed] [Google Scholar]
- 20.Loewy AD, Wallach JH, McKellar S. Efferent connections of the ventral medulla oblongata in the rat. Brain Res. 1981;228:63–80. doi: 10.1016/0165-0173(81)90012-6. [DOI] [PubMed] [Google Scholar]
- 21.Magoun HW, Rhines R. An inhibitory mechanism in the bulbar reticular formation. J Neurophysiol. 1946;9:165–171. doi: 10.1152/jn.1946.9.3.165. [DOI] [PubMed] [Google Scholar]
- 22.Schenkel E, Siegel JM. REM sleep without atonia after lesions of the medial medulla. Neurosci Lett. 1989;98:159–165. doi: 10.1016/0304-3940(89)90503-x. [DOI] [PMC free article] [PubMed] [Google Scholar]
- 23.Vanni-Mercier G, Sakai K, Lin JS, Jouvet M. Carbachol microinjections in the mediodorsal pontine tegmentum are unable to induce paradoxical sleep after caudal pontine and prebulbar transections in the cat. Neurosci Lett. 1991;130:41–45. doi: 10.1016/0304-3940(91)90222-f. [DOI] [PubMed] [Google Scholar]
- 24.Webster HH, Friedman L, Jones BE. Modification of paradoxical sleep following transections of the reticular formation at the pontomedullary junction. Sleep. 1986;9:1–23. doi: 10.1093/sleep/9.1.1. [DOI] [PubMed] [Google Scholar]
- 25.Kohyama J, Lai YY, Siegel JM. Inactivation of the pons blocks medullary-induced muscle tone suppression in the decerebrate cat. Sleep. 1998;21:695–699. doi: 10.1093/sleep/21.7.695. [DOI] [PMC free article] [PubMed] [Google Scholar]
- 26.Siegel JM, Nienhuis R, Tomaszewski KS. Rostral brainstem contributes to medullary inhibition of muscle tone. Brain Res. 1983;268:344–348. doi: 10.1016/0006-8993(83)90501-2. [DOI] [PMC free article] [PubMed] [Google Scholar]
- 27.Carter ME, et al. Tuning arousal with optogenetic modulation of locus coeruleus neurons. Nat Neurosci. 2010;13:1526–1533. doi: 10.1038/nn.2682. [DOI] [PMC free article] [PubMed] [Google Scholar]
- 28.White SR, Fung SJ, Barnes CD. Norepinephrine effects on spinal motoneurons. Prog Brain Res. 1991;88:343–350. doi: 10.1016/s0079-6123(08)63821-2. [DOI] [PubMed] [Google Scholar]
- 29.Kaur S, Saxena RN, Mallick BN. GABAergic neurons in prepositus hypoglossi regulate REM sleep by its action on locus coeruleus in freely moving rats. Synapse. 2001;42:141–150. doi: 10.1002/syn.1109. [DOI] [PubMed] [Google Scholar]
- 30.Taheri S, Zeitzer JM, Mignot E. The role of hypocretins (orexins) in sleep regulation and narcolepsy. Annu Rev Neurosci. 2002;25:283–313. doi: 10.1146/annurev.neuro.25.112701.142826. [DOI] [PubMed] [Google Scholar]
- 31.Miyamichi K, et al. Dissecting local circuits: parvalbumin interneurons underlie broad feedback control of olfactory bulb output. Neuron. 2013;80:1232–1245. doi: 10.1016/j.neuron.2013.08.027. [DOI] [PMC free article] [PubMed] [Google Scholar]
- 32.Anikeeva P, et al. Optetrode: a multichannel readout for optogenetic control in freely moving mice. Nat Neurosci. 2012;15:163–170. doi: 10.1038/nn.2992. [DOI] [PMC free article] [PubMed] [Google Scholar]
- 33.Schmitzer-Torbert N, Jackson J, Henze D, Harris K, Redish AD. Quantitative measures of cluster quality for use in extracellular recordings. Neuroscience. 2005;131:1–11. doi: 10.1016/j.neuroscience.2004.09.066. [DOI] [PubMed] [Google Scholar]
Associated Data
This section collects any data citations, data availability statements, or supplementary materials included in this article.


