

Abstract
We have previously shown that, in human and zebrafish, hypomorphic mutations of the gene encoding the retinoic acid (RA)-metabolizing enzyme Cyp26b1 result in coronal craniosynostosis, caused by an RA-induced premature transitioning of suture osteoblasts to preosteocytes, inducing ectopic mineralization of the suture's osteoid matrix. In addition, we showed that human CYP26B1 null patients have more severe and seemingly opposite skull defects, characterized by smaller and fragmented calvaria, but the cellular basis of these defects remained largely unclear. Here, by treating juvenile zebrafish with exogenous RA or a chemical Cyp26 inhibitor in the presence or absence of osteogenic cells or bone-resorbing osteoclasts, we demonstrate that both reduced calvarial size and calvarial fragmentation are also caused by RA-induced premature osteoblast-to-preosteocyte transitioning. During calvarial growth, the resulting osteoblast deprival leads to decreased osteoid production and thereby smaller and thinner calvaria, whereas calvarial fragmentation is caused by increased osteoclast stimulation through the gained preosteocytes. Together, our data demonstrate that RA-induced osteoblast-to-preosteocyte transitioning has multiple effects on developing bone in Cyp26b1 mutants, ranging from gain to loss of bone, depending on the allelic strength, the developmental stage and the cellular context.
KEY WORDS: Bone development, Diversity, Retinoic acid, Zebrafish
Summary: Increased RA levels in developing zebrafish have multiple effects on skull formation, ranging from gain to loss of bone, and depending on allelic strength, developmental stage and cellular context.
INTRODUCTION
Retinoic acid (RA) is the active metabolite of vitamin A (retinol) and has multiple roles during development (Rhinn and Dolle, 2012; Samarut et al., 2014). It is synthesized from retinol in two successive oxidation steps catalyzed by alcohol dehydrogenases (ADHs) and (rate-limiting) retinaldehyde dehydrogenases (RALDHs), respectively. In target cells, RA binds to its nuclear retinoic acid (RAR)/retinoid X (RXR) receptors to participate in the transcriptional regulation of target genes. RA inactivation is promoted by Cyp26 enzymes (Cyp26a1, Cyp26b1 and Cyp26c1), members of the cytochrome P450 family of monooxygenases that oxidize RA to its biologically inactive 4-hydroxy- and 4-oxo-metabolites. This concerted action of RALDHs and Cyp26 enzymes assures differential RA distribution in vivo.
Exposure to RA during ontogeny has severe teratogenic effects on bone development (Lammer et al., 1985; Soprano and Soprano, 1995). Also, in adult animals and humans, an excess of retinoids or hypervitaminosis A can reduce bone mineral density and cause an increased risk of spontaneous fractures (Conaway et al., 2013). Numerous studies have aimed to understand the cellular basis of these phenomena by investigating the effect of RA on bone-forming osteoblasts, derivatives of mesenchymal stem cells that can further differentiate to osteocytes (Dallas and Bonewald, 2010; Franz-Odendaal et al., 2006), and on bone-resorbing osteoclasts, derivates of the myeloid cell lineage most closely related to macrophages.
However, the current available data provide a very conflicting view on the role of RA during bone development and remodeling (Conaway et al., 2013). In fact, in vitro studies have provided evidence for both inhibitory and stimulatory effects of RA on both osteoclast (Balkan et al., 2011; Chiba et al., 1996) and osteoblast (Cohen-Tanugi and Forest, 1998; Iba et al., 2001; Skillington et al., 2002; Song et al., 2005) differentiation, depending on the culture conditions and the cell lines used.
In vivo, where osteogenic cells and osteoclasts co-exist, contrary effects observed in cell cultures could nevertheless have a net impact on bone development when one of them is dominant. In addition, both cell types directly communicate with each other (Kobayashi et al., 2009; Matsuo and Irie, 2008; Sims and Martin, 2014; Zhao et al., 2006), opening the possibility of additional RA-induced indirect effects of one cell type on the other. Therefore, to dissect the relevant cellular targets and mechanisms underlying the RA-induced bone defects in vivo, it would be desirable to compare the defects in individuals containing both or lacking either of the two cell types. Here, we used such an approach to elucidate the cellular and molecular basis of the bone defects caused by compromised activity of the RA-catabolizing enzyme Cyp26b1.
Human patients with a partial or complete loss of CYP26B1 function display severe defects in the calvarial plates of the skull roof, including a premature fusion of the coronal sutures (craniosynostosis) between the frontal and parietal plates in the hypomorphs, and calvarial hypoplasia, intercalvarial patencies and calvarial fragmentation in the amorph (Laue et al., 2011). Further studies with zebrafish cyp26b1 hypomorphic mutants led to the elaboration of a model, proposing that excess of RA induces a premature transition of osteoblasts to preosteocytes within the coronal suture. Whereas osteoblasts ensure bone matrix (osteoid) production, preosteocytes stimulate its mineralization (Dallas and Bonewald, 2010; Franz-Odendaal et al., 2006). Accordingly, the premature accumulation of preosteocytes within the suture of the hypomorphs leads to ectopic mineralization of the sutural matrix, hence the seeming hyperossification (Laue et al., 2011). However, it remains unclear to what extent this mechanism might also contribute to the calvarial hypoplasia and fragmentation displayed by the human CYP26B1 amorph.
Comparing juvenile wild-type zebrafish with mutants lacking osteoclasts and with transgenics after osteoblast ablation, we show that for both phenotypic traits, osteoblasts are the prime targets of increased RA signaling, to which they respond by premature differentiation to preosteocytes. However, it is the resulting loss of osteoblasts that causes calvarial hypoplasia, whereas calvarial fragmentation is due to enhanced activation of osteoclasts by the gained preosteocytes, which as in mouse (Nakashima et al., 2011; Xiong et al., 2011) are much more potent osteoclast stimulators than are osteoblasts. Together, this demonstrates how one and the same primary cellular effect of RA can cause a plethora of different and contrary defects during bone development, providing a common mechanism underlying the complex phenotype caused by Cyp26b1 deficiency in fish and humans.
RESULTS
Exposure to exogenous RA or Cyp26 inhibitor leads to reduced horizontal and vertical growth of calvaria
At birth, the human brain is already almost completely covered by bony calvarial plates (Sadler and Langman, 2010). In zebrafish, by contrast, calvarial development only starts at ∼3 weeks of age (standard length=7 mm/SL7), which by most other criteria corresponds to much later/postnatal stages in mammals (Parichy et al., 2009). At SL8, calvaria can be seen at anterior, posterior and lateral sides of the head from where they grow toward its vertex (Fig. 1A). At SL10-11 (≈4 weeks), the two frontal plates have met in the midline, and the interfrontal suture has been formed (Fig. 1B). The coronal sutures between the frontal and parietal plates start to form at SL12-13 (≈6 weeks), but, at this stage, no sagittal suture has formed yet, with a wide gap between the two parietal plates (Fig. 1C).
Fig. 1.

Treatment with RA or the Cyp26 inhibitor R115866 leads to impaired horizontal and vertical growth of calvaria. (A-C) Alizarin Red (AR) staining of calvarial pates of untreated juvenile wild-type zebrafish at the indicated standard length (SL); dorsal view of head; anterior to the right. For details, see text. (D-F) Magnified dorsal view of central head region of SL8-9 fish treated with DMSO (D), RA (E) or R115866 (rambazole; F) for 7 days, after consecutive in vivo AR staining (red) before and calcein staining (green) after the treatment. The width of the green-only region is indicated by double-headed arrows. Arrowheads in D,E mark the position of the virtual transverse projections shown in Fig. S1A,B; asterisks in E,F mark diffuse and weak green staining in patent regions of the RA- and R115866-treated fish, but not in the control, most likely representing ectopic ossification of col1a2-encoded collagen in the overlying dermis (Le Guellec et al., 2004; see Fig. S1 and Discussion). (G,H) Transverse sections through frontal plate of SL8-9 fish treated with DMSO (G) or RA (H), in vivo stained with AR before and with DAPI after the treatment. Positions of osteogenic fronts before the treatment are indicated by regular arrows (revealed by the border of the AR-positive stripes); thicknesses of the frontal plates are indicated by double-headed arrows. Note the preferential vertical growth at the inner surface of the calvaria (larger distance between AR-positive stripe of ‘old’ bone and ventral surface of calvaria). (I,J) Quantification of reduced horizontal and vertical growth, expressed as percentage of added area (I) or width (J) of DMSO-treated controls. DMSO: n=7; RA: n=6; rambazol: n=4). Mean values±s.d. are shown. ****P<0.0001. cs, coronal suture; fp, frontal plate; ifs, interfrontal suture; of, osteogenic front; pp, parietal plate; ss, sagittal suture.
Owing to this relatively late calvarial development, zebrafish cyp26b1 null mutants (dolphin), which die at ∼10 days of age (Laue et al., 2008; Spoorendonk et al., 2008), could not be used as an animal model to study the skull defects of human CYP26B1 amorphs. Instead, we treated juvenile wild-type zebrafish with RA or the Cyp26 inhibitor R115866 (rambazole) to simulate the elevated endogenous RA levels caused by Cyp26b1 deficiency. To address the calvarial hypoplasia phenotype, SL8 fish were exposed to the drugs for 7 days, and mineralized bone that was newly formed during that time was assessed by consecutive in vivo labeling directly before (with Alizarin Red) and after (with calcein) the treatments (Fig. 1D-F). At 7 days post treatment (dpt), both RA- and R115866-treated fish displayed a significant reduction of newly formed, green-only (calcein labeled) bone at the calvarial osteogenic fronts compared with their DMSO controls (Fig. 1I). Moreover, sections at comparable levels revealed that calvaria of RA-treated fish were significantly thinner (Fig. 1G,H,J). Together, these data indicate that RA has a negative, and Cyp26 a positive, effect on both the horizontal and the vertical growth of calvarial plates.
cyp26b1 is expressed in bone-lining cells, and the RALDH gene aldh1a2 in meningeal cells underneath the calvaria
To investigate whether cyp26b1 and RALDH genes are expressed in a pattern consistent with the calvarial growth impairment caused by the interference with Cyp26 activity, we carried out in situ hybridization on untreated fish (Figs S2, S3). cyp26b1 was expressed in bone-lining cells, consistent with its formerly reported expression in osteogenic cells during larval stages (Laue et al., 2008; Spoorendonk et al., 2008). However, whereas at the osteogenic fronts, cyp26b1 expression was sparse and confined to only a few cells both at the inner and outer side of the calvaria (Fig. S2A,C), its expression pattern in more central parts of the plates was more homogeneous, but largely restricted to the outer surface of the plates (Fig. S2B,D). Of the three RALDH genes (aldh1a2, aldh1a3, aldh8a1; Begemann et al., 2001; Liang et al., 2008; Pittlik et al., 2008), only aldh1a2 showed detectable skull expression, which was largely restricted to regions underneath the calvaria (Fig. S3A,B; data not shown), in line with the preferential addition of new material to the inner calvarial surface during vertical growth (Fig. 1G,H). Further analyses of aldh1a2:aldh1a2-GFP transgenic fish (Pittlik and Begemann, 2012) with the osteogenic marker Zns5 (Fig. S3C-G) revealed that the aldh1a2-positive cells are positioned within the meninges, consistent with results obtained in the mouse (Siegenthaler et al., 2009). In addition, meningeal aldh1a2 expression levels were highest in regions close to the osteogenic fronts, but lower in regions underlying more central parts of the calvaria, where plates were already thicker (Fig. S3C-G). In conclusion, both cyp26b1 and aldh1a2 displayed differential expression in their respective cell types, with meningeal aldh1a2 expression correlating with ongoing, and osteogenic cyp26b1 expression with ceased or reduced bone growth.
RA treatment leads to premature osteoblast-to-preosteocyte transitioning at calvarial osteogenic fronts
To assess whether the observed reduction of calvarial growth upon interference with Cyp26 function reflects a decreased activity of osteoblasts, we further analyzed the numbers as well as the differentiation and activity status of osteogenic cells at the osteogenic fronts of DMSO- and RA-treated fish. Performing a series of double stainings, we found that the osx:NTR-mCherry transgene, using the promoter of the osterix gene (osx; also called sp7), labels osteogenic cells of all differentiation stages from osteoblast progenitors to osteocytes (Fig. S4). Accordingly, osx:NTRmCherry fluorescence, as well as Zns5 immunofluorescence, revealed unaltered numbers of osteogenic cells at the osteogenic fronts of RA-treated fish (Fig. 2A-E). However, particularly at the tip of the calvaria, osteogenic cells had changed their shape, which was roundish and globular in the DMSO controls, but flat and elongated after the RA treatment (Fig. 2A,B), similar to the changes formerly observed for osteogenic cells around the coronal sutures of zebrafish cyp26b1 hypomorphs (Laue et al., 2011).
Fig. 2.

RA induces premature osteoblast-to-preosteocyte transitioning at osteogenic fronts. (A-D,F-R) Transverse sections through the osteogenic front region of a frontal calvarial plate of SL8-9 wild-type fish treated as indicated. (A,B) The number of osx-expressing cells assessed in tg(osx:NTR-mCherry) is unaltered upon RA treatment. However, at the osteogenic front, cells lose their globular shape (see insets for magnification). (C,D) Immunofluorescence with Zns5 antibody, counterstained with DAPI, reveals unaltered numbers and distributions of osteogenic cells upon RA treatment. (E) Quantification of osx- and Zns5-positive cells in corresponding regions at the osteogenic front. DMSO: n=8; RA: n=10. Mean values±s.d. are shown. (F-I) In situ hybridizations, revealing strongly impaired expression of the collagen genes col1a1 (F,G) and col10a1 (H,I) in bone-lining cells of RA-treated fish. In F,G, H2O2 treatment had been omitted, leaving the melanocytes (mc) of the meninges (Goldgeier et al., 1984) visible as black cells. (J,K) Expression of bglap as assessed in tg(bglap:GFP) is downregulated in the RA-treated samples. In K, the borders of the calvarial plate are outlined. (L-O) In situ hybridizations, revealing increased expression of spp1 (L,M) and the preosteocyte marker phex (N,O) in bone-lining cells of the RA-treated fish. (P) qRT-PCR analyses of isolated calvaria: the RA-treated sample displays a highly significant downregulation of the osteoblast markers bglap and col10a1, and a highly significant upregulation of the preosteocyte markers phex and spp1, whereas ankha and ankhb, other mammalian osteocyte markers (Franz-Odendaal et al., 2006; Laue et al., 2011), were not increased or only moderately increased. (Q,R) Double fluorescence in situ hybridization revealing coexpression of spp1 (red; single channel in Q) and phex (green; merged image in R; counterstained with DAPI in white) in bone-lining cells of RA-treated fish. **P<0.01, ***P<0.001, ****P<0.0001, ns, not significant.
Moreover, genes encoding collagenous components of the osteoid matrix, such as col1a1 (Fig. 2F,G) and col10a1 (Fig. 2H,I), which in control fish were expressed in bone-lining osteoblasts at the inner and outer calvarial surfaces, were downregulated or silenced upon RA treatment. Similar reductions were observed for the osteoblast marker Osteocalcin, also called Bone gamma-carboxyglutamate (gla) protein (Bglap), as assessed in the transgenic line bglap:GFP (Vanoevelen et al., 2011) (Fig. 2J,K), and as confirmed by qRT-PCR analyses of isolated calvaria (Fig. 2P).
By contrast, spp1 (Laue et al., 2008) and phex (Laue et al., 2011) expression was upregulated both in the qRT-PCR analyses (Fig. 2P), and in in situ hybridizations (Fig. 2L-O). Whereas the phosphate-regulating endopeptidase homolog phex has been reported to be expressed by mammalian pre-osteocytic cells, regulating phosphate homeostasis during bone matrix mineralization (Dallas and Bonewald, 2010; Franz-Odendaal et al., 2006), spp1 (secreted phosphoprotein 1) encodes a bone matrix component also known as Osteopontin (Opn), which has been reported as a product of osteoblasts (Laue et al., 2008; Weinreb et al., 1990). However, performing spp1/phex double in situ hybridization, we found them to be co-expressed at the osteogenic fronts of RA-treated calvaria (Fig. 2Q,R), indicating that spp1 is rather a marker for preosteocytes (see Discussion).
In summary, these results show that upon RA treatment, osteoblasts at the osteogenic front undergo premature transition to preosteocytes, compromising their capability to produce osteoid matrix, and that genes involved in matrix mineralization are upregulated.
Exposure to exogenous RA or Cyp26 inhibitor leads to calvarial fragmentation
In addition to reduced calvarial growth, juvenile zebrafish exposed to RA or the Cyp26 inhibitor R115866 displayed calvarial fragmentation (Fig. 3). Fragmentation was most prominent in regions above the cartilaginous epiphyseal bar (Kague et al., 2012) (Fig. S5A-D), which had been Alizarin Red-positive prior to the treatment, indicating an active loss of mineralized matrix (Fig. 3A-C). When calcein staining was performed after the RA treatment, the regions around the holes appeared more strongly stained than newly formed ossified bone at the osteogenic fronts (Fig. 3D,E), pointing to a higher degree of calcification.
Fig. 3.

Treatment with RA or the Cyp26 inhibitor R115866 leads to calvarial bone fragmentation and ectopic osteoclast activation. (A-C) AR staining of SL9-10 fish before treatment (A) and after 7 days of treatment with RA (B) or R115866 (Ramb; C); dorsal view of head region. White arrows point to similar areas at the level of the epiphyseal bar (compare with Fig. S5B), which is continuous before (A), but fragmented after (B,C) the treatment. (D,E) Consecutive in vivo AR staining directly before, and calcein (green) staining after the treatment. The newly synthesized matrix (green) at the sites of fragmentation in the RA-treated fish shows signs of hypermineralization (E; more intense green), in comparison with the newly synthesized matrix at the osteogenic front (of) of the DMSO-treated control (D). (F-I) In vivo AR staining (F,G), followed by enzymatic TRAP staining (H,I); epiphyseal bar region, anterior to the top. Ectopic TRAP is exclusively present in fragmented areas of RA-treated sample (G,I). (J-Q) Transverse sections through epiphyseal bar region showing in situ hybridization for mRNA of the TRAP-encoding gene acp5a (J,K) or enzymatic TRAP staining (L-Q). (J-M) RA-treated fish display ectopic acp5a expression and TRAP activity. (N-Q) Increased TRAP activity is displayed in corresponding regions of fish treated with the Cyp26 inhibitor R115866 (Ramb; O) and in an sst mutant, homozygous for a hypomorphic cyp26b1 mutation (Q). At this level, the calvarial plate of the sst mutant is much thinner than in the wild-type sibling (see Fig. S5E,F for magnifications). (R) qRT-PCR analysis of isolated calvarial plates: the expression of marker genes of active osteoclasts (acp5a, ctsk and rank) is significantly upregulated in RA-treated samples compared with DMSO controls. ***P<0.001, ****P<0.0001.
Consistent with the loss of formerly present bony material, the Alizarin Red-negative calvarial holes of RA-treated samples displayed strong tartrate-resistant acid phosphate (TRAP) activity and strong expression of the TRAP-encoding gene acp5a, both indicators of active bone-resorbing osteoclasts that were virtually absent in the corresponding regions of control fish (Fig. 3F-M). Ectopic, although slightly weaker, TRAP activity in the same region was also observed upon R115866 treatment of wild-type fish (Fig. 3N,O) and in sst−/− mutants (Fig. 3P,Q), which display a partial loss of Cyp26b1 activity (Laue et al., 2011) and a significant thinning, rather than a complete resorption, of calvarial plates above the epiphyseal bar (Fig. S5E,F). Increased osteoclastic activity upon RA treatment was further confirmed by qRT-PCR analysis, revealing a significant upregulation of the osteoclast marker genes acp5a (encoding TRAP), ctsk (encoding the protease Cathepsin K) and rank (encoding the RANKL receptor; see below) (Fig. 3R). Together, these data indicate that both exogenous RA application as well as inhibition of endogenous RA inactivation leads to ectopic, but spatially confined, osteoclast activation, which temporally and spatially coincides with calvarial fragmentation.
Both osteoclasts and osteogenic cells are required for RA-induced calvarial fragmentation
To assess further whether osteoclasts are required for RA-induced calvarial fragmentation, pfeffer (pfe) mutant fish in the receptor tyrosine kinase colony stimulating factor 1 receptor a (csf1ra) gene, also named c-fms (Maderspacher and Nüsslein-Volhard, 2003), which have been reported to lack osteoclasts (Chatani et al., 2011), were treated with RA. Upon RA treatment, pfe mutants, in contrast to wild-type fish, lacked ectopic TRAP-positive areas above the epiphyseal bar (Fig. 4C-F) and displayed continuous and unfragmented frontal plates (Fig. 4A,B), demonstrating the requirement of osteoclasts for RA-induced calvarial fragmentation.
Fig. 4.

Both osteoclasts and osteogenic cells are required to mediate RA-induced calvarial fragmentation. (A,B) AR staining of SL9-10 wild-type sibling (A; n=7/7) and pfe mutant (B; n=9/9) after 7 days of RA treatment. Arrows point to calvarial fragmentations in the wild type and corresponding regions in pfe mutant, which lacks fragmentation. (C-F) TRAP labeling of transverse sections through epiphyseal bar (eb) region, where RA-calvarial fragmentation occurs (see Fig. S4B). In comparison with wild-type siblings (D; n=3/3), RA treatment fails to induce TRAP activity in pfe mutant (F; n=4/4), with staining comparable to the untreated WT sibling (C; n=3/3) or mutant (E; n=3/3). (G-J) Calcein staining of osx:NTRmcherry transgenic fish after MTZ treatment (I,J) for osteogenic cell ablation, and/or RA (H,J) or DMSO (G,I) treatment. After ablation of osteogenic cells (J; n=7/7), RA fails to induce calvarial fragmentation seen in the RA only-treated transgenic fish (H; n=5/5). Also, pure ablation of osteogenic cells fails to cause calvarial fragmentation (I; n=6/6). Arrows point to calvarial fragmentations in the RA-treated, non-ablated transgenic, and corresponding regions of the other specimens lacking fragmentation. (K) Comparative qRT-PCR analysis of isolated calvarial plates from SL11-12 sibling fish containing (−MTZ) or lacking (+MTZ) osteogenic cells, and treated (RA) or not treated (DMSO) with RA. Columns with same superscript letter (a,b,c) are not significantly different (P>0.05). In the absence of osteogenic cells (MTZ+RA), RA fails to significantly induce expression of phex and rankl (MTZ+RA versus MTZ+DMSO), whereas spp1 is much more weakly induced (1.8× in MTZ+RA versus MTZ+DMSO, compared with 6.6× in RA versus DMSO). The remaining spp1 induction most likely reflects expression in other cell types (compare with Fig. 6F and see Discussion). Furthermore, RA-treated fish containing osteogenic cells (RA) display 5.5-fold higher expression levels of the direct osteoclastogenesis effector rankl compared with RA-treated fish lacking osteogenic cells (MTZ+RA). mc, melanocytes.
During normal bone remodeling, osteoclasts are under the control of osteogenic cells (osteoblasts and osteocytes), which can stimulate the recruitment and/or activation of osteoclasts. One crucial stimulant produced by osteogenic cells is RANKL (Tnfsf11 – Zebrafish Information Network), a secreted or cell surface-tethered cytokine that binds to RANK receptors (Tnfrsf1b – ZFIN) at the cell surface of the osteoclasts (Kobayashi et al., 2009; Matsuo and Irie, 2008). In addition, preosteocytes also produce Spp1 (see above), a component of the bone matrix that can serve as a ligand for specific integrin receptors at the cell surface of osteoclasts, thereby promoting ruffled border formation and bone resorption (Reinholt et al., 1990; Teitelbaum, 2000, 2011).
To assess whether osteoclast-mediated skull fragmentation requires osteoclast stimulation by osteogenic cells, the effect of RA was assessed in the absence of the latter, using transgenic osx:NTRmCherry fish in which osx-positive osteogenic cells of all differentiation stages (Fig. S4) were ablated in a temporally controlled manner by application of the prodrug and nitroreductase (NTR) substrate metronidazole (MTZ) (Singh et al., 2012) prior to and during the entire RA/DMSO treatment. In parallel, fish were treated with DMSO or RA only as a control for the efficiency of the RA treatment. After MTZ treatment in combination with DMSO, very few (<5%) mCherry-positive cells were detectable (Fig. S6A). In addition, the expression levels of the osteoblast markers bglap, col1a1 and col10a1 were several-fold reduced in qRT-PCR analyses (Fig. S6B) and col1a1 expression was undetectable by in situ hybridization (Fig. S6C,D). Furthermore, calvarial growth ceased completely (Fig. S6E,F). Together, these data indicate that osteogenic (osx-positive) cells had been efficiently ablated. However, this treatment did not lead to skull fragmentation (Fig. 4I), confirming that the fragmentizing effect of RA on wild-type fish (Fig. 4H) is not due to an inhibition of de novo bone formation. Moreover, when combined with osteogenic cell ablation, RA treatment failed to cause calvarial fragmentation (Fig. 4J), and the osteoblast and preosteocyte markers such as bglap and phex showed the expected unresponsiveness to RA in qRT-PCR analyses (Fig. 4K). In addition, the osteoclast stimulants RANKL and Spp1, which were significantly induced upon RA treatment of wild-type fish, were unresponsive or showed a much weaker response to RA when osteogenic cells were absent (Fig. 4K). Together, this indicates that osteogenic cells are required for RA-induced and osteoclast-dependent bone resorption and calvarial fragmentation, and suggests that it might be RA stimulation of osteogenic cells that initiates osteoclastic bone resportion.
RA treatment leads to premature osteoblast-to-preosteocyte transitioning at sites of calvarial fragmentation
To study more directly whether, similarly to the RA effect on osteogenic cells at the osteogenic fronts (Fig. 2), RA treatment leads to premature osteoblast-to-preosteocyte transitioning at sites of calvarial fragmentation, osteogenic cells of this region were stained with the respective markers. The number of cells positive for the pan-osteogenic cell marker osx appeared unchanged upon RA treatment (Fig. 5A,B). However, the expression of col1a1 and bglap, markers of active osteoblasts, was strongly decreased (Fig. 5C-F), whereas the expression of spp1 and phex, markers for preosteocytes, was strongly increased upon RA treatment (Fig. 5G-J). Double labeling with osx further confirmed that the phex upregulation occurred in osteogenic cells (Fig. 5K-N). Strikingly, this effect of RA was most prominent in regions above the epiphyseal bar, where calvarial fragmentation occurred, whereas in more remote regions of the calvaria, osteogenic marker gene expression was much less affected. Together, these data demonstrate that both at the osteogenic front, where RA leads to decreased bone growth, and above the epiphyseal bar, where RA leads to bone resorption, osteoblasts display a premature transition to preosteocytes.
Fig. 5.
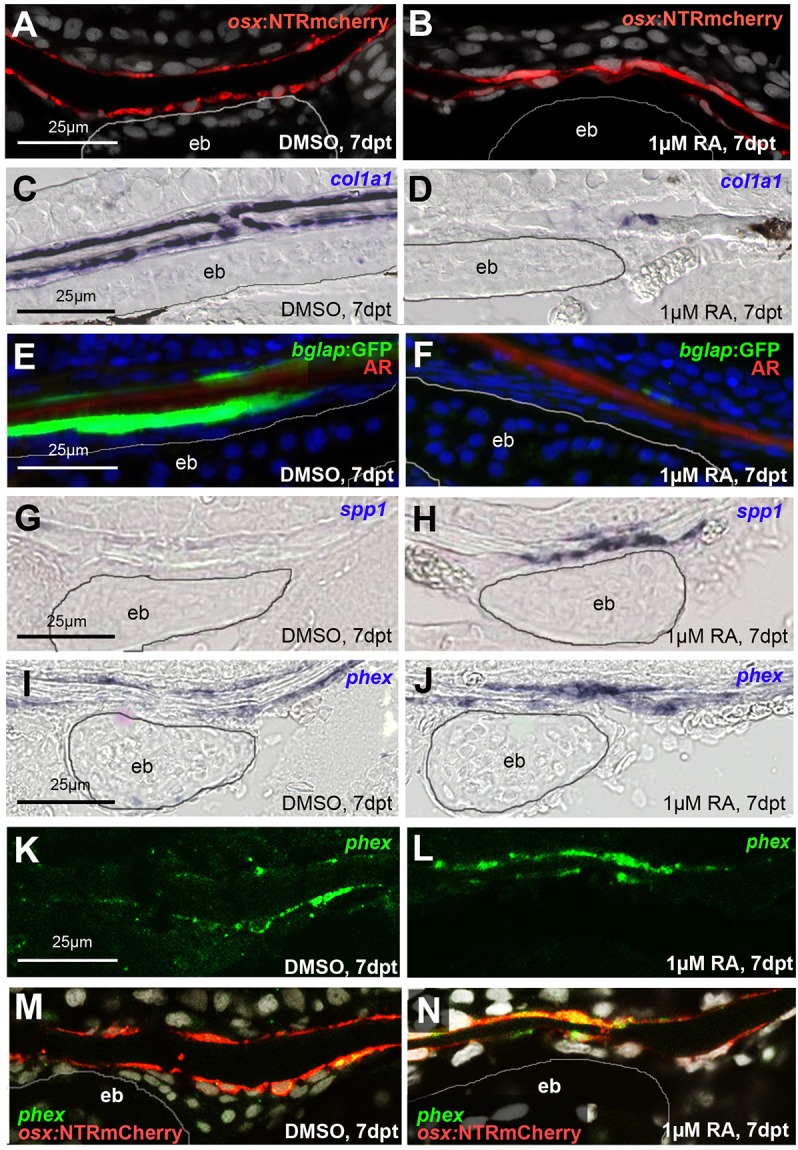
RA induces premature osteoblast-to-preosteocyte transitioning at calvarial fragmentation sites. A,B,G-N show sagittal, and C-F show transverse sections through the fragmentation sites above the epiphyseal bar (eb; outlined) of the frontal plate of SL9-10 wild-type fish treated as indicated. (A,B) The number of osx-expressing cells, as assessed in tg(osx:NTR-mCherry), is unaltered upon RA treatment (9.0±1.26 cells in defined area above epiphyseal bar in DMSO control versus 9.2±1.06 cells in corresponding region of RA-treated fish; n=12 confocal stacks from three independent specimen for each condition). In B, the space separating the two osx-positive lines is strongly reduced, reflecting the thinning or complete loss of the calvarial plate. (C,D) In situ hybridizations, revealing strongly impaired expression of the collagen gene col1a1 in bone-lining cells of the RA-treated fish. (E,F) Expression of bglap, a marker for mature osteoblasts, as assessed in tg(bglap:GFP), is downregulated in RA-treated sample. (G-J) In situ hybridizations, revealing increased expression of spp1 (G,H) and the preosteocyte marker phex (I,J) in bone-lining cells of the RA-treated fish. (K-M) phex in situ hybridization (K,L; green), counterstained via anti-RFP immunolabeling of osteogenic cells expressing the osx:NTRmCherry transgene (red; merged images in M,N). phex induction by RA is most prominent in osteogenic cells above the epiphyseal bar.
RA affects osteogenic cells independently of osteoclasts, whereas its effect on osteoclasts is dependent on osteogenic cells
In light of the described dependence of RA-induced calvarial fragmentation on both osteogenic cells/preosteocytes and osteoclasts, we next studied the extent to which this interdependence also applies to the transcriptional RA responses of the two cell types. In pfe mutants devoid of osteoclasts, expression of the preosteocyte markers phex, spp1 and rankl were induced by RA as strongly as in wild-type fish, as evident in in situ hybridizations at the osteogenic front and at sites of calvarial fragmentation (Fig. 6A,B), and in qRT-PCR analysis of isolated calvaria (Fig. 6C). By contrast, after osteogenic cell ablation, calvarial regions above the epiphyseal bar lacked RA-induced osteoclastic activity (Fig. 6D,E). Furthermore, qRT-PCR analysis showed that, in contrast to wild-type fish, the osteoclast marker genes acp5a and rank lacked any significant positive response to RA in the absence of osteogenic cells (Fig. 6F). This indicates that the RA-induced responses of osteogenic cells are independent of osteoclasts, whereas the responses of osteoclasts depend on osteogenic cells, in line with the proposed indirect stimulation of osteoclasts by RA-induced preosteocytes.
Fig. 6.
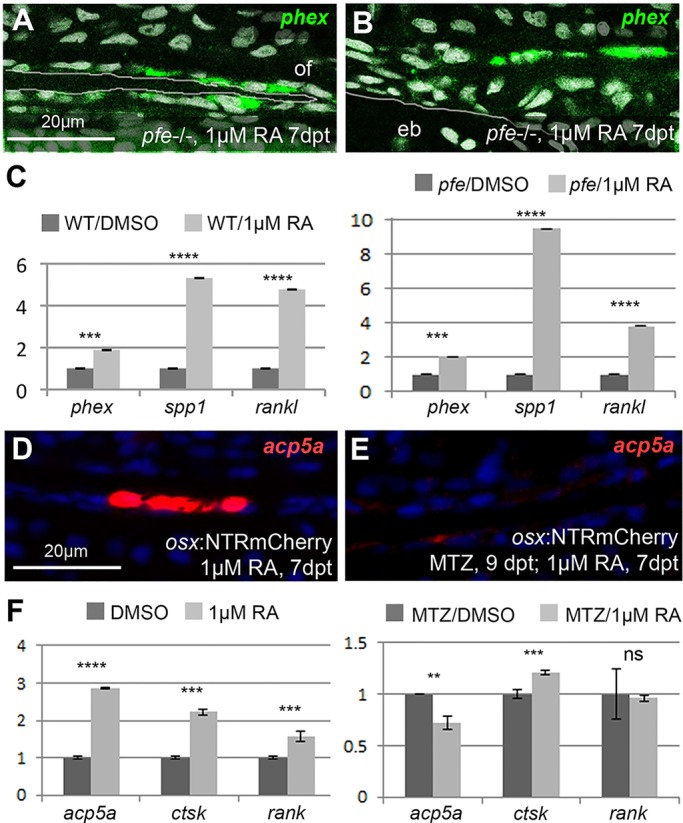
In mutants lacking osteoclasts, preosteocytes are normally induced, whereas osteoclast markers cannot be induced after ablation of osteogenic cells. (A,B) Fluorescent phex in situ hybridization of RA-treated pfe mutants at osteogenic front (A; of) and calvarial fragmentation site (B), counterstained with DAPI (white). pfe mutants display a similar phex expression pattern as RA-treated wild-type controls (Figs 2R vs 5L). (C) qRT-PCR analysis of osteoblast marker genes in pfe mutants and wild-type controls after DMSO or RA treatment. The preosteocyte markers phex and rankl are induced by RA in pfe−/− mutants to a similar extent as in wild-type controls; spp1 induction is even stronger than in wild-type controls (9.5× versus 5.3×), pointing to an inhibitory role of osteoclasts on Spp1 production in preosteocytes (Sims and Martin, 2014). (D,E) In the absence of osteogenic cells, RA fails to induce osteoclastic acp5a expression in epiphyseal bar region (E), in contrast to controls containing osteogenic cells (D). (F) qRT-PCR analysis of osteoclastic marker gene expression. In the absence of osteogenic cells, RA induces a down-, rather than an upregulation of the osteoclast-specific marker gene acp5a, whereas rank levels, which are 1.56±0.13× increased upon RA treatment of wild-type controls, do not respond to RA. By contrast, ctsk expression is induced (1.2±0.02×), but induction is weaker than in controls (2.2±0.09×). The remaining ctsk and spp1 (Fig. 4K) induction is most likely due to their activation in other cell types such as macrophages, consistent with former reports (Bühling et al., 2001; Rittling, 2011). **P<0.01, ***P<0.001, ****P<0.0001, ns, not significant.
Osteoclasts at the inner surface of the calvaria are tightly associated with RA-induced preosteocytes
Looking more closely at regions above the epiphyseal bar of RA-treated or cyp26b1 hypomorphic fish in which the calvarial plates were not fully resorbed, it became evident that osteoclasts were only present at the inner calvarial surface (Fig. S5E). Furthermore, whereas the response of the preosteocyte marker phex was rather similar on the inner and outer surface, RA-induced spp1 expression was much stronger on the inner surface of the calvarial plate (compare Fig. 5H with 5J). This, together with the described expression of Spp1 in mammalian osteoclasts (Merry et al., 1993; Yamate et al., 1997), suggested that spp1 might mark both preosteocytes and activated osteoclasts. Indeed, performing double in situ hybridization, we found spp1 to be expressed both in some of the osx-positive cells of the osteogenic lineage (Fig. 7A-C) and in all acp5a-positive osteoclasts at cavarial fragmentation sites of RA-treated fish (Fig. 7D-F). Interestingly, we observed many tightly associated pairs of spp1-positive cells, one co-expressing tg(osx:NTR-mCherry), identifying it as a preosteocyte (Fig. 7A-C), and one co-expressing acp5a, identifying it as an activated osteoclast (Fig. 7D-F). Strikingly, all investigated osteoclasts (spp1+, acp5a+) had an spp1+, acp5a− neighbor (preosteocyte), whereas osteogenic cells on the outer calvarial surface displayed spp1 expression in the absence of adjacent osteoclasts (Fig. 5H,J; Fig. 3M,O,P; Fig. S5F). This indicates that osteoclasts act in tight association with RA-induced preosteocytes, in line with former reports on osteoclasts and osteogenic cells in Medaka larvae (To et al., 2012).
Fig. 7.
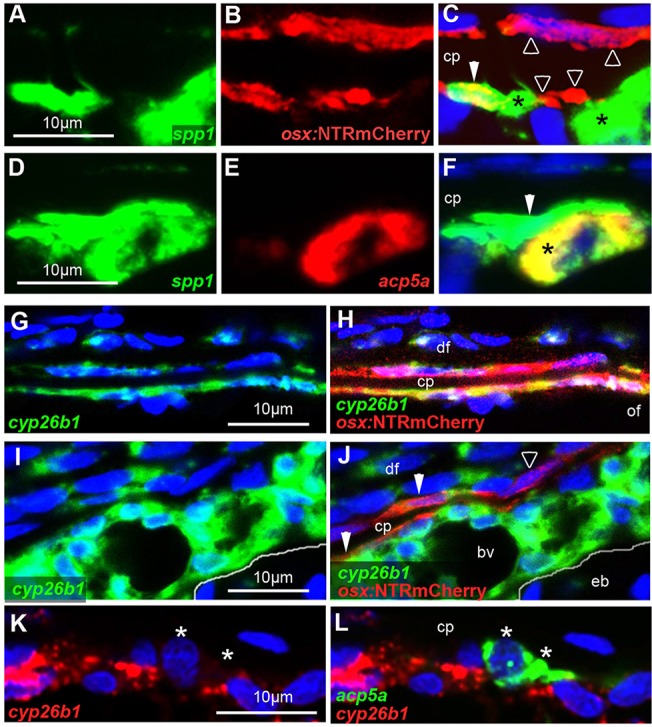
Osteoclasts are tightly associated with preosteocytes and, in contrast to osteogenic cells, lack cyp26b1 expression. All images show wild-type specimens at 7 dpt with RA. DMSO-treated controls stained in parallel lacked detectable spp1, acp5a and cyp26b1 signals (not shown). A-F,I-L show sagittal sections through sites of calvarial fragmentation; G,H show transverse sections at the osteogenic front region of a frontal plate, labeled by in situ hybridization with the indicated probes and/or anti-RFP immunolabeling of osteogenic cells expressing tg(osx:NTRmCherry). Osteoclasts are labeled with asterisks, preosteocytes with filled arrowheads, and other osteogenic cells with open arrowheads. (A-C) spp1 is expressed in an osx+ cell (preosteocyte), which is tightly associated with an spp1+, osx− cell (osteoclast) (n=8/8). Note that particularly on the outer surface of the calvarial plate, not all osx+ cells express spp1. (D-F) ssp1 is expressed in an acp5a+ osteoclast, which is tightly associated with an ssp1+, acp5a− cell (preosteocyte) (n=13/13). (G,H) At the osteogenic front, almost all osx+ osteogenic cells lining the growing calvarial plate display RA-induced cyp26b1 expression (n=5/5). (I,J) Sites of calvarial fragmentation contain both cyp26b1+ and cyp26b1− osteogenic cells (osx+). Note that chondrocytes in the epiphyseal bar lack RA-induced cyp26b1 expression (n=5/5). (K,L) acp5a+ osteoclasts lack cyp26b1 expression (n=8/8). Panels G-J show additional cyp26b1 expression in dermal fibroblasts, known targets of RA signaling (Nelson and Balian, 1984; Varani et al., 1990). Panels I-L show additional and very strong RA-induced cyp26b1 expression in a distinct tissue adjacent to the epiphyseal bar. The exact nature of this tissue is unknown. It contains multiple blood vessels, not seen in such sizes and densities in other subcalvarial regions (compare with Fig. S5A). bv, blood vessel; cp, calvarial plate; df, dermal fibrobasts; eb, epiphyseal bar; of, osteogenic front.
RA induces upregulation of cyp26b1 in osteogenic cells, but not in osteoclasts
The dependence of the RA response of osteoclasts on osteogenic cells, but not vice versa, suggests that RA primarily affects osteogenic cells. Lacking suitable RA responder lines (see Discussion) to identify the direct RA target cells, we carried out cyp26b1 in situ hybridizations, because Cyp26 genes were identified as retinoic acid response element (RARE)-containing direct transcriptional targets of RA signaling (Loudig et al., 2005) that are upregulated upon RA treatment (Laue et al., 2008). Performing double labelings, we found that, among other cell types known to be responsive to RA signals, such as dermal fibroblasts, many, but not all, of the osteogenic (osx+) cells displayed co-expression with cyp26b1 both at osteogenic fronts (Fig. 7G,H) and calvarial fragmentation sites (Fig. 7I,J). By contrast, acp5a-positive osteoclasts displayed much weaker cyp26b1 expression, which was hardly above background levels (Fig. 7K,L). This suggests that, in contrast to osteogenic cells, osteoclasts are not a main direct target of RA signals.
DISCUSSION
Premature osteoblast-to-preosteocyte transitioning leads to increased or decreased bone formation: two sides of the same medal
Hypomorphic or amorphic mutations in the RA-catabolizing enzyme Cyp26b1 have been reported to induce very different, and even opposite, effects on bone development. Effects range from a net gain of bone in the developing spine of cyp26b1 amorphic zebrafish larvae (Laue et al., 2008; Spoorendonk et al., 2008) to a net loss of bone in the calvaria of human CYP26B1 amorphs (Laue et al., 2011). However, the reasons for these differences are not fully understood.
In zebrafish and human Cyp26b1 hypomorphs, a bilateral coronal craniosynostosis is caused by premature osteoblast-to-preosteocyte transitioning of osteogenic cells within the coronal suture (Laue et al., 2011). The main function of mature osteoblasts is the production of proteins of the bone matrix (osteoid), such as collagens and other components like Osteocalcin/Bglap, which attenuates osteoid mineralization by sequestering Ca2+. Once further differentiated to preosteocytes, however, they stop osteoid production, and instead promote hydroxapatite [Ca10(PO4)6(OH)2] crystal formation/propagation on collagen fibers, and thereby osteoid mineralization/ossification (Dallas and Bonewald, 2010; Franz-Odendaal et al., 2006). Accordingly, Cyp26b1 mutants displayed premature suture matrix mineralization and calvarial fusion caused by the appearance of prematurely differentiated preosteocytes (Laue et al., 2011).
Here, we show that the calvarial defects induced by even further elevated RA levels (caused by Cyp26b1 amorphic mutations or treatments with a chemical Cyp26 inhibitor or exogenous RA) are also primarily caused by premature osteoblast-to-preosteocyte transitioning, despite the obvious differences in the net outcomes for mineralized bone masses (Fig. 8). Treatment of wild-type zebrafish with RA or the Cyp26 inhibitor before suture establishment led to reduced calvarial growth and reduced plate sizes and thicknesses, mimicking the defects of human and mouse CYP26B1 amorphs (Maclean et al., 2009; Laue et al., 2011). In addition, osteogenic fronts displayed a loss of osteoblast markers and a gain of preosteocyte markers (Fig. 2), consistent with described alterations in the coronal sutures of Cyp26b1 hypopmorphs, although in these former studies, no specific preosteocyte markers had been available (Laue et al., 2011). In conclusion, both in amorphs and hypomorphs, calvarial defects are caused by the same primary effect of RA. However, in the amorph, premature osteoblast-to-preosteocyte transitioning occurs before the frontal and parietal plates have met (and formed the suture), so that the osteoblast-deprival aspect of the premature transition has the major impact, whereas in the hypomorph, it happens after coronal suture formation, leading to a predominant impact of the gain-of-preosteocyte aspect.
Fig. 8.

Model of how RA-induced premature osteoblast-to-preosteocyte transitioning can have multiple and contrary effects on the net bone mass in developing calvaria. Regular bone is in dark blue, ectopic bone in light blue. Affected regions are boxed in red. Gain of preosteocytes in coronal suture of hypomorph leads to ectopic mineralization of suture matrix (seemingly more bone; bottom left). Loss of osteoblasts at growing edges of calvaria of amorph leads to reduced matrix deposition, ceased calvarial growth and skull patency (less bone; bottom right). Osteoclast activation by gained preosteocytes in amorph leads to the resorption of formerly formed calvarial bone (loss of bone; top right).
Interestingly, however, calvaria of amorphs and hypomorphs also share morphological features. Thus, also in the hypomorphs, reduced calvarial growth was apparent at the sagittal suture, which remained wide open (Laue et al., 2011), as it is normally formed much later than the (fused) coronal suture (Fig. 1A-C). And in likely amorphs, patent intercalvarial regions were weakly stained with calcein (Fig. 1C-E), appearing like a subtle craniosynostosis. However, this ectopic mineralization does not seem to occur in intercalvarial regions, but primarily in the adjacent dermis, as described for diseases such as pseudoxanthoma elasticum (PXE) (Apschner et al., 2014; Mackay et al., 2015; Walker et al., 1989). Indeed, both dermal fibroblasts and basal keratinocytes express col1a2 (Fig. S1), a close relative of the osteoblast-specific col1a1 gene, and even do so after RA treatment. This suggests that upon compromised type I collagen production by osteoblasts at the growing edges of the calvaria, RA-induced pre-osteocytes can stimulate the mineralization of collagens in adjacent tissues that would normally not be ossified.
How premature osteoblast-to-preosteocyte transitioning leads to bone resorption
Treatment with RA or the Cyp26 inhibitor impaired both horizontal and vertical growth of the calvaria. However, the latter cannot be the sole reason for the observed fragmentation of the calvaria, because holes occurred in regions that were formerly ossified (Fig. 3A-C), and because no fragmentation was obtained upon even longer ablation of all osteogenic cells (compare Fig. 4I with 4H). Strikingly, regions of RA-induced fragmentation displayed ectopic activation of osteoclasts (Fig. 3H-R), and no fragmentation could be induced in mutants lacking osteoclasts (Fig. 4A,B), pointing to the involvement and requirement of active bone resorption. Interestingly, however, RA also failed to induce calvarial fragmentation when osteogenic cells were absent (Fig. 4G-J). Marker gene expression analysis further supported this as at the osteogenic fronts (Fig. 2) RA induced premature osteoblast-to-preosteocyte transitioning at fragmentation sites, thereby also leading to an increased expression of the genes encoding the osteoclast stimulators Rankl and Spp1 (Fig. 5; Fig. 6A-C). Finally, preosteocytes and activated osteoclasts were tightly associated at the inner surface of fragmented calvarial plates (Fig. 7A-F), whereas osteogenic cells, but not osteoclasts, displayed a strong RA-induced upregulation of cyp26b1 expression, a likely indicator of direct RA reception (Laue et al., 2008; Loudig et al., 2005). Although the latter point requires confirmation with unambiguous RA reporter lines – currently existing ones (Mandal et al., 2013; Tiefenbach et al., 2010) were unfortunately not sensitive enough to detect RA signaling at juvenile stages – our data in sum suggest that RA-induced calvarial resorption is also an outcome of premature osteoblast-to-osteocyte transitioning (Fig. 8), rather than direct activation of osteoclasts, as shown in several in vitro systems (see Introduction). Our data are in line with results obtained for cultured calvaria, which respond to RA by an upregulation of RANKL and osteoclastic bone resorption (Conaway et al., 2011). In addition, they are consistent with findings obtained in cell culture and transgenic mouse systems indicating that (pre)osteocytes are much more potent in stimulating osteoclasts than are osteoblasts (Nakashima et al., 2011; Xiong et al., 2011; Zhao et al., 2002). Of note, in contrast to regular bone remodeling, the RA-induced calvarial holes could not be refilled, most likely owing to the concomitant deprival of osteoblasts. Instead, the margins of the holes became hypermineralized (Fig. 3F). This effect was much stronger than at the compromised osteogenic fronts of RA-treated fish (compare Fig. 3E with 1E), possibly pointing to further preosteocyte- and mineralization-stimulating effects by osteoclasts or factors released from the degraded bone matrix, consistent with results obtained in mammalian systems (Sims and Martin, 2014; Zhao et al., 2006).
Why RA-induced calvarial fragmentation might be confined to specific regions
Fragmentation induced by Cyp26 inhibition or exogenous RA treatment was confined to specific regions of the calvaria both in zebafish and in human (Laue et al., 2011), and predominantly found above the epiphyseal bar of the zebrafish skull. Currently, we can only speculate about the reasons. One possibility could be local differences in the vascularization of the subcalvarial zone, which in zebrafish seems to be particularly high above the epiphyseal bar, thus allowing better infiltration by osteoclasts (Fig. S5A). In addition, there could be a co-stimulation by the highly RA-responsive cells directly anterior of the epiphyseal bar (Fig. 7I-L), which we could not find anywhere else along the anterior-posterior axis of the upper brain case. Finally, there could be a co-stimulation by chondrocytes of the epiphyseal bar.
Identification of Spp1 (Osteopontin) as a product of preosteocytes, possibly promoting osteoclast activity
Thus far, Spp1 (Osteopontin) has been largely regarded as a product of osteoblasts, consistent with its known function to attenuate osteoid mineralization via Ca2+ binding and an inhibition of crystal growth (Sodek et al., 2000). However, our analyses presented here, including the co-expression with phex, identify it as a marker and product of preosteocytes. Our data are consistent with recent comparative evolutionary analyses revealing that Spp1 only emerged together with bone mineralization (Venkatesh et al., 2014), which is under control of preosteocytes, rather than osteoblasts (Dallas and Bonewald, 2010; Franz-Odendaal et al., 2006). Nevertheless, an anti-mineralizing role of Spp1 in (mineralizing) preosteocytes might at first sight be surprising, in particular as its ‘partner’, the endopeptidase Phex, is known to degrade it (Barros et al., 2013). However, it could be regarded as an intrinsic negative-feedback response, similar to the commonly observed induction of cyp26 expression in response to RA signals (Laue et al., 2008; Loudig et al., 2005). In addition, Spp1 might prepare the mineralized matrix for later remodeling by serving as docking sites of osteoclasts that bind to Spp1's RGD domain via specific integrin surface receptors (Reinholt et al., 1990; Teitelbaum, 2000, 2011). This effect is later reinforced by Spp1 made by osteoclasts themselves (Merry et al., 1993; Yamate et al., 1997), as also seen in the calvaria in the preosteocyte-mediated response to RA (Fig. 7A-F).
The meninges as a possible source of RA coordinating the growth of the brain and its bony case
Notably, both decreased formation of new bone and increased resorption of pre-existing bone were not only obtained upon systemic administration of exogenous RA, but also upon compromised Cyp26-dependent catabolization of endogenous RA. Based on RALDH expression analysis, we could identify the meninges as the likely sole source of endogenous RA affecting calvarial development. We also observed spatial differences in menigeal aldh1a2 expression levels that correlate with the pattern of calvarial growth (Fig. S3), consistent with expression data previously obtained in mouse (James et al., 2010), and with in vitro co-culture studies revealing that some regions of the meninges were more effective in inducing osteoblast differentiation than others (Warren et al., 2003). However, functional analyses of meningeal RA itself have mainly focused on its role in cephalic neuron generation and differentiation (Siegenthaler et al., 2009; Zhang et al., 2003). These data, together with our findings presented here, suggest that RA from the meninges, by signaling both inwards and outwards, might simultaneously coordinate the growth of the brain and its bony case. Together with the different secondary effects of RA-responsive cells described above, this highlights the complexity of RA signaling processes regulating head development, and the difficulties one has to face when trying to treat RA-related diseases.
MATERIALS AND METHODS
Fish strains
The following zebrafish lines were used: ola.Bglap:EGFhu4008Tg (Vanoevelen et al., 2011), Hsa.RUNX2-Mmu.Fos:EGFPzf259Tg (Kague et al., 2012), col1a1:EGFPzf195Tg (Kague et al., 2012), osx:NTRmCherry (Singh et al., 2012), aldh1a2:aldh1a2-GFPkn2Tg (Pittlik and Begemann, 2012) and pfetm36b (Haffter et al., 1996; Maderspacher and Nüsslein-Volhard, 2003). Experiments were approved by the National Animal Care Committees (LANUV Nordrhein-Westfalen; 8.87-50.10.31.08.129; 84-02.04.2012.A251; City of Cologne; 576.1.36.6.3.01.10 Be) and the University of Cologne.
Retinoic acid, R115866 and metronidazole treatments
Stock solutions of all-trans RA (1 mM; Sigma-Aldrich, R2625) and rambazole (R115866; 10 mM; generous gift from Johnson & Johnson Pharmaceutical Research & Development, San Diego, CA, USA) were prepared in dimethyl sulfoxide (DMSO), and further diluted to their final concentrations (1 µM) in fish water. Metronidazole (MTZ; Sigma-Aldrich) solution was prepared freshly in fish water. Juvenile fish were pre-treated with 10 µM MTZ for 2 days, and with 5 µM MTZ during the following 7 days of co-treatment with RA/DMSO. All treatments were conducted in the dark in 1-liter containers with permanent air bubbling. Each experiment was performed at least three times, with at least eight fish per experiment and condition, yielding equivalent results.
Tissue labeling procedures
Labeling of mineralized bone (Kimmel et al., 2010), TRAP staining (Edsall and Franz-Odendaal, 2010), Hematoxylin & Eosin, and Azan novum histology, in situ hybridizations and immunohistochemistry (Fischer et al., 2014; Laue et al., 2011) were performed on tissue sections basically as described, with slight modifications (see supplementary Materials and Methods for further details, including antibodies and primers).
qRT-PCR
Calvaria were manually dissected out of freshly sacrified fish and immersed in Trizol for RNA extraction and cDNA synthesis according to standard protocols. Levels of gene expression were determined via qRT-PCR with Taqman Gene Expression Assays (Applied Biosystems), as described in the supplementary Materials and Methods. Each experiment was performed with samples from at least three to five independent experiments, all of which yielded similar results, and with technical triplicate of each sample. Shown are the results of one representative experiment.
Statistics
Mean values and standard deviations were determined with Excel software. P-values were determined by Student's t-test, or, when more than two samples were compared with each other (Fig. 4K), by one-way analysis of variance (ANOVA), followed by least significant difference (Bonferroni's) test.
Acknowledgements
We are very grateful to S. Fisher, S. Schulte-Merker, K. Poss, G. Begemann and C. Nüsslein-Volhard for providing fish lines and plasmids; and to C. Schenkel for the section shown in Fig. S5A.
Footnotes
Competing interests
The authors declare no competing or financial interests.
Author contributions
S.J. and M.H. conceived the project and planned the experiments, S.J. performed the experiments, S.J. and M.H. analyzed the data and wrote the manuscript.
Funding
This work was supported by the European Commission (7th Framework Program, Integrated Project ZF-HEALTH) [HEALTH-F4-2010-242048 to M.H.]; and the National Institutes of Health [GM63904 to M.H.]. Deposited in PMC for release after 12 months.
Supplementary information
Supplementary information available online at http://dev.biologists.org/lookup/suppl/doi:10.1242/dev.129189/-/DC1
References
- Apschner A., Huitema L. F. A., Ponsioen B., Peterson-Maduro J. and Schulte-Merker S. (2014). Zebrafish enpp1 mutants exhibit pathological mineralization, mimicking features of generalized arterial calcification of infancy (GACI) and pseudoxanthoma elasticum (PXE). Dis. Model. Mech. 7, 811-822. 10.1242/dmm.015693 [DOI] [PMC free article] [PubMed] [Google Scholar]
- Balkan W., Rodríguez-Gonzalez M., Pang M., Fernandez I. and Troen B. R. (2011). Retinoic acid inhibits NFATc1 expression and osteoclast differentiation. J. Bone Miner. Metab. 29, 652-661. 10.1007/s00774-011-0261-0 [DOI] [PubMed] [Google Scholar]
- Barros N. M. T., Hoac B., Neves R. L., Addison W. N., Assis D. M., Murshed M., Carmona A. K. and McKee M. D. (2013). Proteolytic processing of osteopontin by PHEX and accumulation of osteopontin fragments in Hyp mouse bone, the murine model of X-linked hypophosphatemia. J. Bone Miner. Res. 28, 688-699. 10.1002/jbmr.1766 [DOI] [PubMed] [Google Scholar]
- Begemann G., Schilling T. F., Rauch G. J., Geisler R. and Ingham P. W. (2001). The zebrafish neckless mutation reveals a requirement for raldh2 in mesodermal signals that pattern the hindbrain. Development 128, 3081-3094. [DOI] [PubMed] [Google Scholar]
- Bühling F., Reisenauer A., Gerber A., Krüger S., Weber E., Brömme D., Roessner A., Ansorge S., Welte T. and Röcken C. (2001). Cathepsin K--a marker of macrophage differentiation? J. Pathol. 195, 375-382. 10.1002/path.959 [DOI] [PubMed] [Google Scholar]
- Chatani M., Takano Y. and Kudo A. (2011). Osteoclasts in bone modeling, as revealed by in vivo imaging, are essential for organogenesis in fish. Dev. Biol. 360, 96-109. 10.1016/j.ydbio.2011.09.013 [DOI] [PubMed] [Google Scholar]
- Chiba M., Teitelbaum S. L., Cao X. and Ross F. P. (1996). Retinoic acid stimulates expression of the functional osteoclast integrin alpha v beta 3: transcriptional activation of the beta 3 but not the alpha v gene. J. Cell Biochem. 62, 467-475. 10.1002/(SICI)1097-4644(19960915)62:4<467::AID-JCB4>3.0.CO;2-K [DOI] [PubMed] [Google Scholar]
- Cohen-Tanugi A. and Forest N. (1998). Retinoic acid suppresses the osteogenic differentiation capacity of murine osteoblast-like 3/A/1D-1M cell cultures. Differentiation 63, 115-123. 10.1046/j.1432-0436.1998.6330115.x [DOI] [PubMed] [Google Scholar]
- Conaway H. H., Pirhayati A., Persson E., Pettersson U., Svensson O., Lindholm C., Henning P., Tuckermann J. and Lerner U. H. (2011). Retinoids stimulate periosteal bone resorption by enhancing the protein RANKL, a response inhibited by monomeric glucocorticoid receptor. J. Biol. Chem. 286, 31425-31436. 10.1074/jbc.M111.247734 [DOI] [PMC free article] [PubMed] [Google Scholar]
- Conaway H. H., Henning P. and Lerner U. H. (2013). Vitamin a metabolism, action, and role in skeletal homeostasis. Endocr. Rev. 34, 766-797. 10.1210/er.2012-1071 [DOI] [PubMed] [Google Scholar]
- Dallas S. L. and Bonewald L. F. (2010). Dynamics of the transition from osteoblast to osteocyte. Ann. N. Y. Acad. Sci. 1192, 437-443. 10.1111/j.1749-6632.2009.05246.x [DOI] [PMC free article] [PubMed] [Google Scholar]
- Edsall S. C. and Franz-Odendaal T. A. (2010). A quick whole-mount staining protocol for bone deposition and resorption. Zebrafish 7, 275-280. 10.1089/zeb.2009.0641 [DOI] [PubMed] [Google Scholar]
- Fischer B., Metzger M., Richardson R., Knyphausen P., Ramezani T., Franzen R., Schmelzer E., Bloch W., Carney T. J. and Hammerschmidt M. (2014). p53 and TAp63 promote keratinocyte proliferation and differentiation in breeding tubercles of the zebrafish. PLoS Genet. 10, e1004048 10.1371/journal.pgen.1004048 [DOI] [PMC free article] [PubMed] [Google Scholar]
- Franz-Odendaal T. A., Hall B. K. and Witten P. E. (2006). Buried alive: how osteoblasts become osteocytes. Dev. Dyn. 235, 176-190. 10.1002/dvdy.20603 [DOI] [PubMed] [Google Scholar]
- Goldgeier M. H., Klein L. E., Klein-Angerer S., Moellmann G. and Nordlund J. J. (1984). The distribution of melanocytes in the leptomeninges of the human brain. J. Invest. Dermatol. 82, 235-238. 10.1111/1523-1747.ep12260111 [DOI] [PubMed] [Google Scholar]
- Haffter P., Odenthal J., Mullins M. C., Lin S., Farrell M. J., Vogelsang E., Haas F., Brand M., van Eeden F. J. M., Furutani-Seiki M. et al. (1996). Mutations affecting pigmentation and shape of the adult zebrafish. Dev. Genes Evol. 206, 260-276. 10.1007/s004270050051 [DOI] [PubMed] [Google Scholar]
- Iba K., Chiba H., Yamashita T., Ishii S. and Sawada N. (2001). Phase-independent inhibition by retinoic acid of mineralization correlated with loss of tetranectin expression in a human osteoblastic cell line. Cell Struct. Funct. 26, 227-233. 10.1247/csf.26.227 [DOI] [PubMed] [Google Scholar]
- James A. W., Levi B., Xu Y., Carre A. L. and Longaker M. T. (2010). Retinoic acid enhances osteogenesis in cranial suture-derived mesenchymal cells: potential mechanisms of retinoid-induced craniosynostosis. Plast. Reconstr. Surg. 125, 1352-1361. 10.1097/PRS.0b013e3181d62980 [DOI] [PMC free article] [PubMed] [Google Scholar]
- Kague E., Gallagher M., Burke S., Parsons M., Franz-Odendaal T. and Fisher S. (2012). Skeletogenic fate of zebrafish cranial and trunk neural crest. PLoS ONE 7, e47394 10.1371/journal.pone.0047394 [DOI] [PMC free article] [PubMed] [Google Scholar]
- Kimmel C. B., DeLaurier A., Ullmann B., Dowd J. and McFadden M. (2010). Modes of developmental outgrowth and shaping of a craniofacial bone in zebrafish. PLoS ONE 5, e9475 10.1371/journal.pone.0009475 [DOI] [PMC free article] [PubMed] [Google Scholar]
- Kobayashi Y., Udagawa N. and Takahashi N. (2009). Action of RANKL and OPG for osteoclastogenesis. Crit. Rev. Eukaryot. Gene Expr. 19, 61-72. 10.1615/CritRevEukarGeneExpr.v19.i1.30 [DOI] [PubMed] [Google Scholar]
- Lammer E. J., Chen D. T., Hoar R. M., Agnish N. D., Benke P. J., Braun J. T., Curry C. J., Fernhoff P. M., Grix A. W. Jr, Lott I. T. et al. (1985). Retinoic acid embryopathy. N. Engl. J. Med. 313, 837-841. 10.1056/NEJM198510033131401 [DOI] [PubMed] [Google Scholar]
- Laue K., Janicke M., Plaster N., Sonntag C. and Hammerschmidt M. (2008). Restriction of retinoic acid activity by Cyp26b1 is required for proper timing and patterning of osteogenesis during zebrafish development. Development 135, 3775-3787. 10.1242/dev.021238 [DOI] [PMC free article] [PubMed] [Google Scholar]
- Laue K., Pogoda H.-M., Daniel P. B., van Haeringen A., Alanay Y., von Ameln S., Rachwalski M., Morgan T., Gray M. J., Breuning M. H. et al. (2011). Craniosynostosis and multiple skeletal anomalies in humans and zebrafish result from a defect in the localized degradation of retinoic acid. Am. J. Hum. Genet. 89, 595-606. 10.1016/j.ajhg.2011.09.015 [DOI] [PMC free article] [PubMed] [Google Scholar]
- Le Guellec D., Morvan-Dubois G. and Sire J. (2004). Skin development in bony fish with particular emphasis on collagen deposition in the dermis of the zebrafish (Danio rerio). Int. J. Dev. Biol. 48, 217-231. 10.1387/ijdb.15272388 [DOI] [PubMed] [Google Scholar]
- Liang D., Zhang M., Bao J., Zhang L., Xu X., Gao X. and Zhao Q. (2008). Expressions of Raldh3 and Raldh4 during zebrafish early development. Gene Expr. Patterns 8, 248-253. 10.1016/j.gep.2007.12.007 [DOI] [PubMed] [Google Scholar]
- Loudig O., Maclean G. A., Dore N. L., Luu L. and Petkovich M. (2005). Transcriptional co-operativity between distant retinoic acid response elements in regulation of Cyp26A1 inducibility. Biochem. J. 392, 241-248. 10.1042/BJ20050874 [DOI] [PMC free article] [PubMed] [Google Scholar]
- Mackay E. W., Apschner A. and Schulte-Merker S. (2015). Vitamin K reduces hypermineralisation in zebrafish models of PXE and GACI. Development 142, 1095-1101. 10.1242/dev.113811 [DOI] [PubMed] [Google Scholar]
- Maclean G., Dollé P. and Petkovich M. (2009). Genetic disruption of CYP26B1 severely affects development of neural crest derived head structures, but does not compromise hindbrain patterning. Dev. Dyn. 238, 732-745. 10.1002/dvdy.21878 [DOI] [PubMed] [Google Scholar]
- Maderspacher F. and Nüsslein-Volhard C. (2003). Formation of the adult pigment pattern in zebrafish requires leopard and obelix dependent cell interactions. Development 130, 3447-3457. 10.1242/dev.00519 [DOI] [PubMed] [Google Scholar]
- Mandal A., Rydeen A., Anderson J., Sorrell M. R. J., Zygmunt T., Torres-Vázquez J. and Waxman J. S. (2013). Transgenic retinoic acid sensor lines in zebrafish indicate regions of available embryonic retinoic acid. Dev. Dyn. 242, 989-1000. 10.1002/dvdy.23987 [DOI] [PMC free article] [PubMed] [Google Scholar]
- Matsuo K. and Irie N. (2008). Osteoclast-osteoblast communication. Arch. Biochem. Biophys. 473, 201-209. 10.1016/j.abb.2008.03.027 [DOI] [PubMed] [Google Scholar]
- Merry K., Dodds R., Littlewood A. and Gowen M. (1993). Expression of osteopontin mRNA by osteoclasts and osteoblasts in modelling adult human bone. J. Cell Sci. 104, 1013-1020. [DOI] [PubMed] [Google Scholar]
- Nakashima T., Hayashi M., Fukunaga T., Kurata K., Oh-Hora M., Feng J. Q., Bonewald L. F., Kodama T., Wutz A., Wagner E. F. et al. (2011). Evidence for osteocyte regulation of bone homeostasis through RANKL expression. Nat. Med. 17, 1231-1234. 10.1038/nm.2452 [DOI] [PubMed] [Google Scholar]
- Nelson D. L. and Balian G. (1984). The effect of retinoic acid on collagen synthesis by human dermal fibroblasts. Coll. Relat. Res. 4, 119-128. 10.1016/S0174-173X(84)80020-5 [DOI] [PubMed] [Google Scholar]
- Parichy D. M., Elizondo M. R., Mills M. G., Gordon T. N. and Engeszer R. E. (2009). Normal table of postembryonic zebrafish development: staging by externally visible anatomy of the living fish. Dev. Dyn. 238, 2975-3015. 10.1002/dvdy.22113 [DOI] [PMC free article] [PubMed] [Google Scholar]
- Pittlik S. and Begemann G. (2012). New sources of retinoic acid synthesis revealed by live imaging of an Aldh1a2-GFP reporter fusion protein throughout zebrafish development. Dev. Dyn. 241, 1205-1216. 10.1002/dvdy.23805 [DOI] [PubMed] [Google Scholar]
- Pittlik S., Domingues S., Meyer A. and Begemann G. (2008). Expression of zebrafish aldh1a3 (raldh3) and absence of aldh1a1 in teleosts. Gene Expr. Patterns 8, 141-147. 10.1016/j.gep.2007.11.003 [DOI] [PubMed] [Google Scholar]
- Reinholt F. P., Hultenby K., Oldberg A. and Heinegard D. (1990). Osteopontin--a possible anchor of osteoclasts to bone. Proc. Natl. Acad. Sci. USA 87, 4473-4475. 10.1073/pnas.87.12.4473 [DOI] [PMC free article] [PubMed] [Google Scholar]
- Rhinn M. and Dolle P. (2012). Retinoic acid signalling during development. Development 139, 843-858. 10.1242/dev.065938 [DOI] [PubMed] [Google Scholar]
- Rittling S. R. (2011). Osteopontin in macrophage function. Expert Rev. Mol. Med. 13, e15 10.1017/S1462399411001839 [DOI] [PubMed] [Google Scholar]
- Sadler T. W. and Langman J. (2010). Langman's Medical Embryology. Philadelphia: Wolters Kluwer Lippincott Williams & Wilkins. [Google Scholar]
- Samarut E., Fraher D., Laudet V. and Gibert Y. (2014). ZebRA: an overview of retinoic acid signaling during zebrafish development. Biochim. Biophys. Acta 1849, 73-83. 10.1016/j.bbagrm.2014.05.030 [DOI] [PubMed] [Google Scholar]
- Siegenthaler J. A., Ashique A. M., Zarbalis K., Patterson K. P., Hecht J. H., Kane M. A., Folias A. E., Choe Y., May S. R., Kume T. et al. (2009). Retinoic acid from the meninges regulates cortical neuron generation. Cell 139, 597-609. 10.1016/j.cell.2009.10.004 [DOI] [PMC free article] [PubMed] [Google Scholar]
- Sims N. A. and Martin T. J. (2014). Coupling the activities of bone formation and resorption: a multitude of signals within the basic multicellular unit. Bonekey Rep. 3, 481 10.1038/bonekey.2013.215 [DOI] [PMC free article] [PubMed] [Google Scholar]
- Singh S. P., Holdway J. E. and Poss K. D. (2012). Regeneration of amputated zebrafish fin rays from de novo osteoblasts. Dev. Cell 22, 879-886. 10.1016/j.devcel.2012.03.006 [DOI] [PMC free article] [PubMed] [Google Scholar]
- Skillington J., Choy L. and Derynck R. (2002). Bone morphogenetic protein and retinoic acid signaling cooperate to induce osteoblast differentiation of preadipocytes. J. Cell Biol. 159, 135-146. 10.1083/jcb.200204060 [DOI] [PMC free article] [PubMed] [Google Scholar]
- Sodek J., Ganss B. and McKee M. D. (2000). Osteopontin. Crit. Rev. Oral Biol. Med. 11, 279-303. 10.1177/10454411000110030101 [DOI] [PubMed] [Google Scholar]
- Song H. M., Nacamuli R. P., Xia W., Bari A. S., Shi Y.-Y., Fang T. D. and Longaker M. T. (2005). High-dose retinoic acid modulates rat calvarial osteoblast biology. J. Cell Physiol. 202, 255-262. 10.1002/jcp.20115 [DOI] [PubMed] [Google Scholar]
- Soprano D. R. and Soprano K. J. (1995). Retinoids as teratogens. Annu. Rev. Nutr. 15, 111-132. 10.1146/annurev.nu.15.070195.000551 [DOI] [PubMed] [Google Scholar]
- Spoorendonk K. M., Peterson-Maduro J., Renn J., Trowe T., Kranenbarg S., Winkler C. and Schulte-Merker S. (2008). Retinoic acid and Cyp26b1 are critical regulators of osteogenesis in the axial skeleton. Development 135, 3765-3774. 10.1242/dev.024034 [DOI] [PubMed] [Google Scholar]
- Teitelbaum S. L. (2000). Bone resorption by osteoclasts. Science 289, 1504-1508. 10.1126/science.289.5484.1504 [DOI] [PubMed] [Google Scholar]
- Teitelbaum S. L. (2011). The osteoclast and its unique cytoskeleton. Ann. N. Y. Acad. Sci. 1240, 14-17. 10.1111/j.1749-6632.2011.06283.x [DOI] [PubMed] [Google Scholar]
- Tiefenbach J., Moll P. R., Nelson M. R., Hu C., Baev L., Kislinger T. and Krause H. M. (2010). A live zebrafish-based screening system for human nuclear receptor ligand and cofactor discovery. PLoS ONE 5, e9797 10.1371/journal.pone.0009797 [DOI] [PMC free article] [PubMed] [Google Scholar]
- To T. T., Witten P. E., Renn J., Bhattacharya D., Huysseune A. and Winkler C. (2012). Rankl-induced osteoclastogenesis leads to loss of mineralization in a medaka osteoporosis model. Development 139, 141-150. 10.1242/dev.071035 [DOI] [PubMed] [Google Scholar]
- Vanoevelen J., Janssens A., Huitema L. F. A., Hammond C. L., Metz J. R., Flik G., Voets T. and Schulte-Merker S. (2011). Trpv5/6 is vital for epithelial calcium uptake and bone formation. FASEB J. 25, 3197-3207. 10.1096/fj.11-183145 [DOI] [PubMed] [Google Scholar]
- Varani J., Mitra R. S., Gibbs D., Phan S. H., Dixit V. M., Mitra R. Jr, Wang T., Siebert K. J., Nickoloff B. J. and Voorhees J. J. (1990). All-trans retinoic acid stimulates growth and extracellular matrix production in growth-inhibited cultured human skin fibroblasts. J. Invest Dermatol. 94, 717-723. 10.1111/1523-1747.ep12876294 [DOI] [PubMed] [Google Scholar]
- Venkatesh B., Lee A. P., Ravi V., Maurya A. K., Lian M. M., Swann J. B., Ohta Y., Flajnik M. F., Sutoh Y., Kasahara M. et al. (2014). Elephant shark genome provides unique insights into gnathostome evolution. Nature 505, 174-179. 10.1038/nature12826 [DOI] [PMC free article] [PubMed] [Google Scholar]
- Walker E. R., Frederickson R. G. and Mayes M. D. (1989). The mineralization of elastic fibers and alterations of extracellular matrix in pseudoxanthoma elasticum. Ultrastructure, immunocytochemistry, and X-ray analysis. Arch. Dermatol. 125, 70-76. 10.1001/archderm.1989.01670130072009 [DOI] [PubMed] [Google Scholar]
- Warren S. M., Greenwald J. A., Nacamuli R. P., Fong K. D., Song H. J. M., Fang T. D., Mathy J. A. and Longaker M. T. (2003). Regional dura mater differentially regulates osteoblast gene expression. J. Craniofac. Surg. 14, 363-370. 10.1097/00001665-200305000-00015 [DOI] [PubMed] [Google Scholar]
- Weinreb M., Shinar D. and Rodan G. A. (1990). Different pattern of alkaline phosphatase, osteopontin, and osteocalcin expression in developing rat bone visualized by in situ hybridization. J. Bone Miner. Res. 5, 831-842. 10.1002/jbmr.5650050806 [DOI] [PubMed] [Google Scholar]
- Xiong J., Onal M., Jilka R. L., Weinstein R. S., Manolagas S. C. and O'Brien C. A. (2011). Matrix-embedded cells control osteoclast formation. Nat. Med. 17, 1235-1241. 10.1038/nm.2448 [DOI] [PMC free article] [PubMed] [Google Scholar]
- Yamate T., Mocharla H., Taguchi Y., Igietseme J. U., Manolagas S. C. and Abe E. (1997). Osteopontin expression by osteoclast and osteoblast progenitors in the murine bone marrow: demonstration of its requirement for osteoclastogenesis and its increase after ovariectomy. Endocrinology 138, 3047-3055. 10.1210/en.138.7.3047 [DOI] [PubMed] [Google Scholar]
- Zhang J., Smith D., Yamamoto M., Ma L. and McCaffery P. (2003). The meninges is a source of retinoic acid for the late-developing hindbrain. J. Neurosci. 23, 7610-7620. [DOI] [PMC free article] [PubMed] [Google Scholar]
- Zhao S., Kato Y., Zhang Y., Harris S., Ahuja S. S. and Bonewald L. F. (2002). MLO-Y4 osteocyte-like cells support osteoclast formation and activation. J. Bone Miner. Res. 17, 2068-2079. 10.1359/jbmr.2002.17.11.2068 [DOI] [PubMed] [Google Scholar]
- Zhao C., Irie N., Takada Y., Shimoda K., Miyamoto T., Nishiwaki T., Suda T. and Matsuo K. (2006). Bidirectional ephrinB2-EphB4 signaling controls bone homeostasis. Cell Metab. 4, 111-121. 10.1016/j.cmet.2006.05.012 [DOI] [PubMed] [Google Scholar]