Abstract
Background:
This study was to establish a disease differentiation model for ST-segment elevation myocardial infarction (STEMI) youth patients experiencing ischemia and reperfusion via ultra-performance liquid chromatography and mass spectrometry (UPLC/MS) platform, which searches for closely related characteristic metabolites and metabolic pathways to evaluate their predictive value in the prognosis after discharge.
Methods:
Forty-seven consecutive STEMI patients (23 patients under 45 years of age, referred to here as “youth,” and 24 “elderly” patients) and 48 healthy control group members (24 youth, 24 elderly) were registered prospectively. The youth patients were required to provide a second blood draw during a follow-up visit one year after morbidity (n = 22, one lost). Characteristic metabolites and relative metabolic pathways were screened via UPLC/MS platform base on the Kyoto encyclopedia of genes and genomes (KEGG) and Human Metabolome Database. Receiver operating characteristic (ROC) curves were drawn to evaluate the predictive value of characteristic metabolites in the prognosis after discharge.
Results:
We successfully established an orthogonal partial least squares discriminated analysis model (R2X = 71.2%, R2Y = 79.6%, and Q2 = 55.9%) and screened out 24 ions; the sphingolipid metabolism pathway showed the most drastic change. The ROC curve analysis showed that ceramide [Cer(d18:0/16:0), Cer(t18:0/12:0)] and sphinganine in the sphingolipid pathway have high sensitivity and specificity on the prognosis related to major adverse cardiovascular events after youth patients were discharged. The area under curve (AUC) was 0.671, 0.750, and 0.711, respectively. A follow-up validation one year after morbidity showed corresponding AUC of 0.778, 0.833, and 0.806.
Conclusions:
By analyzing the plasma metabolism of myocardial infarction patients, we successfully established a model that can distinguish two different factors simultaneously: pathological conditions and age. Sphingolipid metabolism is the top most altered pathway in young STEMI patients and as such may represent a valuable prognostic factor and potential therapeutic target.
Keywords: Early-onset Myocardial Infarction, Metabolomics, Potential Biomarker, Sphingolipid Metabolism, Ultra-performance Liquid Chromatography-Mass Spectrometry
INTRODUCTION
Compared to older patients, acute myocardial infarction (AMI) is quite rare in individuals younger than 45 years. Epidemiological data also show that younger survivors have different cardiovascular risk factors and clinical manifestations than the elderly.[1] Many previous studies have focused on the relationship between genetic susceptibility and plaque formation, rupture, and thrombosis;[2] however, it is now commonly accepted that differing genetic factors are not the single factor in morbidity in young AMI patients.[3] Metabolomics techniques, which are relatively new, can provide more and better information for researching AMI pathogenesis.[4]
Metabolomics is a biological research method that, in essence, measures changes in the patient when certain stimuli or interference factors are introduced; this method focuses on the biological system as well as the end products affected by disparate genotypes and environments.[5] Advanced technologies such as ultra-performance liquid chromatography and mass spectrometry (UPLC/MS) help researchers identify a disease or monitor its progression from blood and urine samples, and fosters more comprehensive, real-time understanding of the related phenotypes of disease statuses.[6] In a study we conducted previously, we utilized UPLC/MS technology to find that compared to healthy volunteers, multiple metabolite levels were already changed significantly before ischemia/reperfusion (I/R) in the plasma of ST-segment elevation myocardial infarction (STEMI) patients; further, these characteristic metabolites showed a high diagnostic ability.[7]
The aim of the present study was to identify the plasma characteristic metabolites and related metabolic pathways of young STEMI patients experiencing I/R via UPLC/MS platform and to evaluate their prognostic value after discharge.
METHODS
Chemical reagents and instruments
All solvents were high-performance liquid chromatography grade and used without modification. Formic acid and acetonitrile (ACN) were obtained from Merck (KGaA Merck, Germany). Distilled water was produced using a Milli-Q Reagent Water System (Millipore, Billerica, MA, USA). UPLC was performed on a Thermo Fisher Accela System (Thermo Fisher Scientific, Franklin, MA, USA). MS was performed on a Thermo Fisher (Thermo Fisher Scientific, Franklin, MA, USA) LTQ Orbitrap XL hybrid mass spectrometer. Other equipment included a Multifuge X1R High-speed Centrifuge (Thermo Fisher Scientific, USA).
Subjects
For the purposes of this prospective study, we enrolled 95 patients who were divided into four groups: the youth patient group (18–44 years old, AY group, n = 23) and elderly patient group (65–80 years old, AO group, n = 24), patients were screened continuously from 405 STEMI patients treated from August 2013 to August 2014. Patients from two control groups (24 youth, NY group; 24 elderly, NO group) were selected at the same time and within approximately the same age range after a physical examination. The youth patients were required to provide a second blood draw during a follow-up visit 1 year after morbidity (SY group, n = 22, one lost). Because male patients comprised a dominant proportion of AMI morbidity in young adults (21/23, 91.3%), we selected a matched proportion of males in the healthy youth control group, healthy elderly control group, and AMI group.
Entry criteria
The definition of STEMI was established according to the third universal definition of myocardial infarction symptoms.[8] Patients with the following conditions were excluded: (1) secondary to nonatherosclerotic disease, (2) history of AMI, and (3) combination with cardiac shock, infection, liver or renal insufficiency, malignant tumor, or endocrine or metabolic diseases.
Ethics statement
All samples were collected in accordance with the ethical guidelines and written consent protocols mandated by our hospital.
Sample collection and pretreatment
Three milliliters of venous blood were drawn from the peripheral vein immediately after successful primary percutaneous coronary intervention, defined as the recovered blood flow of the culprit vessel to TIMI3, and preserved in an ethylene diamine tetra acetic acid anticoagulant tube. The blood was then centrifuged to separate the plasma and preserved at −80°C until analysis. Just before analysis, the samples were thawed at room temperature, mixed with 100 µl plasma and 400 µl methanol, intensely vibrated for 30 s, and incubated at 4°C for 5 min to precipitate the protein; finally, the mixture was centrifuged at 15,000 ×g for 30 min at 4°C, then the supernatant was filtrated through a 0.22 µm membrane and analyzed. Equivalent volumes of some of the fluid from each sample were mixed for quality control (QC).
Sample analysis
Chromatography conditions were as follows. Mobile phase: Phase A: 0.1% formic acid (volume ratio); Phase B: 95% ACN and 0.1% formic acid. Chromatographic separation was performed isocratically within 15 min, and the injection volume was 10 µl. The flow rate was set at 200 µl/min. The sample manager and column oven temperature were set at 4°C and 20°C, respectively. The chromatographic elution gradient was initialized at 5% Phase B and held for 3 min. In consecutive 10 min periods, Phase B was gradually escalated to 50%, and then a rapid increase in Phase B to 95% was completed within 3 min. After 4 min of maintaining the high volume of organic phase gradient, Phase B was immediately reduced to 5% and this elution gradient was used to balance the analytical column for the final 4 min.
MS was operating in the positive ion mode with an ion source voltage of 4.5 kV, a capillary voltage of 30 V, cone voltage of 150 V, desolvation temperature of 275°C, sheath gas flow of 30 arb, and assistant gas flow of 5 arb (99.999% nitrogen). Data were collected over 15 min in centroid mode over the mass range 50–1000 m/z. The MS resolution was at 100,000 full-width half maximum, and the calibration standards were provided by Thermo Fisher Scientific (Caffeine, Ultramark 1621 and MRFA). MS/MS analysis was carried out with collision-induced dissociation collision energy 35 (normalization collision energy) and the collision gas was 99.999% helium.
There were 22 QC samples throughout the test (equal volume mixture of each analyzed sample). Before the samples were tested, ten QC samples were analyzed continuously and the remaining QC samples were inserted into the sequence after every ten samples were analyzed.
The sequence of samples was randomly generated by the Excel function before and after sample analysis (including QC), and cross-contamination was avoided by inserting a blank between adjacent samples. The whole experiment lasted 2100 min.
Data process
The data were treated as previously described.[9] Briefly, with the help of MZmine 2.0 and SIMCA-P + 12.0.1.0 (Umetrics AB, Umea, Sweden), the orthogonal partial least squares discriminated analysis (OPLS-DA) supervised model was established. The variances were evaluated by SPSS 16.0 software (IBM, Chicago, USA), using two independent-sample nonparametric tests.
RESULTS
Comparison of clinical and biochemical parameters between groups
There were no significant differences in indexes between AO and NO group. Compared to the NY group, the AY group showed higher rates of diabetes, active smoking, and body mass index and lower density lipoprotein cholesterol levels. Compared to the AO group, the AY group showed higher body mass index, active smoking, hemoglobin, urea nitrogen, myocardial enzyme peak value, cholesterol, and triglyceride levels and lower high-density lipoprotein cholesterol (HDL-C) and Gensini scores [Table 1].
Table 1.
Clinical and biochemical characteristics in patient and control groups
| Characteristics | AY (n = 23) | NY (n = 24) | AO (n = 24) | NO (n = 24) |
|---|---|---|---|---|
| BMI (kg/m2) | 27.03 ± 3.77*,† | 24.58 ± 3.04 | 23.14 ± 2.96 | 23.98 ± 4.02 |
| S2B (h) | 4.8 ± 2.6 | – | 5.3 ± 2.1 | – |
| Hypertension, n (%) | 11 (47.8) | 5 (20.8) | 14 (58.3) | 10 (41.7) |
| Diabetes mellitus, n (%) | 9 (39.1)* | 0 (0) | 5 (20.8) | 8 (33.3) |
| Active smoke, n (%) | 17 (73.9)*,† | 8 (33.3) | 9 (37.5) | 12 (50) |
| Gensini score | 42.6 ± 23.6† | – | 62.6 ± 27.1 | – |
| Hemoglobin (g/L) | 155.52 ± 13.16† | 152.88 ± 9.66 | 133.65 ± 21.15 | 138.83 ± 11.40 |
| Platelet count (×109/L) | 238.35 ± 57.09 | 216.13 ± 53.25 | 209.70 ± 79.44 | 197.79 ± 54.40 |
| Peak CKMB value (U/L) | 178.74 ± 51.70† | 135.38 ± 55.37 | ||
| Urea nitrogen (mmol/L) | 5.49 ± 1.06† | 4.85 ± 1.14 | 6.81 ± 2.44 | 5.73 ± 1.03 |
| Serum creatinine (μmol/L) | 73.10 ± 15.06 | 72.91 ± 9.40 | 72.51 ± 23.66 | 69.35 ± 12.10 |
| Triglyceride (mmol/L) | 2.63 ± 2.88† | 1.60 ± 0.82 | 1.21 ± 0.74 | 1.28 ± 0.60 |
| Cholesterol (mmol/L) | 5.10 ± 1.49† | 4.37 ± 0.69 | 4.72 ± 1.38 | 4.74 ± 0.84 |
| HDL-C (mmol/L) | 0.97 ± 0.31† | 1.12 ± 0.26 | 1.25 ± 0.36 | 1.37 ± 0.45 |
| LDL-C (mmol/L) | 3.06 ± 1.05* | 2.40 ± 0.53 | 3.06 ± 1.06 | 2.69 ± 0.69 |
| LVEF (%) | 48.59 ± 8.94 | – | 45.04 ± 7.59 | – |
Data are shown as mean ± SD.*AY versus NY, P<0.05; †AY versus AO, P<0.05. BMI: Body mass index; S2B: Duration of syndrome to balloon; HDL-C: High-density lipoprotein cholesterol; LDL-C: Low-density lipoprotein cholesterol; LVEF: Left ventricular eject fraction; SD: Standard deviation; AY: youth patient group; NY: youth control group: AO: elderly patient group; NO: elderly control group.
Data pretreatment and quality control analysis
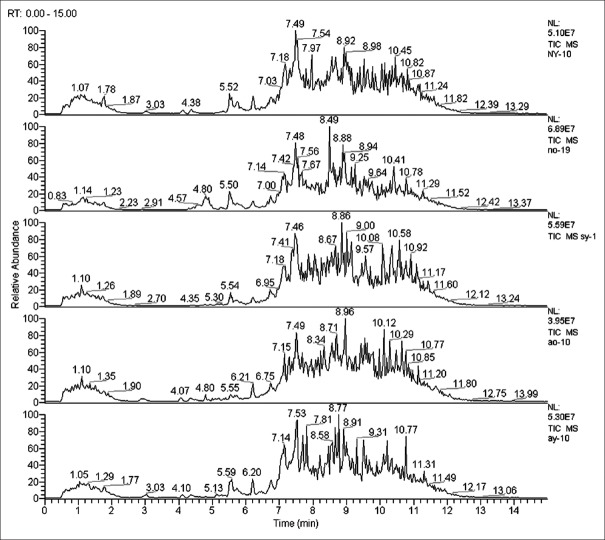
Figure 1 shows the total ion chromatograms obtained from the UPLC/MS platform where differences in content between dozens of metabolites were identified. The data were imported into MZmine 2.0 software for pretreatment and standardization where 380 and 412 integral peaks were, respectively, detected in the ion chromatography extracted from QC and test samples.
Figure 1.
Total ion chromatogram of metabolic profiles in different groups (one sample chosen randomly). AY: Youth AMI group; AO: Elderly AMI group; NY: Youth control group; NO: Elderly control group; SY: One year after AY morbidity.
The stability of the UPLC/MS system was assessed by analyzing the QC samples throughout the entire period. The principal component analysis (PCA) of 22 data sets of QC samples was used to establish a PCA model with three principal components. Figure 2 shows the score plot of the QC sample sequence versus the first principal component [t(1)]. In the test sample sequence, a QC sample was inserted after every ten test samples to evaluate the stability of the system during the entire analytical process; results showed that the detection system was indeed stable throughout the experiment after the first ten QC samples were injected (we set our QC standard according to a previously published article).[10] All the QC samples we inserted qualified, which allowed us to confirm that the analytical results were valid.
Figure 2.
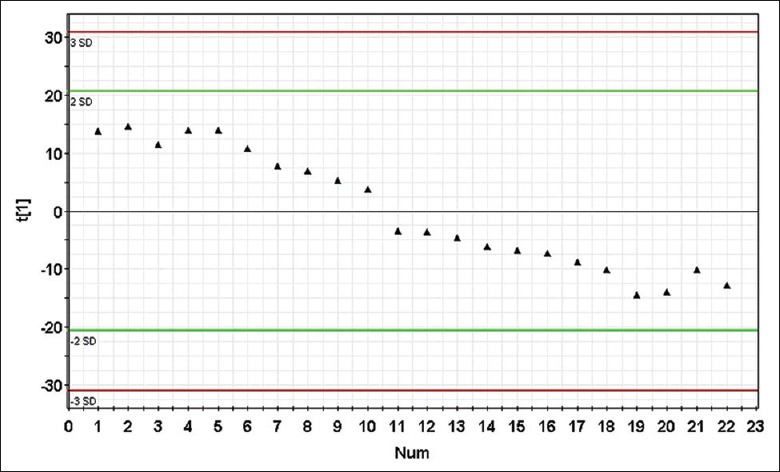
Score plot of principal component [t(1)] for quality control principal component analysis model. Each point represents a quality control sample. The detection system was stable throughout the experiment after the first 10 quality control samples were injected (no outliers exceeding ± 2 standard deviation were detected in the quality control samples), the icon of t(1) represents the first principal component.
Different metabolic profiles among groups
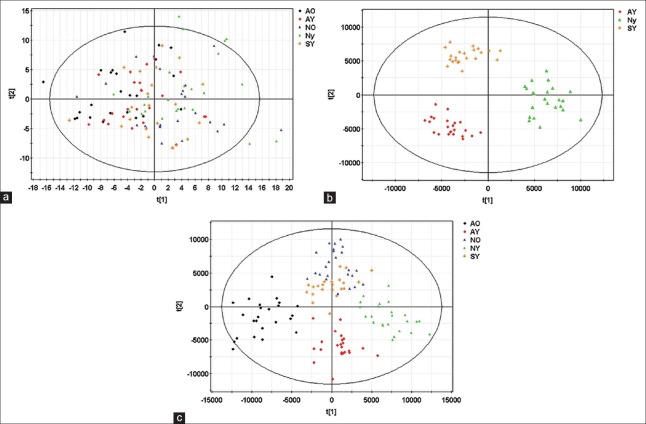
A PCA model with six principal components (R2X = 30.3%, Q2 = 13.2%) was established and the score plot of its first two principal components drawn as shown in Figure 3a. The clustering trends among groups were not obvious in the direction of the principal components, so we established an OPLS-DA model [Figure 3b] with four predictive principal components and eight orthogonal principal components (R2X = 71.2%, R2Y = 79.6%, Q2 = 55.9%). There were significant distinguishing clustering trends between each group in the score plot of its principal component – in short, the OPLS-DA model made sufficient distinction between groups.
Figure 3.
Metabolic profiles of plasma samples distinguish different groups. (a) Score plot of the first two components [t(1)/t(2)] of the plasma metabolic profiling principal component analysis model; (b) score plot of metabolic profiling orthogonal partial least squares discriminated analysis model; (c) score plot of metabolic profiling orthogonal partial least squares discriminated analysis model in youth patients. Every point in the figure represents a sample. The icons of t(1) and t(2) represent the first and second principal component, respectively.
Metabolic profiling distinguishes youth patient group disease states
An OPLS-DA model (R2X = 61.6%, R2Y = 88.7%, Q2 = 70.7%) with two predictive principal components and five orthogonal principal components was established for the 69 specimens from youth patient groups (AY, NY, SY). Figure 3c shows the score plot of the first predictive principal component and first orthogonal principal component where significant distinguishing clustering trends between the three groups were found in the first predictive principal component direction. The SY group was located between AY and NY groups, suggesting that the OPLS-DA model successfully distinguished the evolution of AMI in the youth patients.
Screening and identification of characteristic metabolites
Again, metabolites with distinguishing characteristics were selected in the established OPLS-DA model.[9] A total of 24 identified metabolites were identified as listed in Table 2.
Table 2.
Metabolite identification results and the difference between patient groups
| m/z | RT (min) | Metabolite | Ionospheric models | AO versus NO‡ | AY versus NY‡ | AY versus AO§ | SY versus NY‡ |
|---|---|---|---|---|---|---|---|
| 510.354 | 7.95221 | LysoPC(17:0) | M+H | Down† | Down† | Down† | – |
| 546.352 | 8.58423 | LysoPC(18:0) | M+Na | Down† | Down† | – | Down† |
| 508.375 | 8.03549 | LysoPC(P-18:0) | M+H | Down† | Down† | – | Down† |
| 506.359 | 8.58556 | LysoPC(P-18:1(9Z)) | M+H | Down† | Down† | – | Down† |
| 522.354 | 7.66455 | LysoPC(18:1(11Z)) | M+H | Down† | Down† | – | – |
| 550.386 | 8.77023 | LysoPC(20:1(11Z)) | M+H | Down† | Down† | – | Down† |
| 540.305 | 6.80829 | LysoPC(18:3(6Z,9Z,12Z)) | M+Na | Down† | Down† | Up* | – |
| 570.352 | 7.86944 | LysoPC(20:2(11Z,14Z)) | M+Na | Down† | Down† | – | Down† |
| 487.286 | 8.57992 | PA(20:4(5Z,8Z,11Z,14Z) e/2:0) | M+H | Down† | Down* | Up† | Down* |
| 556.529 | 10.4299 | Cer(t18:0/16:0) | M+H | Up† | Up† | Up* | Up* |
| 544.338 | 7.11841 | LysoPC(20:4(5Z,8Z,11Z,14Z)) | M+H | Down* | – | – | – |
| 302.305 | 6.72781 | Sphinganine | M+H | Up* | Up* | – | – |
| 356.351 | 7.40061 | Catelaidic acid | M+NH4 | Up† | Up† | – | Up* |
| 312.326 | 7.28137 | Phytal | M+NH4 | Up† | Up* | Down* | – |
| 495.248 | 4.54762 | Leukotriene D5 | M+H | Up† | – | – | – |
| 484.464 | 9.44252 | Cer(d18:0/12:0) | M+H | Up† | Up† | Up† | Up† |
| 284.294 | 6.74211 | Octadecanamide | M+H | Up† | Up† | – | – |
| 346.331 | 6.74818 | 2-hydroxyphytanic acid | M+NH4 | – | Up† | – | – |
| 118.065 | 1.75456 | Guanidoacetic acid | M+H | – | Down† | – | – |
| 270.144 | 5.74974 | Threoninyl-lysine | M+Na | – | Down† | – | Down† |
| 314.228 | 5.75407 | 9-decenoylcarnitine | M+H | – | Down† | – | – |
*P<0.05; †P<0.01; ‡Compared with control group, §Compared with AO group. Cer: Ceramide; –: No significant difference.
Plasma metabolites among groups
Two independent-sample nonparametric tests were used to compare differences in metabolic profiles between two patient groups [Table 2]. The levels of phospholipid (glycerophosphatide, sphingolipid) metabolites, as well as some free fatty acids and amino acids, were significantly up- or down-regulated. Compared to the AO group, guanidoacetic acid and 9-decenoylcarnitine, threoninyl-lysine, and 2-hydroxyphytanic acid were the unique differential metabolites of youth STEMI patients after I/R. Compared to the NY group, the levels of threoninyl-lysine, phosphatidic acid, catelaidic acid, and ceramide (Cer) in the SY group also showed significant differences.
Metabolic pathways and functional analysis in youth patients
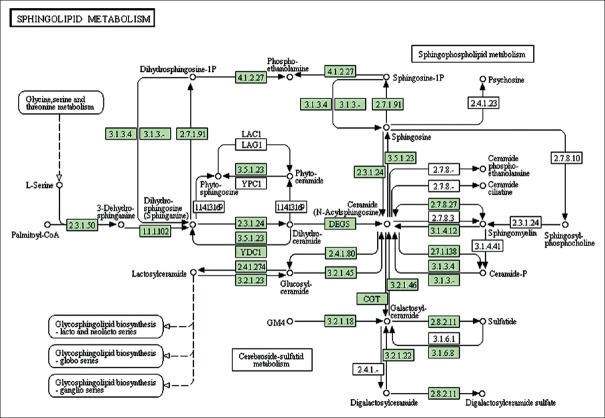
We used MetaboAnalyst 3.0 (The Wishart Research Group, Canada) to analyze the above most relevant metabolic pathways in greater detail. Results are shown in Figure 4 where the four principle pathways that most closely represented differences in metabolites between AY and NY groups were sphingolipid metabolism, glycerolphospholipid metabolism, glycine/serine/threonine metabolism, and arginine/proline metabolism; sphingolipid metabolism was the top most altered pathway. The results are also listed in Table 3, and the related pathway structures are shown in Figure 5.
Figure 4.
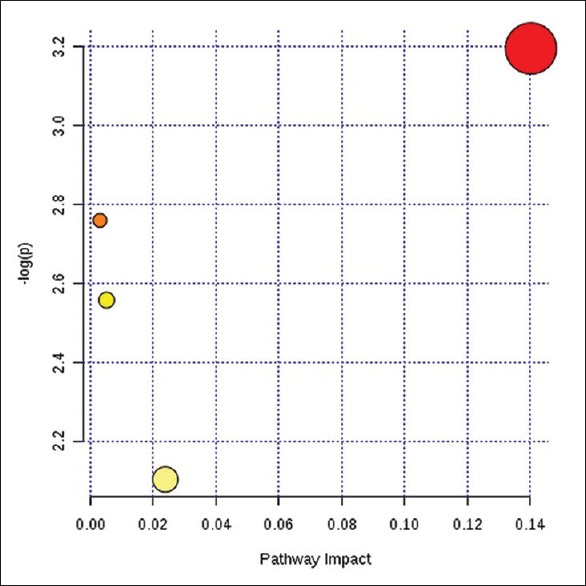
Pathway analysis summary.
Table 3.
Pathway analysis results
| Items | Total | Expected | Hits | Raw P | −log(P) | Impact |
|---|---|---|---|---|---|---|
| Sphingolipid metabolism | 25 | 0.04 | 1 | 4.09E-02 | 3.20E+00 | 0.104 |
| Glycerophospholipid metabolism | 39 | 0.06 | 1 | 6.33E-02 | 2.76E+00 | 0.00 |
| Glycine, serine, and threonine metabolism | 48 | 0.08 | 1 | 7.75E-02 | 2.56E+00 | 0.01 |
| Arginine and proline metabolism | 77 | 0.13 | 1 | 1.22E-01 | 2.10E+00 | 0.02 |
Figure 5.
Systemic analysis of metabolic changes in acute myocardial infarction pathogenesis. Each of the disturbed metabolites detected was searched in the KEGG database, and each KEGG pathway was scored according to the influence of the metabolic pathway (this map was generated from the KEGG reference map). Green boxes represent currently recognized enzymes in human beings.
Sphingolipids in youth patient prognoses
We next investigated the predictive value of sphingolipid metabolism on major adverse cardiovascular events (MACE), a summation of readmission caused by AMI, unstable angina, heart failure, malignant arrhythmia, or sudden cardiac death, in the AY group after discharge; a total of four patients had MACE at the 1-year follow-up. We also performed receiver operating characteristic (ROC) curve analysis on the predictive value of plasma Cer and sphinganine in the AY and SY groups as shown in Figures 6 and 7. All area under curves were larger than 0.7 excepted for Cer (d18:0/16:0) in the AY group, suggesting that the three biomarkers may be effective predictive factors for prognosis in youth patients after discharge [Table 4].
Figure 6.
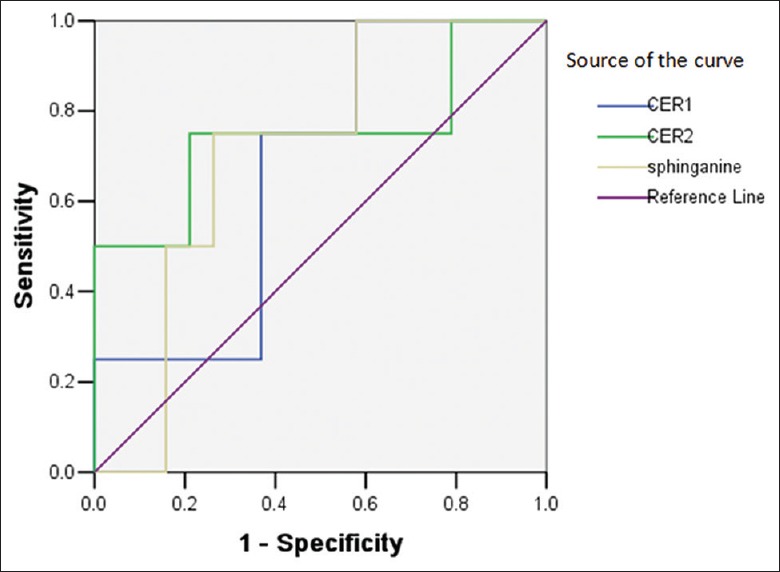
Receiver operating characteristic curve analysis of sphingolipid biomarkers ceramide and sphinganine to predict major adverse cardiovascular events of youth patients with acute myocardial infarction after discharge; Cer1: Cer (d18:0/16:0), Cer2: Cer (t18:0/12:0).
Figure 7.
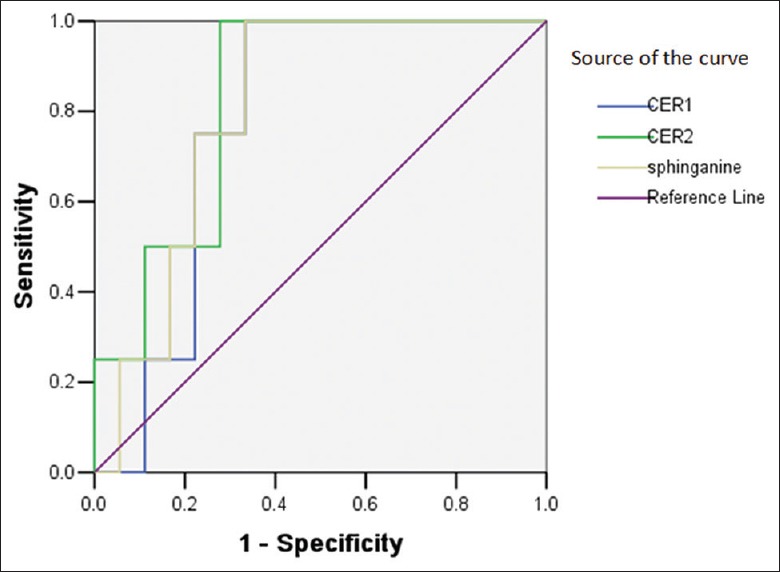
Receiver operating characteristic curve analysis of sphingolipid biomarkers ceramide and sphinganine to validate predictive value in youth patients one year after morbidity.
Table 4.
ROC curves of sphingolipid biomarker levels for predicting MACE in young patients after discharge
| Marker | Cut-off value | Sensitivity (%) | Specificity (%) | AUC | P | 95% CI* |
|---|---|---|---|---|---|---|
| AY group | ||||||
| Cer(d18:0/16:0) | 1,385,000 | 100.00 | 42.11 | 0.671 | 0.292 | 0.411–0.931 |
| Cer(t18:0/12:0) | 465,214 | 75.00 | 78.95 | 0.750 | 0.123 | 0.421–1.079 |
| Sphinganine | 8,950,000 | 75.00 | 73.68 | 0.711 | 0.194 | 0.474–0.947 |
| SY group | ||||||
| Cer(d18:0/16:0) | 1,170,000 | 100.00 | 66.67 | 0.778 | 0.089 | 0.589–0.967 |
| Cer(t18:0/12:0) | 462,514 | 100.00 | 72.22 | 0.833 | 0.041 | 0.654–1.103 |
| Sphinganine | 7,430,000 | 100.00 | 66.67 | 0.806 | 0.061 | 0.622–0.989 |
*Null hypothesis: True area: 0.5. CI: Confidence interval; ROC: Receiver operating characteristic; MACE: Major adverse cardiovascular events; AUC: Area under curve; Cer: Ceramide.
DISCUSSION
Even after receiving timely reperfusion and the best possible drug therapy, there is still a considerable portion of young patients who fail to recover cardiac function after AMI diagnosis – or worse, whose cardiac health continue to decline after treatment.[11] Early onset of myocardial infarction is most likely caused by a significant disruption in the body's metabolic system;[12] thus, metabolomics can provide a direct molecular signature of cells that reflect changes in phenotypes and molecular physiology, and as such are very helpful for exploring pathogenesis and treatment efficacy.[13] Laborde et al., for example, identified 15 metabolites with statistically significant differences from plasma samples of patients with non ST-segment elevation acute coronary syndrome and healthy controls using a gas chromatography MS platform; they found that the metabolites reflect myocardial cells subjected to oxidative stress and hypoxia.[14] The metabolic pathway of STEMI patients (especially young patients) has seen relatively little research.
In this study, the main components of the OPLS-DA model we established involved AMI and age. In other words, these two factors created the most obvious distinction among the groups we tested. We comparatively analyzed the metabolic profiles of patients of different ages post-I/R as well as corresponding healthy controls, and identified metabolites that are closely related to the main component of the cell membrane, and therefore to cell proliferation, differentiation, apoptosis, and biological energy supply.[15] By analyzing potential metabolites, as well as related interactions and pathways in youth STEMI patients based on the KEGG and Human Metabolome Database, we ultimately found that sphingolipid metabolism was the top most altered metabolic factor related to AMI prognosis.
By means of UPLC/MS technology, we found in a previous study that there are significant changes between the phospholipid levels of AMI patients before I/R treatment compared to healthy controls – specifically, glycerophospholipid is significantly down-regulated and most sphingomyelin are up-regulated.[7] We found similar changes in phospholipid metabolic pathways after emergency reperfusion therapy in the infarction zone of youth STEMI patients, in accordance with our previously published results; moreover, as discussed above, sphingolipid metabolism was the top most altered metabolic factor. Sphingosine, Cer, and sphingosine-1-phosphate (S1P), the primary members of the metabolic pathway involved, are crucial cell membrane components that reciprocally transform to maintain homeostasis by enzymatic reaction.[16]
Importantly, increases in sphingosine and Cer levels can cause reduction of S1P. Sphingosine also is a signal transduction factor of tumor necrosis factor-alpha (TNF-α), the level of synthesis and secretion of which is positively correlated with the amount of myocardial cell necrosis during AMI. As the mediator of TNF-α, sphingosine synthesized in cardiomyocytes can cause reduced myocardial contractility and increased myocardial cell apoptosis due to calcium overload.[17,18] Cer is the hub of the sphingolipid metabolism pathway, which involves cell response to ischemic stress and I/R injury, as well as activation of endogenous and exogenous apoptotic pathways through receptor-independent mechanisms.[19,20] It can be generated de novo or by hydrolysis of membrane sphingomyelin by sphingomyelinase.[20] In a study on rat hearts, researchers discovered that Cer levels increased after I/R whether isolation perfusion occurred in vivo or in vitro[21,22,23] although the degree to which they increase can be partially mitigated by ischemic preconditioning.[23,24] By contrast, its metabolite S1P has a protective effect on against ischemia and apoptosis in the pathogenesis of myocardial infarction.[21,25,26] The level of S1P in the heart after I/R is more than 50% lower than in control myocardium (which can also be partially prevented by preconditioning).[22] Duan et al. found that transfer of adenovirus-mediated sphingosine kinase1 gene can prevent myocardial injury caused by I/R and attenuate ischemic heart failure,[27] and Knapp et al. found that the ratio of S1P to Cer is significantly decreased at several time points after STEMI in rats, which is the cause of increased myocardial cell apoptosis in the noninfarct zone after myocardial infarction.[28] In this study, as discussed above, we found that changes in Cer in young patients were much more dramatic than those in the elderly patient group – this may have been related to the lack of coronary collateral circulation for ischemia preconditioning and to more severe cardiomyocyte apoptosis after I/R injury in the younger patients. The peak of myocardial enzymes in the AY group was also higher than that in the AO group, which further supports this argument. We also found that the proportion of abnormal lipid spectra in the AY group was higher than the corresponding control or NY group, reflecting lower HDL-C and higher low-density lipoprotein cholesterol (LDL-C) in these patients. The increase in LDL oxidation may have had a positive correlation with plasma Cer levels, representing a risk factor for atherosclerosis.[29] The reduction of HDL had a significant relationship with lifestyle in the youth patients as well, including smoking habits, obesity, and larger carbohydrate intake.[30] Previous researchers found through in vivo experiments that HDL and its component S1P act quickly to protect the heart from I/R injury, with potential inhibitory mechanisms on inflammatory cell recruitment and myocardial cell apoptosis in the infarction area as related to S1P-mediated and nitric oxide (NO)-dependent pathways.[31,32,33,34] Sphingosine kinase is a major rate-limiting enzyme in the cellular synthesis of S1P and regulates both Cer and S1P by reducing Cer to generate S1P; to this effect, when up-regulated, it can promote cell proliferation and alleviate apoptosis.[25,26] Acute administration of recombinant S1P-containing HDL has been shown to restore normal endothelial function in an NO-dependent manner;[33,35,36] thus, a rapid therapeutic elevation of HDL plasma levels may benefit myocardial infarction patients.[37]
In this study, we also found that even after receiving timely reperfusion and optimized medication, the SY group still showed higher Cer levels than young healthy controls, indicating that even the most cutting-edge AMI treatment strategies still do not effectively restore balance to the sphingolipid metabolism pathway. This may be related to the recurrence of acute coronary events after discharge. ROC curve analysis also suggested that Cer and sphinganine are both sensitive and specific markers for MACE prediction in young patients. Taken together, these results suggest that sphingolipid metabolism pathway homeostasis is not only a prognosis predictor but also a potential therapeutic target for improving the outcome of young AMI patients.
This study has some limitations. Our sample size was relatively small and the follow-up was relatively short. A larger sample size and lengthier follow-up after treatment remain necessary to confirm our findings. Further testing that includes metabolic urine profiling will also make the results more reliable.
In conclusion, we determined via UPLC/MS platform that sphingolipid metabolism is the top most altered pathway in youth STEMI patients experiencing I/R. Some key components in this pathway thus may be predictors for adverse cardiovascular events after discharge, and recovery of its homeostasis may be a promising therapeutic target.
Financial support and sponsorship
This work was partly supported by research grants from General Item of Science and Technology Fund of Tianjin Municipal Bureau of Health (Nos. 2014KY01 and 09KZ14).
Conflicts of interest
There are no conflicts of interest.
Footnotes
Edited by: Yi Cui
REFERENCES
- 1.Bhatia LC, Naik RH. Clinical profile of acute myocardial infarction in elderly patients. J Cardiovasc Dis Res. 2013;4:107–11. doi: 10.1016/j.jcdr.2012.07.003. doi: 10.1016/j.jcdr.2012.07.003. [DOI] [PMC free article] [PubMed] [Google Scholar]
- 2.Turcato S, Turnbull L, Wang GY, Honbo N, Simpson PC, Karliner JS, et al. Ischemic preconditioning depends on age and gender. Basic Res Cardiol. 2006;101:235–43. doi: 10.1007/s00395-006-0585-4. 10.1007/s00395-006-0585-4. [DOI] [PubMed] [Google Scholar]
- 3.Incalcaterra E, Caruso M, Balistreri CR, Candore G, Lo Presti R, Hoffmann E, et al. Role of genetic polymorphisms in myocardial infarction at young age. Clin Hemorheol Microcirc. 2010;46:291–8. doi: 10.3233/CH-2010-1353. doi: 10.3233/CH.2010.1353. [DOI] [PubMed] [Google Scholar]
- 4.Heather LC, Wang X, West JA, Griffin JL. A practical guide to metabolomic profiling as a discovery tool for human heart disease. J Mol Cell Cardiol. 2013;55:2–11. doi: 10.1016/j.yjmcc.2012.12.001. doi: 10.1016/j.yjmcc.2012.12.001. [DOI] [PubMed] [Google Scholar]
- 5.Barderas MG, Laborde CM, Posada M, de la Cuesta F, Zubiri I, Vivanco F, et al. Metabolomic profiling for identification of novel potential biomarkers in cardiovascular diseases. J Biomed Biotechnol 2011. 2011:790132. doi: 10.1155/2011/790132. doi: 10.1155/2011/790132. [DOI] [PMC free article] [PubMed] [Google Scholar]
- 6.Griffin JL, Atherton H, Shockcor J, Atzori L. Metabolomics as a tool for cardiac research. Nat Rev Cardiol. 2011;8:630–43. doi: 10.1038/nrcardio.2011.138. doi: 10.1038/nrcardio.2011.138. [DOI] [PubMed] [Google Scholar]
- 7.Zhang L, Gao J, Zhang F, Zhang L, Kang H, Liu S. Investigation of serum metabolic profiling in acute myocardium infarction (in Chinese) Chin J Lab Med. 2013;36:1022–6. doi: 10.3760/cma.j.issn.1009.9158.2013.11.013. [Google Scholar]
- 8.Thygesen K, Alpert JS, Jaffe AS, Simoons ML, Chaitman BR, White HD. Joint ESC/ACCF/AHA/WHF Task Force for Universal Definition of Myocardial Infarction; Authors/Task Force Members Chairpersons, et al. Third universal definition of myocardial infarction. J Am Coll Cardiol. 2012;60:1581–98. doi: 10.1016/j.jacc.2012.08.001. doi: 10.1016/j.gheart.2012.08.001. [DOI] [PubMed] [Google Scholar]
- 9.Liu SY, Zhang RL, Kang H, Fan ZJ, Du Z. Human liver tissue metabolic profiling research on hepatitis B virus related hepatocellular carcinoma. World J Gastroenterol. 2013;19:3423–32. doi: 10.3748/wjg.v19.i22.3423. doi: 10.3748/wjg.v19.i22.3423. [DOI] [PMC free article] [PubMed] [Google Scholar]
- 10.Dunn WB, Broadhurst D, Brown M, Baker PN, Redman CW, Kenny LC, et al. Metabolic profiling of serum using ultra performance liquid chromatography and the LTQ orbitrap mass spectrometry system. J Chromatogr B Analyt Technol Biomed Life Sci. 2008;871:288–98. doi: 10.1016/j.jchromb.2008.03.021. doi: 10.1016/j.jchromb.2008.03.021. [DOI] [PubMed] [Google Scholar]
- 11.Lee SH, Kim JH, Jeong MH, Park H, Jeong YA, Ahn Y, et al. Clinical characteristics and outcomes of acute ST segment elevation myocardial infarction in younger Korean adults. Korean Circ J. 2015;45:275–84. doi: 10.4070/kcj.2015.45.4.275. doi: 10.4070/kcj.2015.45.4.275. [DOI] [PMC free article] [PubMed] [Google Scholar]
- 12.Goonewardena SN, Prevette LE, Desai AA. Metabolomics and atherosclerosis. Curr Atheroscler Rep. 2010;12:267–72. doi: 10.1007/s11883-010-0112-9. doi: 10.1007/s11883-010-0112-9. [DOI] [PMC free article] [PubMed] [Google Scholar]
- 13.Senn T, Hazen SL, Tang WH. Translating metabolomics to cardiovascular biomarkers. Prog Cardiovasc Dis. 2012;55:70–6. doi: 10.1016/j.pcad.2012.06.004. doi: 10.1016/j.pcad.2012.06.004. [DOI] [PMC free article] [PubMed] [Google Scholar]
- 14.Laborde CM, Mourino Alvarez L, Posada Ayala M, Alvarez Llamas G, Serranillos Reus MG, Moreu J, et al. Plasma metabolomics reveals a potential panel of biomarkers for early diagnosis in acute coronary syndrome. Metabolomics. 2014;10:414–24. doi: 10.1007/s11306-013-0595-9. doi: 10.1007/s11306-013-0595-9. [DOI] [PMC free article] [PubMed] [Google Scholar]
- 15.Borodzicz S, Czarzasta K, Kuch M, Cudnoch Jedrzejewska A. Sphingolipids in cardiovascular diseases and metabolic disorders. Lipids Health Dis. 2015;14:55. doi: 10.1186/s12944-015-0053-y. doi: 10.1186/s12944-015-0053-y. [DOI] [PMC free article] [PubMed] [Google Scholar]
- 16.Gangoiti P, Camacho L, Arana L, Ouro A, Granado MH, Brizuela L, et al. Control of metabolism and signaling of simple bioactive sphingolipids: Implications in disease. Prog Lipid Res. 2010;49:316–34. doi: 10.1016/j.plipres.2010.02.004. doi: 10.1016/j.plipres.2010.02.004. [DOI] [PubMed] [Google Scholar]
- 17.Rana A, Sharma S. Mechanism of sphingosine 1 phosphate induced cardioprotection against I/R injury in diabetic rat heart: Possible involvement of glycogen synthase kinase 3β and mitochondrial permeability transition pore. Clin Exp Pharmacol Physiol. 2016;43:166–73. doi: 10.1111/1440-1681.12516. doi: 10.1111/1440 1681.12516. [DOI] [PubMed] [Google Scholar]
- 18.Shupik MA, Vanin AF, Alessenko AV. Interaction of the nitric oxide signaling system with the sphingomyelin cycle and peroxidation on transmission of toxic signal of tumor necrosis factor α in ischemia reperfusion. Biochemistry (Mosc) 2011;76:1197–209. doi: 10.1134/S0006297911110010. doi: 10.1134/S0006297911110010. [DOI] [PubMed] [Google Scholar]
- 19.Ichi I, Nakahara K, Miyashita Y, Hidaka A, Kutsukake S, Inoue K, et al. Association of ceramides in human plasma with risk factors of atherosclerosis. Lipids. 2006;41:859–63. doi: 10.1007/s11745-006-5041-6. doi: 10.1007/s11745-006-5041-6. [DOI] [PubMed] [Google Scholar]
- 20.Pan W, Yu J, Shi R, Yan L, Yang T, Li Y, et al. Elevation of ceramide and activation of secretory acid sphingomyelinase in patients with acute coronary syndromes. Coron Artery Dis. 2014;25:230–5. doi: 10.1097/MCA.0000000000000079. doi: 10.1097/MCA.0000000000000079. [DOI] [PubMed] [Google Scholar]
- 21.Karliner JS. Sphingosine kinase and sphingosine 1 phosphate in cardioprotection. J Cardiovasc Pharmacol. 2009;53:189–97. doi: 10.1097/FJC.0b013e3181926706. doi: 10.1097/FJC.0b013e3181926706. [DOI] [PMC free article] [PubMed] [Google Scholar]
- 22.Argaud L, Prigent AF, Chalabreysse L, Loufouat J, Lagarde M, Ovize M. Ceramide in the antiapoptotic effect of ischemic preconditioning. Am J Physiol Heart Circ Physiol. 2004;286:H246–51. doi: 10.1152/ajpheart.00638.2003. doi: 10.1152/ajpheart.00638.2003. [DOI] [PubMed] [Google Scholar]
- 23.Usta E, Mustafi M, Artunc F, Walker T, Voth V, Aebert H, et al. The challenge to verify ceramide's role of apoptosis induction in human cardiomyocytes – A pilot study. J Cardiothorac Surg. 2011;6:38. doi: 10.1186/1749-8090-6-38. doi: 10.1186/1749-8090-6-38. [DOI] [PMC free article] [PubMed] [Google Scholar]
- 24.Hofmann U, Hu K, Walter F, Burkard N, Ertl G, Bauersachs J, et al. Pharmacological pre and post conditioning with the sphingosine 1 phosphate receptor modulator FTY720 after myocardial ischaemia reperfusion. Br J Pharmacol. 2010;160:1243–51. doi: 10.1111/j.1476-5381.2010.00767.x. doi: 10.1111/j.1476 5381.2010.00767.x. [DOI] [PMC free article] [PubMed] [Google Scholar]
- 25.Karliner JS. Sphingosine kinase and sphingosine 1 phosphate in the heart: A decade of progress. Biochim Biophys Acta. 2013;1831:203–12. doi: 10.1016/j.bbalip.2012.06.006. doi: 10.1016/j.bbalip.2012.06.006. [DOI] [PMC free article] [PubMed] [Google Scholar]
- 26.Gomez L, Paillard M, Price M, Chen Q, Teixeira G, Spiegel S, et al. A novel role for mitochondrial sphingosine 1 phosphate produced by sphingosine kinase 2 in PTP mediated cell survival during cardioprotection. Basic Res Cardiol. 2011;106:1341–53. doi: 10.1007/s00395-011-0223-7. doi: 10.1007/s00395-011-0223-7. [DOI] [PMC free article] [PubMed] [Google Scholar]
- 27.Duan HF, Wang H, Yi J, Liu HJ, Zhang QW, Li LB, et al. Adenoviral gene transfer of sphingosine kinase 1 protects heart against ischemia/reperfusion induced injury and attenuates its postischemic failure. Hum Gene Ther. 2007;18:1119–28. doi: 10.1089/hum.2007.036. doi: 10.1089/hum.2007.036. [DOI] [PubMed] [Google Scholar]
- 28.Knapp M, Zendzian Piotrowska M, Kurek K, Blachnio Zabielska A. Myocardial infarction changes sphingolipid metabolism in the uninfarcted ventricular wall of the rat. Lipids. 2012;47:847–53. doi: 10.1007/s11745-012-3694-x. doi: 10.1007/s11745-012-3694-x. [DOI] [PubMed] [Google Scholar]
- 29.Waterman CL, Kian Kai C, Griffin JL. Metabolomic strategies to study lipotoxicity in cardiovascular disease. Biochim Biophys Acta. 2010;1801:230–4. doi: 10.1016/j.bbalip.2009.11.004. doi: 10.1016/j.bbalip.2009.11.004. [DOI] [PubMed] [Google Scholar]
- 30.Jain SR, Shah KH, Acharya HN, Barot K, Sharma KH. Prevalence and predictors of metabolic syndrome in young asymptomatic Gujarati population. Int J Chronic Dis 2015. 2015:365217. doi: 10.1155/2015/365217. doi: 10.1155/2015/365217. [DOI] [PMC free article] [PubMed] [Google Scholar]
- 31.Nofer JR, van der Giet M, Tölle M, Wolinska I, von Wnuck Lipinski K, Baba HA, et al. HDL induces NO dependent vasorelaxation via the lysophospholipid receptor S1P3. J Clin Invest. 2004;113:569–81. doi: 10.1172/JCI18004. doi: 10.1172/JCI200418004. [DOI] [PMC free article] [PubMed] [Google Scholar]
- 32.Levkau B, Hermann S, Theilmeier G, van der Giet M, Chun J, Schober O, et al. High density lipoprotein stimulates myocardial perfusion in vivo. Circulation. 2004;110:3355–9. doi: 10.1161/01.CIR.0000147827.43912.AE. doi: 10.1161/01.CIR.0000147827.43912.AE. [DOI] [PubMed] [Google Scholar]
- 33.Theilmeier G, Schmidt C, Herrmann J, Keul P, Schäfers M, Herrgott I, et al. High density lipoproteins and their constituent, sphingosine 1 phosphate, directly protect the heart against ischemia/reperfusion injury in vivo via the S1P3 lysophospholipid receptor. Circulation. 2006;114:1403–9. doi: 10.1161/CIRCULATIONAHA.105.607135. doi: 10.1161/CIRCULATIONAHA.105.607135. [DOI] [PubMed] [Google Scholar]
- 34.Egom EE, Mamas MA, Soran H. HDL quality or cholesterol cargo: What really matters – Spotlight on sphingosine 1 phosphate rich HDL. Curr Opin Lipidol. 2013;24:351–6. doi: 10.1097/MOL.0b013e328361f822. doi: 10.1097/MOL.0b013e328361f822. [DOI] [PubMed] [Google Scholar]
- 35.Bisoendial RJ, Hovingh GK, Levels JH, Lerch PG, Andresen I, Hayden MR, et al. Restoration of endothelial function by increasing high density lipoprotein in subjects with isolated low high density lipoprotein. Circulation. 2003;107:2944–8. doi: 10.1161/01.CIR.0000070934.69310.1A. doi: 10.1161/01.CIR.0000070934.69310.1A. [DOI] [PubMed] [Google Scholar]
- 36.Spieker LE, Sudano I, Hürlimann D, Lerch PG, Lang MG, Binggeli C, et al. High density lipoprotein restores endothelial function in hypercholesterolemic men. Circulation. 2002;105:1399–402. doi: 10.1161/01.cir.0000013424.28206.8f. doi: 10.1161/01.CIR.0000013424.28206.8F. [DOI] [PubMed] [Google Scholar]
- 37.Canals D, Perry DM, Jenkins RW, Hannun YA. Drug targeting of sphingolipid metabolism: Sphingomyelinases and ceramidases. Br J Pharmacol. 2011;163:694–712. doi: 10.1111/j.1476-5381.2011.01279.x. doi: 10.1111/j.1476 5381.2011.01279.x. [DOI] [PMC free article] [PubMed] [Google Scholar]


