

ABSTRACT
TPX2 is a widely conserved microtubule-associated protein that is required for mitotic spindle formation and function. Previous studies have demonstrated that TPX2 is required for the nucleation of microtubules around chromosomes; however, the molecular mechanism by which TPX2 promotes microtubule nucleation remains a mystery. In this study, we found that TPX2 acts to suppress tubulin subunit off-rates during microtubule assembly and disassembly, thus allowing for the support of unprecedentedly slow rates of plus-end microtubule growth, and also leading to a dramatically reduced microtubule shortening rate. These changes in microtubule dynamics can be explained in computational simulations by a moderate increase in tubulin–tubulin bond strength upon TPX2 association with the microtubule lattice, which in turn acts to reduce the departure rate of tubulin subunits from the microtubule ends. Thus, the direct suppression of tubulin subunit off-rates by TPX2 during microtubule growth and shortening could provide a molecular mechanism to explain the nucleation of new microtubules in the presence of TPX2.
KEY WORDS: Dynamic instability, Microtubule, Microtubule-associated protein, Mitosis
Summary: By measuring tubulin kinetics at microtubule tips and by performing simulations, we reveal a new mechanism for the action of TPX2 in microtubule nucleation and stabilization.
INTRODUCTION
In mitosis, the proper alignment and segregation of chromosomes requires attachment to dynamic microtubule ends (Desai and Mitchison, 1997; McIntosh et al., 2002; Maiato et al., 2004). Therefore, microtubules act as crucial chromosome transport machines during mitosis. Microtubule dynamics have been characterized by the term ‘dynamic instability’, in which microtubule tips transition from a slow growing state to a rapid shortening state through a ‘catastrophe’ event. A reverse transition can be achieved through a ‘rescue’ event (Mitchison and Kirschner, 1984). Experimental perturbation of microtubule dynamics leads to mitotic defects (Yvon et al., 1999), demonstrating that efficient and faithful segregation of chromosomes during mitosis relies on proper regulation of the length and number of microtubules in the mitotic spindle.
TPX2 is a widely conserved microtubule-associated protein that is required for mitotic spindle formation and function (Gruss and Vernos, 2004). TPX2 was originally identified as a protein that is required for the dynein-dependent accumulation of the Xenopus kinesin XKlp2 (human Kif15) at spindle poles (Wittmann et al., 1998). Experiments in vivo and with Xenopus egg extracts demonstrated that TPX2 is required for the Ran-regulated nucleation of microtubules in the chromosome pathway (Gruss et al., 2002; Tulu et al., 2006; Neumayer et al., 2014). Mammalian cells that have been depleted of TPX2 assemble defective spindles that contain large asters with few intervening microtubules, and fail to complete mitosis (Gruss et al., 2002). TPX2 binds to and activates the mitotic kinase Aurora A and localizes it to spindle microtubules (Bayliss et al., 2003). TPX2 also interacts with and regulates the activity of the bipolar mitotic kinesin Eg5 (Eckerdt et al., 2008; Ma et al., 2011) and kinesin-12 motors (Wittmann et al., 2000; Tanenbaum et al., 2009; Vanneste et al., 2009). Thus, TPX2 functions in part as a scaffold to bring mitotic regulators to spindle microtubules. Recent in vitro studies have demonstrated that TPX2 can promote the nucleation of microtubules in vitro (Roostalu et al., 2015; Wieczorek et al., 2015); however, the molecular mechanism by which this is accomplished remains incompletely understood.
By performing in vitro biophysical studies, we found that TPX2 acts to suppress the off-rate of individual tubulin subunits from the microtubule tip for both growing and shortening microtubules. Our simulation results suggest that a moderate change in tubulin–tubulin-bond stability for TPX2-associated tubulin subunits can suppress the departure rate of tubulin subunits from microtubule ends, thus newly revealing a mechanism for the action of TPX2 in microtubule nucleation and stabilization.
RESULTS
TPX2 slows tubulin subunit off-rates during microtubule assembly
Several previous studies have ascribed a role for TPX2 in microtubule nucleation, both in solution with purified components (Schatz et al., 2003; Wieczorek et al., 2015) and from existing microtubules in egg extracts (Petry et al., 2013). Previous work has also demonstrated that tubulin subunits arrive rapidly to the tip of the microtubule, but then unstable attachments result in a large tubulin subunit off-rate from the microtubule end, even during periods of net growth (Gardner et al., 2011b). Thus, to promote nucleation, TPX2 could potentially suppress the rate of tubulin subunit loss from the microtubule tip, such that subunits that incorporate at the microtubule end are less likely to leave.
Previous work has demonstrated that the variability in microtubule growth rate provides a readout for tubulin subunit on–off kinetics at the microtubule tip (Gardner et al., 2011b). In that report, a decrease in tubulin subunit arrival and departure events at the microtubule tip was shown to correspond with a decrease in the variability of microtubule growth, owing to a reduction in the total number of on–off events (Skellam, 1946; Oosawa, 1970). Thus, to evaluate microtubule growth rate variability in the presence and absence of TPX2, time-lapse movies of growing Alexa-488-labeled microtubules were collected using total internal reflection fluorescence (TIRF) microscopy, and then the microtubule tip position was evaluated with sub-pixel resolution by fitting the microtubule tip to a Gaussian decay function (as previously described by Demchouk et al., 2011) (TPX2 purification described by Ma et al., 2011; Gable et al., 2012) (Fig. 1A). Plots of microtubule tip position versus time for control microtubules (Fig. 1B, blue) qualitatively showed higher variability in growth rate as compared to similar plots of microtubule tip position in the presence of TPX2 (Fig. 1B, magenta), suggesting that TPX2 suppresses tubulin subunit on–off kinetics at the growing microtubule tip.
Fig. 1.
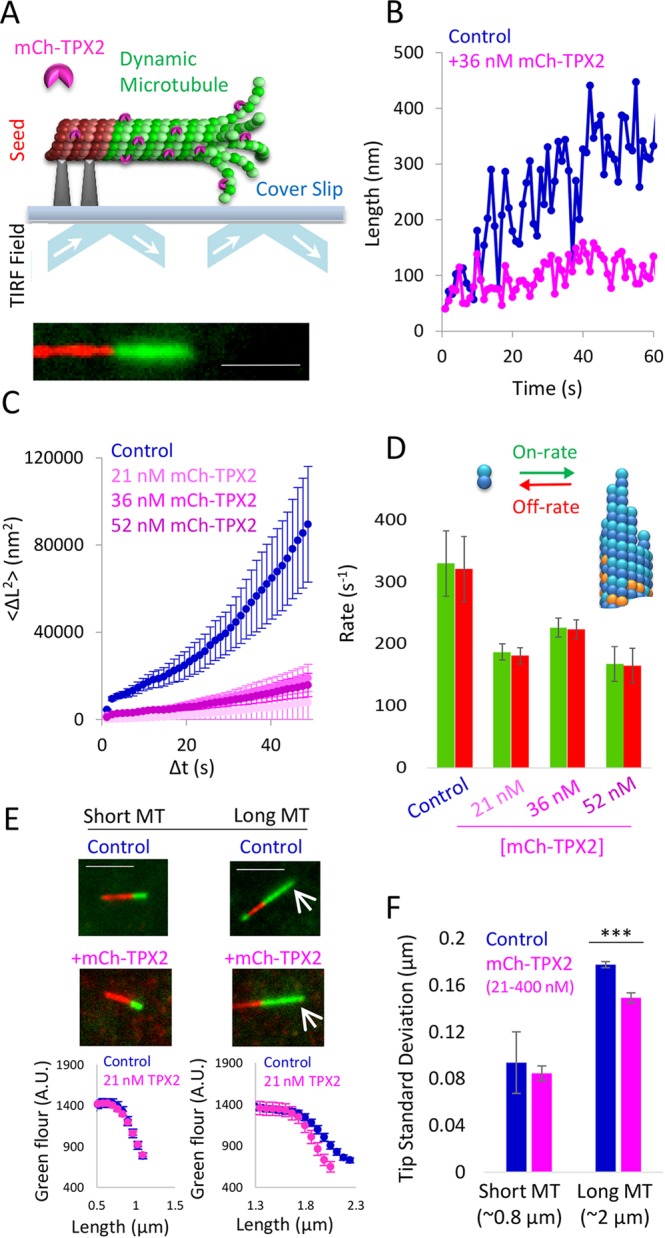
TPX2 suppresses off-kinetics of tubulin subunits for growing microtubules, as measured by evaluating microtubule growth variability. (A, top) Experimental setup for TIRF microscopy studies of dynamic microtubules with TPX2. (Bottom) Example of a dynamic microtubule growing from GMPCPP-stabilized seed (red, GMPCPP-stabilized Rhodamine-labeled seed; green, dynamic Alexa-Fluor-488 microtubule extension). Scale bar: 5 μm. (B) Example growth variability for control microtubules (blue) and microtubules in the presence of TPX2 (magenta). (C) MSD versus time step size (n≥500 growth displacements per trace). Mean measurement noise is 44 nm, by conservatively estimating that the displacement at Δt=1 s represents entirely noise. (D) Tubulin subunit on- and off-rates (mean±s.e.m.). (E) The tips of longer control microtubules appear dimmer (white arrow, top right), and are, therefore, more likely to be tapered as compared to the tips of longer TPX2-treated microtubules (white arrow, bottom right). Scale bar: 5 μm. Example quantitative results (bottom) shown for the 21 nM TPX2 concentration only (mean±s.e.m.). (F) Fitted tip standard deviation for short and long microtubules with and without TPX2 (mean±s.e.m., TPX2 results averaged over all concentrations; results for the individual concentrations of TPX2 are shown in Fig. S1). For long microtubules; P<0.0001, t-test; n≥100 microtubules of each length per condition.
By fitting the mean squared displacement (MSD) in microtubule tip position for increasing time step sizes to a diffusion–drift equation, the on- and off-rates of tubulin subunits from a growing microtubule tip can be quantitatively estimated (Gardner et al., 2011b). Thus, the MSD was plotted against increasing time step sizes for control microtubules (Fig. 1C) and with various concentrations of TPX2 (Fig. 1C), and this MSD was then used to directly estimate the on- and off-rates of tubulin subunits from the microtubule ends (see Materials and Methods). Consistent with qualitative observations (Fig. 1B), we observed a ∼40% decrease in tubulin subunit on- and off-rates for growing microtubules with TPX2 (Fig. 1D). We note that because the net growth rates of the microtubules are very slow in these experiments [due to low temperatures (26°C) and low tubulin concentrations], the net tubulin subunit addition rate over the net loss rate is small. Overall, these data indicate that TPX2 acts either directly or indirectly to slow tubulin subunit addition and loss at the microtubule tip.
Tip structures at microtubule ends are consistent with reduced tubulin subunit on–off kinetics in the presence of TPX2
To further test the idea that TPX2 acts either directly or indirectly to slow tubulin subunit addition and loss kinetics, we used TIRF microscopy to evaluate the tip structures at growing microtubule ends for control microtubules, and for microtubules in the presence of TPX2. Previous studies have shown that for longer microtubules, tubulin subunit on–off kinetics are correlated with microtubule tip structures, such that ‘blunt’ tip structures are associated with slower on–off kinetics, whereas more tapered tip structures are associated with more rapid on–off kinetics (Gardner et al., 2011b; Coombes et al., 2013). Therefore, we predicted that for longer microtubules, reduced tubulin subunit on–off kinetics in the presence of TPX2 would lead to more blunt tip structures, whereas faster kinetics in the absence of TPX2 would result in more tapered tip structures.
Images of microtubules grown in the presence and absence of TPX2 were collected (Fig. 1E, top), and the average green fluorescence intensity was plotted as a function of the position along the microtubule length (Fig. 1E, bottom). For short microtubules, the green microtubule-associated fluorescence dropped quickly to background levels, and was similar in the control and TPX2 experiments (Fig. 1E, left). By fitting a Gaussian distribution to this curve, the ‘tip standard deviation’ was calculated (see Materials and Methods) (Demchouk et al., 2011), which for short microtubules was similar between controls and TPX2 (P=0.8; Fig. 1F) and suggestive of a diffraction-limited ‘blunt’ tip in both cases (Coombes et al., 2013). In contrast, longer microtubules had a more gradual decrease in green channel intensity at the microtubule tip (Fig. 1E, right), which was reflected by a larger tip standard deviation (Fig. 1F) (Coombes et al., 2013). Importantly, the control microtubule tip standard deviations were larger than those for similar length microtubules that had been assembled in the presence of TPX2 [Fig. 1F, averaged over all TPX2 concentrations, P<0.0001 (t-test); see Fig. S1B for results of each concentration of TPX2], suggesting that the tips of control microtubules are more tapered relative to the tips of microtubules grown in the presence of TPX2. Thus, the microtubule tip structures, as estimated using fluorescence microscopy, were consistent with the idea that the tubulin subunit on–off kinetics were suppressed by TPX2 during microtubule growth.
TPX2 sequesters free tubulin subunits into complexes to reduce the effective free tubulin concentration
One possible explanation for the suppressed tubulin subunit on-rates in the presence of TPX2 (Fig. 1D) is that TPX2 reduces the effective tubulin concentration in solution by sequestering free tubulin into multi-subunit complexes (Gruss et al., 2002; Roostalu et al., 2015; Scrofani et al., 2015). If this is the case, suppressed tubulin subunit on-rates could be an indirect consequence of enhanced formation of tubulin–TPX2 nucleation complexes (Fygenson et al., 1995; Schek et al., 2007; Scrofani et al., 2015). To test this idea, reaction mixtures with and without 50 nM of TPX2, each containing 10 μM of Alexa-Fluor-488-conjugated tubulin with 0.6 mM GTP, were incubated in a tube at 37°C, and then small samples were removed after 5, 20 and 60 min. Each sample was immediately sandwiched between two coverslips that had been heated to 37°C and then imaged using TIRF microscopy. In the TPX2 samples, we observed an increase in many small structures over time, consistent with the findings of a recent study (Fig. 2A; Fig. S1C) (Roostalu et al., 2015). To quantify this effect, we measured the standard deviation of Alexa-Fluor-488-tagged tubulin fluorescence intensity at each time point because we reasoned that the non-uniformity of fluorescence across each image would provide an objective measure for the density of small diffraction-limited structures in each case. Consistent with qualitative observations, the standard deviation of the intensity of Alexa-Fluor-488 fluorescence increased substantially as a function of incubation time for the TPX2 samples, suggestive of increasing quantities of small diffraction-limited structures, whereas there was only a minimal change in standard deviation over time for the control samples that lacked TPX2 (Fig. 2B).
Fig. 2.

TPX2 suppresses off-kinetics of tubulin subunits for growing and shortening microtubules, as measured by evaluating growth and shortening rates. (A) Images of a tubulin solution, with and without TPX2, after 5 min (left) and 60 min (right) of incubation at 37°C. Scale bars: 12 μm; 2 μm (inset). Small structures were observed only in the presence of TPX2 (60 min) (see also Fig. S2). (B) Standard deviation of the intensity across images as a function of incubation time (boxes outline the center two quartiles, solid lines within a box indicate the median, dashed lines indicate upper and lower quartiles; n=100 for all experiments except 5 min in control, where n=50 images). The standard deviation of intensity would naturally be expected to increase with an increasing level of structure in the image, as an increase in background intensity alone would lead to a higher mean, but not to a higher standard deviation, of the intensity in the image. Therefore, increasing numbers of nucleation complexes in an image should lead to a higher standard deviation of the intensity in the image. Consistent with increased nucleation over time, images of mixtures containing TPX2 demonstrated increasing standard deviation in intensity over time. (C) Microtubules that were clearly visible were measured for each sample. Open circles represent individual microtubules (n≥160 microtubules for all experiments except 5 min in control, where n=63 microtubules). In the presence of TPX2, only short microtubules were detected. (D) Data reproduced from Fygenson et al., 1995 demonstrates the abrupt phase-shift from a growth (left, blue arrow) to a nucleation regime (right, magenta arrow). Data taken from figure 2 of Fygenson et al. (1995), reprinted with permission from the American Physical Society. Copyright 1995 by the American Physical Society. (E) Representative kymographs of dynamic microtubules in the presence of increasing concentrations of TPX2 (red, GMPCPP-stabilized seeds; green, Alexa-Fluor-488 dynamic microtubule extensions). In vitro microtubule dynamics assays were performed as previously described (Gell et al., 2010; Gardner et al., 2011a) with a measured temperature of 26°C in the chamber and 9 μM tubulin (15% labeled). (F) Growth rate of microtubules (mean±s.e.m.), (P<1×10⁻⁵, all TPX2 concentrations, t-test; n≥12 growth trajectories measured per condition). Green dotted line represents slowest previously reported growth rate from Gardner et al. (2011a). (G) Shortening rate of microtubules (mean±s.e.m.) (P<1×10⁻⁵, all TPX2 concentrations, t-test; n≥11 shortening trajectories per condition). (H) Cartoon illustrating conclusions from data presented in this figure and those presented in Fig. 1. TPX2 directly suppresses the off-rate of tubulin subunits from growing and shortening microtubule tips.
We then reasoned that, if the small structures present in the TPX2 samples represent complexes comprising multiple tubulin subunits, this might sequester free tubulin and, therefore, limit the average microtubule length, as compared to a tubulin-only solution, which would only rarely lead to stochastic nucleation of new microtubules. Therefore, we measured the lengths of all visible microtubules in each sample at each time point. Consistent with the idea that the presence of TPX2 leads to sequestration of tubulin, the few microtubules present in the tubulin-only controls continuously shifted towards longer lengths over time, whereas all visible microtubules remained short in the TPX2 sample (Fig. 2C).
These results are consistent with a model in which TPX2 acts to nucleate small multi-subunit tubulin complexes, reducing the effective free tubulin concentration that is available for microtubule polymerization and, therefore, indirectly suppressing the tubulin subunit on-rate. Thus, suppressed tubulin subunit on-rates are likely to be an indirect consequence of reduced effective free tubulin concentrations in solution and might not be a direct effect of TPX2 at the microtubule tip.
If TPX2 shifts the in vitro assay into a nucleation regime, this leads to two important predictions for the effect of TPX2 on microtubule dynamics in an in vitro assay. First, by sequestering tubulin into nucleation complexes, the resultant reduction in effective free tubulin concentration would be expected to reduce the observed net growth rate of microtubules. Second, previous studies have suggested that the phase-shift into a microtubule nucleation regime for an in vitro assay might be very abrupt [Fig. 2D, reprinted from figure 2 in Fygenson et al. (1995) with permission from the American Physical Society and shown only for emphasis], such that once free nucleation in solution becomes a relevant factor, free tubulin is quickly and abruptly sequestered into new nucleation complexes. If TPX2 acts to catalyze nucleation of new microtubules, this nucleation phase diagram predicts that there potentially is a ‘step-like’ reduction in the net growth rate of microtubules, rather than a gradual decrease in growth rate as a function of TPX2 concentration.
TPX2 directly suppresses tubulin subunit off-rates during microtubule growth and shortening
To test these predictions, time-lapse movies were collected to capture microtubule growth and shortening phases of Alexa-Fluor-488 labeled dynamic microtubules (Fig. 2E; Fig. S2).
First, we found that the microtubule growth rate was suppressed in the presence of TPX2 – on average, microtubules grew ∼45% slower in the presence of TPX2 relative to controls (Fig. 2F, P<1×10⁻⁵, all TPX2 concentrations, t-test), consistent with the idea that free tubulin concentrations are reduced in the presence of TPX2, owing to sequestration. In addition, there was a ‘step-like’ reduction in the net growth rate of microtubules, rather than a gradual decrease in growth rate upon introduction of TPX2, consistent with an abrupt transition to a nucleation regime in the presence of TPX2 (Fig. 2F). We also noted that, at higher TPX2 concentrations, the growth rate was slightly increased relative to that at lower TPX2 concentrations. We speculate that this could be due to the rising importance of a direct effect of TPX2 in suppressing tubulin subunit off-rates during microtubule growth because TPX2 concentrations were increased. Regardless, to our knowledge, the microtubule growth rates at all concentrations of TPX2 were slower than what has ever been previously observed in vitro, even at the lowest possible tubulin concentrations that can support seeded growth (Walker et al., 1988; Fygenson et al., 1994; Gardner et al., 2011a) (Fig. 2F, dotted line). This unprecedentedly slow microtubule polymerization rate in the presence of TPX2 is consistent with the idea that TPX2 stabilizes microtubules by suppressing tubulin subunit off-rates at the microtubule tip during periods of net assembly, which then allows for gradual microtubule growth even at low temperatures (26°C in our assay) and at potentially very low effective free tubulin concentrations.
We also observed a striking effect of TPX2 on the microtubule shortening rate after catastrophe – the microtubule shortening rate was substantially slowed in the presence of TPX2 relative to controls, even at the lowest TPX2 concentration tested (Fig. 2G). In contrast to the growth rate results, the microtubule shortening rates showed a consistently decreasing trend as a function of increasing TPX2 concentrations – the microtubule shortening rate after a catastrophe event was fourfold slower at 21 nM TPX2 (P<1×10⁻⁵, t-test), and more than 13-fold slower at a concentration of 400 nM TPX2 (P<1×10⁻⁵, t-test) (Fig. 2G). This result demonstrates that TPX2 directly suppresses the tubulin subunit off-rates at the microtubule tip during periods of net disassembly, in addition to during net assembly (Fig. 2H).
mCherry–TPX2 interacts with the microtubule lattice and tip
We then assessed whether TPX2 was directly interacting with the microtubule lattice and/or tips to alter tubulin subunit stability within the microtubule. Individual snapshots of mCherry–TPX2 on green Alexa-Fluor-488-labeled dynamic microtubules growing from far-red Alexa-Fluor-660-marked guanosine-5ʹ-[(α,β)-methyleno]triphosphate (GMPCPP)-stabilized microtubule seeds were collected (Fig. 3A, left), and plots of the average mCherry–TPX2 fluorescence on the Alexa-Fluor-488-labeled dynamic microtubules were generated [Fig. 3A, right, all microtubules normalized to a length of 4 μM to allow for mean localization analysis (Gardner et al., 2005)]. By performing this analysis over a large number of microtubules at the low and high TPX2 concentrations from the dynamics experiments, we found that in addition to a uniform coating of TPX2 along the microtubules, there was an enrichment of TPX2 on the GMPCPP-stabilized seeds (Fig. 3A, right, position 0.0 μm), and, on average, a slight enrichment at the microtubule tip (Fig. 3A, right, position 4.0 μm), thus confirming recent observations (Roostalu et al., 2015). To determine how TPX2 interacts with growing and shortening microtubules, we analyzed the localization of mCherry–TPX2 in kymographs of dynamic microtubules. Consistent with the snapshot data, TPX2 was associated both with the lattice and with the microtubule tip for both growing and shortening microtubules (Fig. 3B). Although high-intensity tracking of TPX2 on growing and shortening ends was not detected in the kymographs, the snap-shot data, which is averaged over many microtubule images, reveals a slight preference of TPX2 for microtubule ends. Taken together, these results demonstrate that TPX2 can interact with the microtubule tip and lattice to alter tubulin subunit off-rates of both growing and shortening microtubules.
Fig. 3.
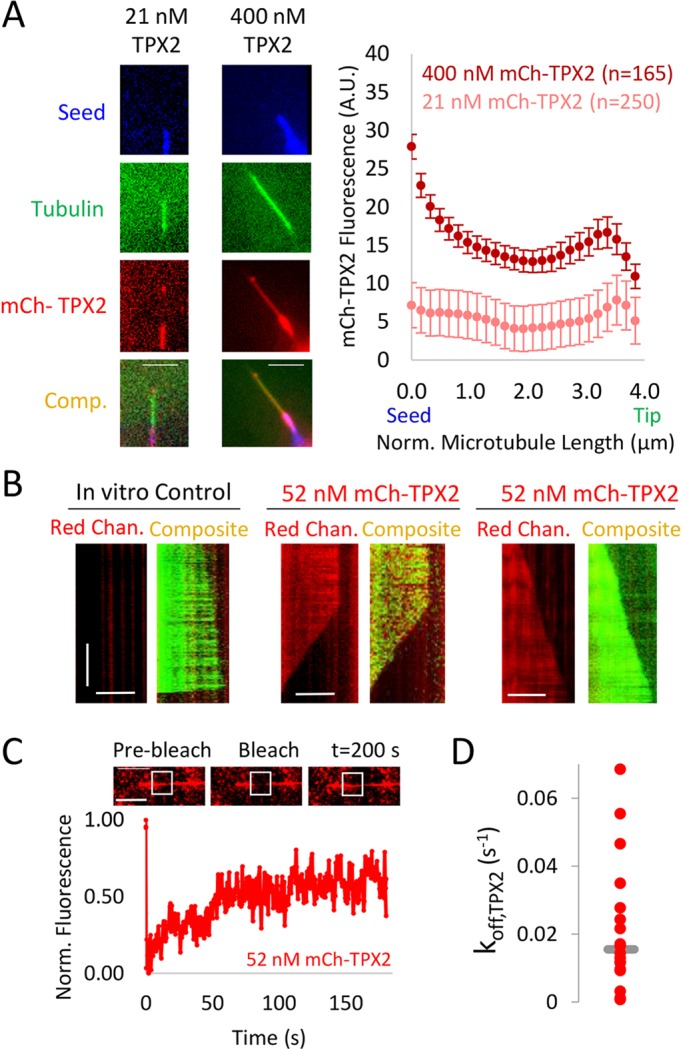
Interaction of TPX2 with microtubules. (A, left) Images of Alexa-Fluor-660-labeled (blue) GMPCPP-stabilized seeds, Alexa-Fluor-488 (green) dynamic microtubules growing from the GMPCPP-stabilized seeds and mCherry–TPX2 (red, mCh-TPX2), which is unevenly distributed on dynamic microtubules and seeds. Each column represents different concentrations of mCherry–TPX2. Scale bars: 5 μm. Comp, composite. (Right) Average distribution of mCherry–TPX2 on the dynamic microtubule extensions as a function of position. Microtubules were normalized (Norm.) to a length of 4 μm in order to combine data for multiple microtubules at each TPX2 concentration; stabilized seed transition on the left (0 μm), and the tip of the microtubule on the right (4 μm). (B) Kymographs of mCherry–TPX2 on growing and shortening microtubules. Scale bars: 10 μM (horizontal axis); 200 s (vertical axis). Chan., channel (C) FRAP of 52 nM mCherry–TPX2 on dynamic microtubules. All bleaching events were on dynamic microtubule extensions only, and not seeds, as verified by images taken before and after bleaching and recovery for each experiment. (D) Distribution of TPX2 off-rates (koff,TPX2) calculated from FRAP data (n=18 experiments). Median shown by gray line.
We then performed fluorescence recovery after photobleaching (FRAP) experiments to determine the dynamics of mCherry–TPX2 on the microtubule lattice in our in vitro experiments (Fig. 3C). To do this, we photobleached a portion of the dynamic microtubule extension in the red channel (e.g. avoiding the stabilized seeds), and then measured the integrated fluorescence in the photobleached area over time. We corrected for photobleaching using an unbleached portion of the lattice, and then fit an exponential recovery curve to each experiment according to:
| (1) |
where F is the integrated fluorescence in the bleached area over time, Fblch is the fluorescence at the time of bleaching, and Finf is the fluorescence after recovery is complete (Δt∼200 s) (Bulinski et al., 2001). This equation was then used to determine the off-rate of TPX2 from the lattice (koff,TPX2) for use in our simulations (below). The median value of koff,TPX2 was 0.015 s, with a corresponding characteristic residence time of τ∼65 s on the lattice, suggesting that TPX2 turns over relatively slowly on microtubules (Balchand et al., 2015). Finally, uniform recovery of TPX2 fluorescence across the bleaching window suggested that TPX2 binds and unbinds, but perhaps does not efficiently diffuse, on the microtubule lattice (Fig. 3C).
Simulations can explain TPX2-mediated changes in microtubule dynamics
To elucidate a mechanism for how transient interactions of TPX2 with dynamic microtubules might lead to the striking changes in microtubule dynamics we observed in our experiments, stochastic computational simulations were run, which included both the arrivals and departures of tubulin subunits from the microtubule tip (Fig. 4A, top), as well as stochastic on and off events of TPX2 from the microtubule lattice (Fig. 4A, bottom).
Fig. 4.
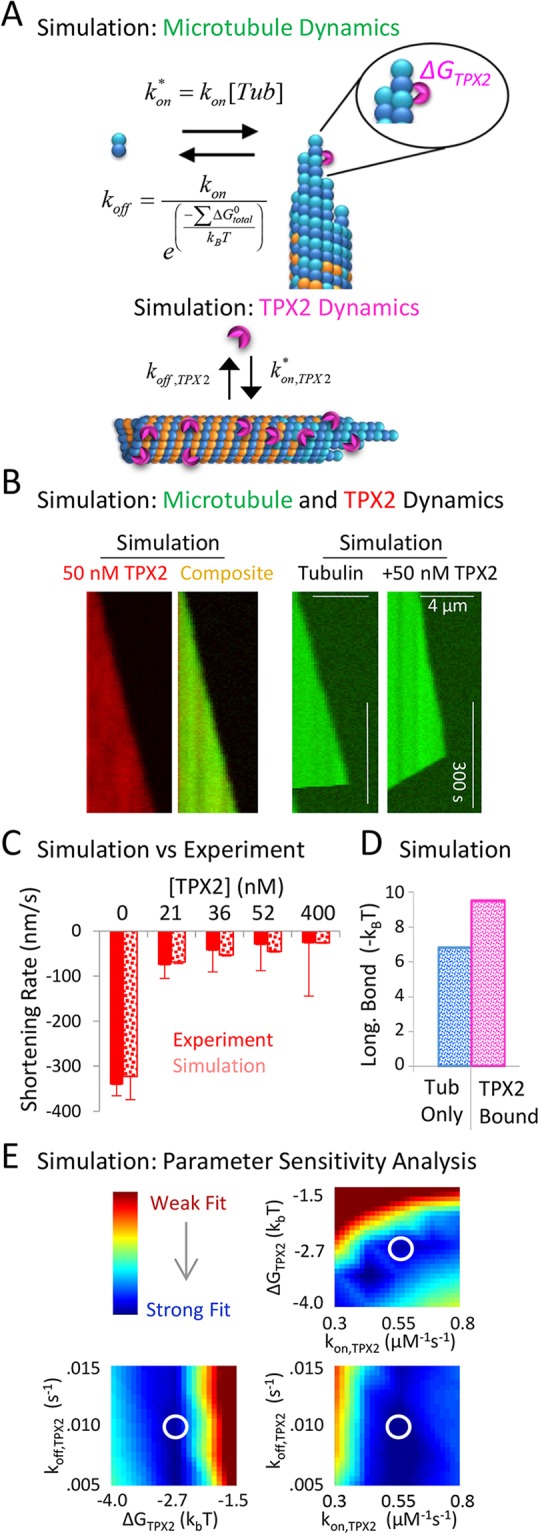
Simulations predict that TPX2 suppresses tubulin subunit off-rates by increasing tubulin–tubulin bond strengths. (A) Rules for microtubule dynamics simulation (top) and for TPX2 interactions with the microtubule (bottom). (B, left) Simulated kymographs of mCherry–TPX2 on a growing microtubule. (Right) Simulated kymograph to demonstrate the effect of TPX2 on microtubule depolymerization rate. (C) Microtubule shortening rates compared between experiments and simulations (mean±s.e.m.). (D) Simulation prediction for the change in tubulin–tubulin longitudinal (long.) bond strength upon binding of TPX2. Tub, tubulin. (E) Heat maps that demonstrate the relative goodness of fit to experimentally observed dynamics (see also Fig. S3). The parameter values used in B–D are within the white circles.
For the simulated interactions of TPX2 with the microtubule, TPX2 was allowed to randomly attach along the simulated microtubule lattice and at the microtubule tip, with no preference for tip or lattice interactions (see Materials and Methods), and the value for koff,TPX2 was matched to experimental data collected from the FRAP assay. Using these rules, we found that simulated mCherry–TPX2 was distributed along the microtubule lattice and at the tip during both growing and shortening events (Fig. 4B, left).
The microtubule dynamics model for tubulin subunit on–off kinetics has been well established by previous work (VanBuren et al., 2002, 2005; Schek et al., 2007; Gardner et al., 2011b; Castle and Odde, 2013) (see Materials and Methods). In this model, the off-rate kinetics for a given tubulin subunit from the microtubule tip were dictated by the relative energetic stability of that tubulin subunit within the microtubule lattice (koff,PF, Fig. 4A), where the energetic stability of each subunit was calculated by summing all of its relevant bond energies, as follows:
 |
(2) |
Here, ΔGtotal0 is the total bond-free energy of a bound tubulin subunit, ΔGlongitudinal0* is the GTP–tubulin longitudinal bond energy, ΔGlateral0 is the GTP–tubulin lateral bond energy, ΔGGDP_Pen is the GDP–tubulin energetic penalty for hydrolyzed subunits, and ΔGTPX2 is the stabilization energy that was supplied if TPX2 was bound to an incorporated tubulin subunit or its longitudinal neighbor. In the simulation, TPX2 was assumed to stabilize longitudinal interactions, although similar results were obtained using lateral bond stabilization. Using these rules, we found that simulated kymographs were similar to kymographs generated from experimental data for the effect of TPX2 on microtubule dynamics (Fig. 4B, right), in which there was a substantial effect on the simulated microtubule shortening rate for even modest concentrations of TPX2.
We then evaluated whether the simulation could reproduce the experimentally observed effects of TPX2 on microtubule dynamics over the experimental range of TPX2 concentrations. We found that simulations reproduced the concentration-dependent suppression of shortening rate over the wide range of experimental TPX2 concentrations (Fig. 4C, and also the effect of TPX2 on catastrophe frequency; Fig. S4A), by allowing for the stabilization of longitudinal tubulin–tubulin bonds when TPX2 was bound to a tubulin subunit (Fig. 4D). A simulation parameter sensitivity analysis demonstrated that a strong fit to experimental data could be obtained over a range of TPX2 simulation parameter values (Fig. 4E; Fig. S3), suggesting that the modeling results were consistent and not overly sensitive to specific parameter values. In addition, the parameter sensitivity analysis suggests that the effect of TPX2 on microtubule dynamics is most sensitive to the tubulin–tubulin bond stabilization energy provided by TPX2, and less sensitive to the rate of turnover of TPX2 on the lattice (Fig. 4E). Thus, transient interactions of TPX2 with the microtubule lattice could explain our experimental observations of substantial microtubule shortening rate suppression. Importantly, these changes in microtubule dynamics resulted from a relatively moderate stabilization of longitudinal tubulin bonds for the TPX2-bound tubulin subunits (−2.7 kBT, Fig. 4D), suggesting that TPX2 is able to produce significant microtubule stabilization effects with only a moderate influence on individual tubulin–tubulin bond stability. We note that although a microtubule tip preference by TPX2 was not required by our simulation to reproduce the experimental results, we expect that a tip preference would only increase the efficiency of TPX2 in suppressing microtubule assembly kinetics at the tip, perhaps reducing even further the necessary tubulin bond stabilization energy for individual TPX2-bound tubulin subunits.
For each simulated TPX2 concentration, we note that the effective tubulin concentration was adjusted in the simulation to match the corresponding experimentally observed microtubule growth rate, which accounts for tubulin sequestration (and, thus, the suppressed tubulin subunit on-rate) in the presence of TPX2 (Fig. S4B). However, to ensure that the simulated effects of TPX2 on microtubule dynamics were not due solely to these adjusted values for effective free tubulin concentration, additional simulations were run for each corresponding effective tubulin concentration, both with and without TPX2 present in the simulation (Fig. S4). In all cases, there was a clear effect of TPX2 on the simulated microtubule dynamics, over and above the effect of the tubulin concentration adjustments to account for sequestration (Fig. S4C,D).
DISCUSSION
In conclusion, we find that TPX2 acts to suppress the off-rate of tubulin subunits from the microtubule tip during both growth and shortening events. This is likely to stabilize the microtubule in its polymer form and, thus, contribute to microtubule nucleation. Consistent with previous reports, we also found that catastrophe frequency is suppressed in the presence of TPX2; however, control of the tubulin subunit off-rate from the microtubule tip might be a more fundamental form of microtubule stabilization than the regulation of switching between states because the loss of tubulin subunits from the tip would be attenuated by TPX2 for both growing and shortening microtubules. In addition, our simulations naturally reproduce the suppression of catastrophe in the presence of TPX2 as a direct result of the suppressed tubulin subunit off-rates, which is likely to be owing to increased retention of GTP–tubulin subunits at the microtubule tip, which would lead to a larger size of the GTP cap.
We note that in previous work, the effect of TPX2 on growth rate was more modest than that reported here (11% vs 45% reduction) (Wieczorek et al., 2015). This difference is likely to be due to the dissimilar temperatures used for the in vitro assays [30–31°C (Roostalu et al., 2015; Wieczorek et al., 2015) vs 26°C in the current study] because higher absolute temperatures are expected to exponentially increase the on-rate constant (kon) for tubulin subunits onto the microtubule tip (Arrhenius relationship), thus shifting the assay towards more rapid growth rates, regardless of the presence or absence of TPX2 (Fygenson et al., 1994).
Our simulations predict that the mechanism by which TPX2 suppresses tubulin subunit kinetics at the microtubule tip is by stochastically increasing the bond stability between adjacent tubulin subunits. We speculate that because TPX2 has been reported to have two domains that can bind to microtubules (Trieselmann et al., 2003; Vos et al., 2008), it can perhaps bind to two tubulin dimers simultaneously to strengthen the bond between them. Alternatively, oligomerization of TPX2 could allow for binding of two tubulin dimers simultaneously, thereby strengthening the bond between the tubulin dimers (Drechsler et al., 2014; Scrofani et al., 2015). We note that microtubule-associated proteins that exclusively bind to a single subunit in the microtubule lattice, such as a kinesin motor domain, might be less likely to stabilize the bonds between two adjacent tubulin subunits in the lattice, and would thus lack the ability to suppress the off-rate of tubulin subunits from the microtubule tip, even if the protein were to coat the entire microtubule.
We predict that TPX2 promotes nucleation of new microtubules through its ability to directly suppress the off-rate of tubulin subunits from the microtubule tip. In addition, our data suggest that TPX2 shifts the in vitro assay into a nucleation regime and, thus, indirectly suppresses the on-rate of new tubulin subunits onto the microtubule tip. However, our simulations predict that a treatment that could increase the tubulin subunit on-rate constant (kon) would ameliorate the indirect effect of TPX2-mediated tubulin sequestration on the microtubule growth rate (Fig. 5A), while still allowing for suppression of tubulin subunit off-rates through TPX2. Thus, we predict that a combination of TPX2, which would reduce the tubulin subunit off-rates to promote microtubule nucleation, and a microtubule-associated protein that could specifically increase the tubulin subunit on-rate, would lead to simultaneous microtubule nucleation and robust microtubule growth (Fig. 5B). Indeed, is has recently been reported that a combination of TPX2 and chTOG (also known as CKAP5 in mammals and XMAP215 in Xenopus) can produce strong synergistic nucleation and growth of new microtubules (Roostalu et al., 2015), suggesting that the multiple TOG domains of chTOG could act to increase the tubulin subunit on-rate at the microtubule tip, allowing for net growth, while TPX2 suppresses the tubulin subunit off-rate, thereby simultaneously promoting net nucleation and growth of new microtubules.
Fig. 5.
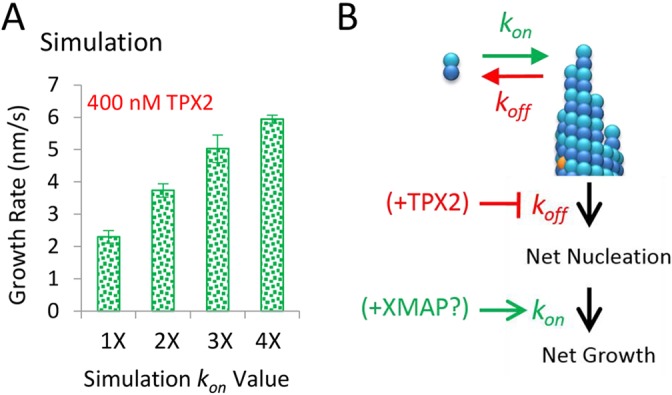
Simulations predict that an increased on-rate constant will directly impact microtubule growth rate in the presence of TPX2. (A) In the presence of 400 nM TPX2 (such that the tubulin subunit off-rate is suppressed and tubulin concentration is reduced), simulations predict that the growth rate will recover if the on-rate constant for the addition of tubulin subunits to the microtubules increases. (B) A simple model for synergistic manipulation of tubulin subunit on- and off-rates – suppression of tubulin subunit off-rates by TPX2, combined with increased tubulin subunit on-rates, potentially mediated by a microtubule-associated protein such as XMAP215, would simultaneously lead to both increased numbers and lengths of microtubules.
By measuring tubulin kinetics at microtubule tips and by performing simulations utilizing our experimentally measured parameters, our work reveals a novel mechanism for the action of TPX2 in microtubule nucleation and stabilization, in which TPX2 directly suppresses the off-rate of tubulin subunits from the microtubule tip. We speculate that the regulation of tubulin subunit on–off kinetics during microtubule growth and shortening constitutes a fundamental mechanism by which microtubule-associated proteins and microtubule-targeting drugs regulate microtubule dynamics and nucleation (Mohan et al., 2013). Future studies to evaluate the effect of other microtubule-associated proteins and drugs on microtubule assembly kinetics will be important for better understanding the mechanisms of the regulation of microtubule length in cells.
MATERIALS AND METHODS
Cloning
For expression in SF9 insect cells, full-length human TPX2 was cloned into the pFast Bac A vector after an N-terminal 6×His tag and the coding sequence for mCherry. The virus for infecting the cells was obtained following the Bac-to-Bac protocol (Invitrogen). All constructs were verified by sequencing.
Protein purification
Full-length mCherry–TPX2 was expressed and purified from SF9 cells using the Bac-to-Bac expression system (Invitrogen). Infected cells were harvested, washed with ice-cold water and resuspended in lysis buffer [50 mM potassium phosphate pH 8, 250 mM KCl, 40 mM imidazole, 1% NP-40, 10 mM β-mercaptoethanol and a protease inhibitor tablet (Roche)] on ice. The lysate was spun at 125,000 g for 45 min at 4°C. The supernatant was loaded onto pre-equilibrated Ni NTA agarose beads (Qiagen) for 90 min at 4°C with end-over-end shaking. The flow-through was removed, and the beads were washed with wash buffer (same as lysis buffer with 10% glycerol and 0.01% NP-40). The protein was eluted with elution buffer (50 mM potassium phosphate pH 7, 150 mM KCl, 250 mM imidazole, 10% glycerol, 10 mM β-mercaptoethanol and 0.01% NP-40) and dialyzed in a buffer containing 25 mM HEPES, pH 7.6, 10 mM KCl, 2 mM MgCl2, 10% glycerol, 0.01% NP-40 and 1 mM DTT for 4 h at 4°C. Aliquots were flash-frozen in liquid nitrogen and stored at −80°C.
Microtubule seeds
To make stabilized microtubule seeds, 3.9 µM tubulin purified from pig brain (25% Alexa-Fluor-660 labeled, 75% unlabeled) was combined with 1 mM GMPCPP in BRB80 (80 mM PIPES, 1 mM EGTA, 1 mM MgCl2, 100 mM KOH) to give a solution of a total volume of 45 µl. This was kept on ice for 5 min and then incubated at 37°C for 1–2 h. Following incubation, the seeds were diluted into 400 µl warm BRB80, and 350 µl of this dilution was spun down in an air-driven ultracentrifuge at 20 psi for 5 min. The supernatant was discarded, and the pellet resuspended into 200 µl of warm BRB80.
Construction and preparation of flow chambers for imaging
Imaging flow chambers were constructed as described in section VII of Gell et al. (2010), with the following modifications – two narrow strips of Parafilm replaced double-sided scotch tape as chamber dividers and, following placement of the smaller coverslip onto the Parafilm strips, the chamber was heated to melt the Parafilm and create a seal between the coverslips; typically only three strips of Parafilm were used, resulting in two chambers per holder. Chambers were coated with an antibody against Rhodamine, which was followed by blocking with Pluronic F127, as described in section VIII of Gell et al. (2010).
Microtubule dynamics assay and imaging
In vitro microtubule dynamics assays were performed as previously described (Gell et al., 2010; Gardner et al., 2011a). Specifically, a flow chamber was prepared as described above, set to 28°C using an objective heater on the microtubule stage (26°C actual temperature in chamber), and then 3–4 channel volumes of imaging buffer containing 110 μg/ml glucose oxidase, 20 μg/ml catalase, 20 nM d-glucose, 10 mM DTT, 0.1 mg/ml casein, 1% Tween-20 and 110 mM KCl, were flushed through the chamber. A reaction mixture containing 9 μM tubulin (15% labeled) and 1 mM GTP diluted into imaging buffer, both with and without TPX2, was then prepared and immediately allowed to flow into the imaging chamber, with drops left at the flow chamber ends to keep the flow chamber from drying out during imaging.
Dynamic microtubules were imaged on a Nikon TiE microscope using 488-nm and 561-nm lasers sent through a Ti-TIRF-PAU illuminator to generate TIRF illumination. An Andor iXon3 EM-CCD camera fitted with a 2.5× projection lens was used to capture images with a high signal-to-noise ratio and a small pixel size (64 nm). Slow time-lapse movies were collected in 2 s intervals using TIRF with a Nikon CFI Apochromat 100×1.49 NA oil objective; fast time-lapse movies were collected using no delay in the green channel only. Images for tip structure analysis were single time points only, to avoid complications from photobleaching. Bleaching events for all FRAP experiments were collected on dynamic microtubule extensions only, and not stabilized seeds, as verified by dual color images, which were collected before and after each bleaching experiment.
Image analysis – dynamic instability parameters
All movies of microtubule dynamic instability were transformed into kymographs using ImageJ. Then, catastrophe frequency was calculated by analyzing kymographs in which the entire microtubule lifetime could be observed, starting with growth from the seed, and ending with a catastrophe event. Catastrophe frequency was then calculated as the inverse of each lifetime. Owing to the relative rarity of rescue events, rescue frequency was calculated as the total number of rescue events over the entire combined observation time in each collected movie. Growth and shortening rates were calculated by clicking on growth and shortening trajectories using the ‘Particle Analysis – Manual Tracking’ ImageJ plugin, and then by importing the trajectories into Excel. Average growth and shortening rates were calculated in Excel by using linear regression to calculate the slope.
Individual images were analyzed using a custom MATLAB script, as previously described (Gardner et al., 2005).
Tip tracking and tip structure estimation using fluorescence microscopy
Microtubule tip tracking and tip structure analysis was performed as previously described (Demchouk et al., 2011; Gardner et al., 2011b; Coombes et al., 2013; Prahl et al., 2014). Briefly, tip structures were assessed, and microtubule tip tracking was performed with TIRF microscopy by fitting the error function to the fluorescence intensity of green Alexa-Fluor-488 at microtubule ends, which yields both the mean protofilament length as well as the standard deviation of protofilament lengths (σtip) (Demchouk et al., 2011). We expected that tips with a smaller σtip have relatively blunt tips, whereas tips with a larger σtip have more tapered tips. Using this approach, we quantified the distribution of tip standard deviations (σtip) for Alexa-Fluor-488-labeled microtubules of similar lengths grown under different experimental conditions.
Calculation of tubulin subunit on- and off-rates
Tubulin subunit on- and off-rates were calculated as previously described (Gardner et al., 2011b). Briefly, for a stochastic process, the variance in the number of events per time interval is equal to the mean number of events. Therefore, the variability in microtubule growth rate should reflect the underlying rates of subunit addition and loss. We calculated the MSD of microtubule length increments for increasing time steps, and then plotted the results for each experimental condition (Fig. 2B). By plotting the results in this manner, the fluctuations in the length of filament growth can be described by a diffusion with drift equation, as given by:
 |
(3) |
where ΔL is the microtubule length change increment (in nm) over a given time step Δt (in sec), vg is the net growth rate (nm/s), and Dp is the effective diffusion coefficient for the microtubule polymerization, which provides a quantitative measure of the variability in microtubule growth increments. Finally, σ2 is the experimental measurement noise.
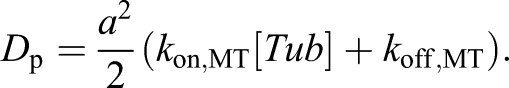
We fitted the experimental data to a quadratic equation in MATLAB, and estimated the diffusion coefficient (Dp) as well as the net growth rate (vg) using Eqn 3. The tubulin subunit on-rate (kon) and off-rate (koff) from the microtubule tip were then directly estimated from the MSD versus time data (Fig. 2B). The diffusion coefficient, Dp, relates the microtubule length MSD due to diffusion alone, 〈ΔlD2〉, to the time interval, Δt, via:
| (4) |
and the growth rate variance due to diffusion is described by a Skellam distribution (Skellam, 1946; Oosawa, 1970), so that:
| (5) |
where a is the change in microtubule length contributed by a single dimer, which is on average 0.615 nm. Combining Eqns 4 and 5 and solving for Dp we obtain:
 |
(6) |
In addition, by definition:
| (7) |
Therefore, through these two equations [Eqns 6 and 7], the two unknowns (kon and koff) were directly estimated for each experimental condition using the experimentally estimated values of Dp and vg.
Statistical analysis
All P-values were calculated using a t-test, assuming two samples with unequal variance.
Simulation methods
Microtubule dynamics
Microtubule dynamics simulations were performed using MATLAB (MathWorks, Version 8.2, Natick, MA), as described by VanBuren et al. (2002), with the exceptions detailed here. (1) The simulation parameters listed in Table S1. (2) Castle and Odde (2013) have previously demonstrated by using molecular modeling that protofilaments that are shorter than their adjacent neighbors have reduced tubulin on-rates. Therefore, our model made use of an adjusted on-rate that was dependent on neighboring protofilament lengths to account for this effect. Here, the tubulin on-rate was reduced by 40% for a given protofilament if one neighboring protofilament was longer and was reduced by 90% if both neighboring protofilaments were longer. (3) The dissociation probability was not calculated for tubulin subunits that were more than 20 layers from the protofilament end. This is a conservative approach that saves a large amount of computation time. Tracking over 40 million events showed no dissociation events of tubulin buried more than one layer deep, demonstrating that the conservative approach was unlikely to impact the results as compared to dissociation calculations for all tubulin units regardless of depth.
TPX2
The simulation of microtubule dynamics in the presence of TPX2 followed four additional rules. (1) There was an available free concentration of TPX2 that was set to match experimental values ([TPX2]). (2) TPX2 bound non-preferentially either to non-TPX2-bound tubulin subunits in the microtubule lattice, or at the microtubule tip, both with rate constant kon,TPX2. (3) Bound TPX2 detached from a given tubulin subunit with a rate constant koff,TPX2. (4) A tubulin subunit that had TPX2 bound, as well as its closest longitudinal neighbor towards the minus end, had an additional energy adjustment ΔGTPX2, which was used to calculate the tubulin off-rate, as described in Eqn 2. The simulation parameters for TPX2 are in Table S2. TPX2 addition and dissociation was added to the list of possible events at each time step.
Analysis of simulation results
Growth rate, shortening rate and catastrophe frequency were calculated using a custom script coded in MATLAB. The average protofilament length from the simulation output was smoothed by averaging over 5000 data points (∼6 s) in either direction. Local maxima and minima were identified from this smoothed data. Using the time points of the local maxima and minima from the smoothed data, the growth rate was calculated from a local minimum to the next local maximum using the unsmoothed data.
The catastrophe frequency was calculated as the number of local maxima divided by the total simulation time. To calculate the overall shortening rate, the code scanned forward from the local maxima to find the point where the microtubule tip was within five tubulin subunits of the base of the GTP cap (defined in the simulation as the layer in which the GTP tubulin subunit furthest from the plus-end tip was located). This was defined as the beginning of shortening. The end of shortening was set to the minimum point of the unsmoothed data between local maxima and the next minima of the smoothed data. This method avoids accidental inclusion of the transition period in the calculation of growth and shortening rate.
In all cases, the script displayed the identified points on a plot of the data to be confirmed by eye.
Creation of simulated kymographs
The mean of the thirteen protofilament lengths and the corresponding time points from the simulations were resampled to match the imaging speed of experiments (5-s intervals). The resampling method used a weighted average of mean protofilament length corresponding to the two time points nearest to the desired interval.
For the initial time point of the resampled data, each of the 13 tubulin subunits in a layer was randomly tagged or not tagged with a simulated fluorescent label with a 15% chance that a unit was fluorescently tagged (to match experiment). The number of tagged tubulin subunits in each layer was tracked. Scanning through the resampled data, each time the average length was one tubulin subunit longer (8 nm), that layer was assigned tagged and untagged tubulin according to the same rule. If the resampled data shortened by the length of a tubulin subunit, the number of tagged tubulin subunits in that layer was set to 0. The number of fluorescent tags in each layer at each time point was tracked.
For every time point, a two dimensional Gaussian curve (normal bell curve) was generated for each fluorescent tag. The curve used the position of the fluorescent tag as the center of the curve, the peak intensity was assigned a value of 1 for each fluorescent tag, and the standard deviation in nanometers was determined using:
 |
(8) |
where σ is the standard deviation, λ is the wavelength of the light produced by the fluorophore and N is the numerical aperture of the objective of the microscope used for the experiments. For green, the wavelength used was 532 nm. The numerical aperture was 1.49 to match the experimental microscope lens. The Gaussian curves for each simulated fluorophore were summed and resampled to 160 nm bins (the size of one pixel from the experimental images) at each time point to create a single line of pixels with the amount of fluorescence extending to the length of the simulated microtubule. The line of pixels for each time point were stacked to create a kymograph.
For the special case of mCherry–TPX2, a modified version of the simulation attached a simulated fluorophore to 100% of the TPX2 molecules in the simulated solution. The simulated data, which tracked the positions of TPX2 bound to tubulin, were resampled for each time point, in this instance selecting the time point nearest to the desired interval. Each position of fluorescently tagged mCherry–TPX2 was used as the center of a Gaussian distribution following the same guidelines as above, using the red wavelength of 635 nm. All mCherry–TPX2 Gaussian curves were summed according to position and overlaid on the corresponding kymograph of the microtubule in the red channel.
Footnotes
Competing interests
The authors declare no competing or financial interests.
Author contributions
T.A.R. performed experiments, analysis and simulations, and contributed to writing; B.M.S. performed experiments and analysis; B.J.M and S.K.B. performed protein purification; M.P., M.M. and C.E.C. performed experiments; P.W. and M.K.G directed the project and contributed to writing.
Funding
M.K.G. is supported by the Pew Charitable Trusts through the Pew Scholars Program in the Biomedical Sciences; and by National Institutes of Health [grant number NIGMS GM-103833]. Deposited in PMC for release after 12 months.
Supplementary information
Supplementary information available online at http://jcs.biologists.org/lookup/suppl/doi:10.1242/jcs.178806/-/DC1
References
- Balchand S. K., Mann B. J., Titus J., Ross J. L. and Wadsworth P. (2015). TPX2 inhibits Eg5 by interactions with both motor and microtubule. J. Biol. Chem. 290, 17367-17379. 10.1074/jbc.M114.612903 [DOI] [PMC free article] [PubMed] [Google Scholar]
- Bayliss R., Sardon T., Vernos I. and Conti E. (2003). Structural basis of Aurora-A activation by TPX2 at the mitotic spindle. Mol. Cell 12, 851-862. 10.1016/S1097-2765(03)00392-7 [DOI] [PubMed] [Google Scholar]
- Bulinski J. C., Odde D. J., Howell B. J., Salmon T. D. and Waterman-Storer C. M. (2001). Rapid dynamics of the microtubule binding of ensconsin in vivo. J. Cell Sci. 114, 3885-3897. [DOI] [PubMed] [Google Scholar]
- Castle B. T. and Odde D. J. (2013). Brownian dynamics of subunit addition-loss kinetics and thermodynamics in linear polymer self-assembly. Biophys. J. 105, 2528-2540. 10.1016/j.bpj.2013.10.009 [DOI] [PMC free article] [PubMed] [Google Scholar]
- Coombes C. E., Yamamoto A., Kenzie M. R., Odde D. J. and Gardner M. K. (2013). Evolving tip structures can explain age-dependent microtubule catastrophe. Curr. Biol. 23, 1342-1348. 10.1016/j.cub.2013.05.059 [DOI] [PMC free article] [PubMed] [Google Scholar]
- Demchouk A. O., Gardner M. K. and Odde D. J. (2011). Microtubule tip tracking and tip structures at the nanometer scale using digital fluorescence microscopy. Cell. Mol. Bioeng. 4, 192-204. 10.1007/s12195-010-0155-6 [DOI] [PMC free article] [PubMed] [Google Scholar]
- Desai A. and Mitchison T. J. (1997). Microtubule polymerization dynamics. Annu. Rev. Cell Dev. Biol. 13, 83-117. 10.1146/annurev.cellbio.13.1.83 [DOI] [PubMed] [Google Scholar]
- Drechsler H., McHugh T., Singleton M. R., Carter N. J. and McAinsh A. D. (2014). The Kinesin-12 Kif15 is a processive track-switching tetramer. Elife 3, e01724 10.7554/eLife.01724 [DOI] [PMC free article] [PubMed] [Google Scholar]
- Eckerdt F., Eyers P. A., Lewellyn A. L., Prigent C. and Maller J. L. (2008). Spindle pole regulation by a discrete Eg5-interacting domain in TPX2. Curr. Biol. 18, 519-525. 10.1016/j.cub.2008.02.077 [DOI] [PMC free article] [PubMed] [Google Scholar]
- Fygenson D. K., Braun E. and Libchaber A. (1994). Phase diagram of microtubules. Phys. Rev. E Stat. Phys. Plasmas Fluids Relat. Interdiscip. Top. 50, 1579-1588. 10.1103/physreve.50.1579 [DOI] [PubMed] [Google Scholar]
- Fygenson D. K., Flyvbjerg H., Sneppen K., Libchaber A. and Leibler S. (1995). Spontaneous nucleation of microtubules. Phys. Rev. E 51, 5058-5063. 10.1103/PhysRevE.51.5058 [DOI] [PubMed] [Google Scholar]
- Gable A., Qiu M., Titus J., Balchand S., Ferenz N. P., Ma N., Collins E. S., Fagerstrom C., Ross J. L., Yang G. et al. (2012). Dynamic reorganization of Eg5 in the mammalian spindle throughout mitosis requires dynein and TPX2. Mol. Biol. Cell 23, 1254-1266. 10.1091/mbc.E11-09-0820 [DOI] [PMC free article] [PubMed] [Google Scholar]
- Gardner M. K., Pearson C. G., Sprague B. L., Zarzar T. R., Bloom K., Salmon E. D. and Odde D. J. (2005). Tension-dependent regulation of microtubule dynamics at kinetochores can explain metaphase congression in yeast. Mol. Biol. Cell 16, 3764-3775. 10.1091/mbc.E05-04-0275 [DOI] [PMC free article] [PubMed] [Google Scholar]
- Gardner M. K., Zanic M., Gell C., Bormuth V. and Howard J. (2011a). Depolymerizing kinesins Kip3 and MCAK shape cellular microtubule architecture by differential control of catastrophe. Cell 147, 1092-1103. 10.1016/j.cell.2011.10.037 [DOI] [PubMed] [Google Scholar]
- Gardner M. K., Charlebois B. D., Jánosi I. M., Howard J., Hunt A. J. and Odde D. J. (2011b). Rapid microtubule self-assembly kinetics. Cell 146, 582-592. 10.1016/j.cell.2011.06.053 [DOI] [PMC free article] [PubMed] [Google Scholar]
- Gell C., Bormuth V., Brouhard G. J., Cohen D. N., Diez S., Friel C. T., Helenius J., Nitzsche B., Petzold H., Ribbe J. et al. (2010). Microtubule dynamics reconstituted in vitro and imaged by single-molecule fluorescence microscopy. Methods Cell Biol. 95, 221-245. 10.1016/S0091-679X(10)95013-9 [DOI] [PubMed] [Google Scholar]
- Gruss O. J. and Vernos I. (2004). The mechanism of spindle assembly: functions of Ran and its target TPX2. J. Cell Biol. 166, 949-955. 10.1083/jcb.200312112 [DOI] [PMC free article] [PubMed] [Google Scholar]
- Gruss O. J., Wittmann M., Yokoyama H., Pepperkok R., Kufer T., Silljé H., Karsenti E., Mattaj I. W. and Vernos I. (2002). Chromosome-induced microtubule assembly mediated by TPX2 is required for spindle formation in HeLa cells. Nat. Cell Biol. 4, 871-879. 10.1038/ncb870 [DOI] [PubMed] [Google Scholar]
- Ma N., Titus J., Gable A., Ross J. L. and Wadsworth P. (2011). TPX2 regulates the localization and activity of Eg5 in the mammalian mitotic spindle. J. Cell Biol. 195, 87-98. 10.1083/jcb.201106149 [DOI] [PMC free article] [PubMed] [Google Scholar]
- Maiato H., DeLuca J., Salmon E. D. and Earnshaw W. C. (2004). The dynamic kinetochore-microtubule interface. J. Cell Sci. 117, 5461-5477. 10.1242/jcs.01536 [DOI] [PubMed] [Google Scholar]
- McIntosh J. R., Grishchuk E. L. and West R. R. (2002). Chromosome-microtubule interactions during mitosis. Annu. Rev. Cell Dev. Biol. 18, 193-219. 10.1146/annurev.cellbio.18.032002.132412 [DOI] [PubMed] [Google Scholar]
- Mitchison T. and Kirschner M. (1984). Dynamic instability of microtubule growth. Nature 312, 237-242. 10.1038/312237a0 [DOI] [PubMed] [Google Scholar]
- Mohan R., Katrukha E. A., Doodhi H., Smal I., Meijering E., Kapitein L. C., Steinmetz M. O. and Akhmanova A. (2013). End-binding proteins sensitize microtubules to the action of microtubule-targeting agents. Proc. Natl. Acad. Sci. USA 110, 8900-8905. 10.1073/pnas.1300395110 [DOI] [PMC free article] [PubMed] [Google Scholar]
- Neumayer G., Belzil C., Gruss O. J. and Nguyen M. D. (2014). TPX2: of spindle assembly, DNA damage response, and cancer. Cell. Mol. Life Sci. 71, 3027-3047. 10.1007/s00018-014-1582-7 [DOI] [PMC free article] [PubMed] [Google Scholar]
- Oosawa F. (1970). Size distribution of protein polymers. J. Theor. Biol. 27, 69-86. 10.1016/0022-5193(70)90129-3 [DOI] [PubMed] [Google Scholar]
- Petry S., Groen A. C., Ishihara K., Mitchison T. J. and Vale R. D. (2013). Branching microtubule nucleation in Xenopus egg extracts mediated by augmin and TPX2. Cell 152, 768-777. 10.1016/j.cell.2012.12.044 [DOI] [PMC free article] [PubMed] [Google Scholar]
- Prahl L. S., Castle B. T., Gardner M. K. and Odde D. J. (2014). Quantitative analysis of microtubule self-assembly kinetics and tip structure. Methods Enzymol. 540, 35-52. 10.1016/B978-0-12-397924-7.00003-0 [DOI] [PubMed] [Google Scholar]
- Roostalu J., Cade N. I. and Surrey T. (2015). Complementary activities of TPX2 and chTOG constitute an efficient importin-regulated microtubule nucleation module. Nat. Cell Biol. 17, 1422-1434. 10.1038/ncb3241 [DOI] [PMC free article] [PubMed] [Google Scholar]
- Schatz C. A., Santarella R., Hoenger A., Karsenti E., Mattaj I. W., Gruss O. J. and Carazo-Salas R. E. (2003). Importin alpha-regulated nucleation of microtubules by TPX2. EMBO J. 22, 2060-2070. 10.1093/emboj/cdg195 [DOI] [PMC free article] [PubMed] [Google Scholar]
- Schek H. T. III, Gardner M. K., Cheng J., Odde D. J. and Hunt A. J. (2007). Microtubule assembly dynamics at the nanoscale. Curr. Biol. 17, 1445-1455. 10.1016/j.cub.2007.07.011 [DOI] [PMC free article] [PubMed] [Google Scholar]
- Scrofani J., Sardon T., Meunier S. and Vernos I. (2015). Microtubule nucleation in mitosis by a RanGTP-dependent protein complex. Curr. Biol. 25, 131-140. 10.1016/j.cub.2014.11.025 [DOI] [PubMed] [Google Scholar]
- Skellam J. G. (1946). The frequency distribution of the difference between two Poisson variates belonging to different populations. J. R. Stat. Soc. Ser. A 109, 296 10.2307/2981372 [DOI] [PubMed] [Google Scholar]
- Tanenbaum M. E., Macůrek L., Janssen A., Geers E. F., Alvarez-Fernández M. and Medema R. H. (2009). Kif15 cooperates with eg5 to promote bipolar spindle assembly. Curr. Biol. 19, 1703-1711. 10.1016/j.cub.2009.08.027 [DOI] [PubMed] [Google Scholar]
- Tulu U. S., Fagerstrom C., Ferenz N. P. and Wadsworth P. (2006). Molecular requirements for kinetochore-associated microtubule formation in mammalian cells. Curr. Biol. 16, 536-541. 10.1016/j.cub.2006.01.060 [DOI] [PMC free article] [PubMed] [Google Scholar]
- Trieselmann N., Armstrong S., Rauw J. and Wilde A. (2003). Ran modulates spindle assembly by regulating a subset of TPX2 and Kid activities including Aurora A activation. J. Cell. Sci. 116, 4791-4798. 10.1242/jcs.00798 [DOI] [PubMed] [Google Scholar]
- VanBuren V., Odde D. J. and Cassimeris L. (2002). Estimates of lateral and longitudinal bond energies within the microtubule lattice. Proc. Natl. Acad. Sci. USA 99, 6035-6040. 10.1073/pnas.092504999 [DOI] [PMC free article] [PubMed] [Google Scholar]
- VanBuren V., Cassimeris L. and Odde D. J. (2005). Mechanochemical model of microtubule structure and self-assembly kinetics. Biophys. J. 89, 2911-2926. 10.1529/biophysj.105.060913 [DOI] [PMC free article] [PubMed] [Google Scholar]
- Vanneste D., Takagi M., Imamoto N. and Vernos I. (2009). The role of Hklp2 in the stabilization and maintenance of spindle bipolarity. Curr. Biol. 19, 1712-1717. 10.1016/j.cub.2009.09.019 [DOI] [PubMed] [Google Scholar]
- Vos J. W., Pieuchot L., Evrard J. L., Janski N., Bergdoll M., de Ronde D., Perez L. H., Sardon T., Vernos I. and Schmit A. C. (2008). The plant TPX2 protein regulates prospindle assembly before nuclear envelope breakdown. Plant Cell. 20, 2783-2797. 10.1105/tpc.107.056796 [DOI] [PMC free article] [PubMed] [Google Scholar]
- Walker R. A., O'Brien E. T., Pryer N. K., Soboeiro M. F., Voter W. A., Erickson H. P. and Salmon E. D. (1988). Dynamic instability of individual microtubules analyzed by video light microscopy: rate constants and transition frequencies. J. Cell Biol. 107, 1437-1448. 10.1083/jcb.107.4.1437 [DOI] [PMC free article] [PubMed] [Google Scholar]
- Wieczorek M., Bechstedt S., Chaaban S. and Brouhard G. J. (2015). Microtubule-associated proteins control the kinetics of microtubule nucleation. Nat. Cell Biol. 17, 907-916. 10.1038/ncb3188 [DOI] [PubMed] [Google Scholar]
- Wittmann T., Boleti H., Antony C., Karsenti E. and Vernos I. (1998). Localization of the kinesin-like protein Xklp2 to spindle poles requires a leucine zipper, a microtubule-associated protein, and dynein. J. Cell Biol. 143, 673-685. 10.1083/jcb.143.3.673 [DOI] [PMC free article] [PubMed] [Google Scholar]
- Wittmann T., Wilm M., Karsenti E. and Vernos I. (2000). TPX2, A novel xenopus MAP involved in spindle pole organization. J. Cell Biol. 149, 1405-1418. 10.1083/jcb.149.7.1405 [DOI] [PMC free article] [PubMed] [Google Scholar]
- Yvon A.-M. C., Wadsworth P. and Jordan M. A. (1999). Taxol suppresses dynamics of individual microtubules in living human tumor cells. Mol. Biol. Cell 10, 947-959. 10.1091/mbc.10.4.947 [DOI] [PMC free article] [PubMed] [Google Scholar]