SUMMARY
To determine whether exogenous opiate drugs with abuse liability directly modify neural growth, the present study investigated the effects of morphine on astrocyte proliferation and differentiation in primary cultures of murine glial cells. The results indicate that morphine decreases glial cell production in a dose-dependent, naloxone reversible manner. Most notably, gliogenesis virtually ceased in the presence of 10−6 M morphine during the first week in culture, whereas 10−8 M or 10−10 M morphine caused an intermediate suppression of growth compared to control or 10−6 M morphine treated cultures. Moreover, morphine-treatment inhibited [3H]thymidine incorporation by glial fibrillary acidic protein (GFAP) immunoreactive, flat (type 1) astrocytes, suggesting that the decrease in glial cell production was due in part to an inhibition of astrocyte proliferation. Morphine also caused significant increases in both cytoplasmic area and process elaboration in flat (type 1) astrocytes indicating greater morphologic differentiation. In the above experiments, morphine-dependent alterations in astrocyte growth were antagonized by naloxone, indicating that morphine action was mediated by specific opioid receptors. These observations suggest that opiate drugs can directly modify neural growth by influencing two critical developmental events in astrocytes, i.e., inhibiting proliferation and inducing morphologic differentiation.
Keywords: Opioids, Neural development, Cell proliferation, Cell differentiation, Astrocyte morphology, Glial development, Naloxone, Opioid receptors, Drug abuse
INTRODUCTION
There is considerable evidence that endogenous opioid peptides and their receptors are involved in the regulation of neural growth in vivo10,11,12,33,50,54. However, the realization that endogenous opioids directly modify neural growth is provided by recent in vitro studies where the endogenous opioid, [Met5]enkephalin, has been shown to directly suppress the growth of astrocytes in primary cultures derived from the cerebral hemispheres of newborn mice43,44. Opioid peptides have similarly been found to alter the growth of explant cultures16 as well as the phenotypic expression of neurotransmitters by cultured developing neurons49, and to decrease the number of serotonin-receptor containing neurons in vitro5.
An unresolved question is whether exogenous opiate drugs with abuse liability (e.g., morphine, heroin, methadone) directly modify neural development. Both direct39 and indirect18,38 mechanisms of action of exogenous opiates on neural growth have been proposed. In vivo studies showing the ability of morphine to inhibit [3H]thymidine incorporation in rat brain in a naloxone reversible manner18, as well as the ability of opiate antagonists such as naloxone50 or naltrexone33 to increase [3H]thymidine incorporation in the rat forebrain implies an action at the level of the opioid receptor. On the other hand, there are also reports indicating that opiate drugs, or associated β-funaltrexamine sensitive µ-opioid receptors, have little or no effect on neural development18,55. Numerous side effects (e.g., opiates modify nutrition, respiration, and circulating hormone levels) make it difficult to assess the in vivo action of opiate drugs per se41, and perhaps contribute to disparate results. Moreover, it is likely that there are critical periods of opiate responsiveness or vulnerability10,32, as well as species14,23,28 and strain20 differences in opiate responsiveness that are, as yet, poorly defined. Studies on the effects of morphine on neural explant cultures have been contradictory8,16,53. It is possible that opiates cause increased or decreased release of other neural peptides or neurotransmitters which, in turn, cause the observed growth effects. For example, rat pups addicted to methadone show defective uptake of serotonin, dopamine and norepinephrine37. Examination of isolated cell types within primary cell cultures may bypass some of these obstacles14. Yet, very few reports exist addressing the specific effects of morphine on relatively homogeneous populations of primary cultured cells. We therefore decided to assess opiate drug action using a recently established developmental model of cultured murine astrocytes known to be sensitive to endogenous opioid manipulation13,43,44. The results presented herein suggest for the first time that opiate drugs with abuse liability can directly modify astrocyte proliferation and differentiation, and that this early effect on growth may evoke lasting changes in the relative numbers of neural cells (see ref. 47). Opiate drugs (i.e., morphine) can mimic the action of endogenous opioids in influencing the growth of at least one developing neural cell type (i.e., astrocytes) suggesting that opiate drugs interfere with opioid-dependent growth by disrupting the normal interactions between endogenous opioids and opioid receptors. These findings may have direct implications regarding opiate drug use during pregnancy or lactation, as well as during postnatal development, in man.
MATERIALS AND METHODS
Cell Cultures
Primary cultures of glial cells were obtained from 1-day-old Swiss-Webster mice (ICR strain, Harlen Sprague Dawley, IN) as previously described44. Briefly, using aseptic technique, mouse pups were decapitated, and the olfactory bulbs, cerebellum and meninges removed from each brain. The cerebral hemispheres were minced, and dissociated in 2.5% trypsin containing DNase (1 µg/ml) at 37°C by repeated agitation. Cell suspensions were centrifuged at 40 × g for 5 min and the pellets resuspended in 3–4 ml growth media containing Dulbecco's modified Eagle's medium (DMEM) with 0.5% glucose, 0.06% Na2CO3, and 10% fetal calf serum (FCS) (Hazelton, Lenexa, KS). The cell suspension was triturated to break up cell aggregates and filtered through Nitex 130 (Tetko Co., Elmsford, NY) to remove any remaining large clumps. The cell suspension was then centrifuged at 40 × g for 3 min and the pellet resuspended in 1 ml of growth media with 10% FCS. The cells were counted using a hemacytometer and were diluted to a density of approximately 5 × 10⁵ cells/ml with growth media and FCS. For labelling index studies 16 mm glass coverslips coated with poly-L-lysine (40.75 kDa; Sigma, St Louis, MO) were placed into 22 mm wells and seeded with 1 ml of cell suspension. For absolute counts, 0.5 ml of cell suspension was delivered to 16 mm culture wells (Primaria, Falcon, Oxnard, CA). Cultures were incubated at 34–34.5°C in 5% CO2/95% air and high humidity.
Absolute Cell Counts
After 24 hours incubation (day 1), culture wells were divided into control and treatment groups (8 wells per group). Growth media and unattached cells were removed from each well and replaced with either growth media plus 10% FCS serum alone (controls), or growth media containing 10% FCS plus either 10−6 M, 10−8 M or 10−10 M morphine (morphine sulfate; NIDA, Bethesda, MD). Fresh media was added to each culture well on days 1, 3, 5, and 7. On days 3, 6, and 8, cells were released from each well using 0.25% trypsin and 0.05% ethylenediamine tetra acetic acid (EDTA), incubation at 34.5°C for 10 min, and a combination of trituration and gentle scraping. Microscopic review of the culture wells after this treatment verified that over 99% of cells were removed. Counts were performed using a hemacytometer.
Combined [3H]thymidine and Immunocytochemical Labelling
After 24 hours incubation (day 1), culture wells were divided into control and treatment groups (12 wells per group). Growth media and unattached cells were removed from each well and replaced with one of the following treatments: controls were treated with growth media containing 10% FCS alone, test groups were treated with either 10−6 M morphine, 10−6 M morphine plus 3 × 10⁻⁶ M naloxone (Dupont, Wilmington, DE), or 3 × 10⁻⁶ M naloxone alone.
Cells were labeled, both autoradiographically with [3H]thymidine and immunocytochemically for glial fibrillary acidic protein (GFAP), as previously described44. Briefly, 0.24 µCi/ml (6.7 Ci/mM) of [3H]thymidine (ICN Radiochemicals, Irvine, CA) was added to each culture well. Cultures were incubated for 16–18 h prior to fixation. Radioactive media were removed and the cultures were washed twice with cold DMEM, fixed in Zamboni's fixative containing 3% paraformaldehyde for 1 h followed by 5 rinses in cold PBS. To identify astrocytes, coverslips were stained immunocytochemically for the astrocyte marker, GFAP, using a primary anti-GFAP polyclonal antibody (Bio-Genex Laboratories, Dublin, CA) and a Vectastain-ABC kit (Vector Laboratories, Burlingame, CA).
Diaminobenzidine 4-HCl (Sigma, St Louis, MO) was used to visualize the reaction. The coverslips were then dipped in NTB-2 emulsion (Kodak) and exposed for 4 weeks at 4°C. After development in D-19 (Kodak) for 5 min at 12°C, the coverslips were counterstained with Ehrlich's Hematoxylin.
Labelling Index
Based on in vitro morphology, GFAP-positive cells can be categorized into either (i) flat astrocytes with large, squamous cell bodies having polygonal shaped cytoplasmic borders that are morphologically similar to A2B5−/GFAP+ type 1 astrocytes described by Raff, et al26,29; or, (ii) process-bearing astrocytes having small, round cell bodies with long slender cytoplasmic processes that are morphologically similar to A2B5+/GFAP+ type 2 astrocytes described by Raff, et al26,29. Between 500 and 600 GFAP-positive flat and process-bearing cells present either singly or in a monolayer clusters were counted for each culture well. Cells with and without grains over the nucleus were counted based on morphologic cell type. Nuclei with 10 or more grains were considered to be labelled. Analyses were performed with the observer unaware of which group was being sampled ("blind study"). A treatment group consisted of 10–12 cultures. The labelling index was calculated for both flat and process-bearing astrocytes. The labelling index was defined as the number of [3H]thymidine labelled cells divided by the total number of labelled plus unlabelled cells for a given cell type. All cell counts were performed using a Leitz microscope (40×, 0.65 NA objective).
Morphometry
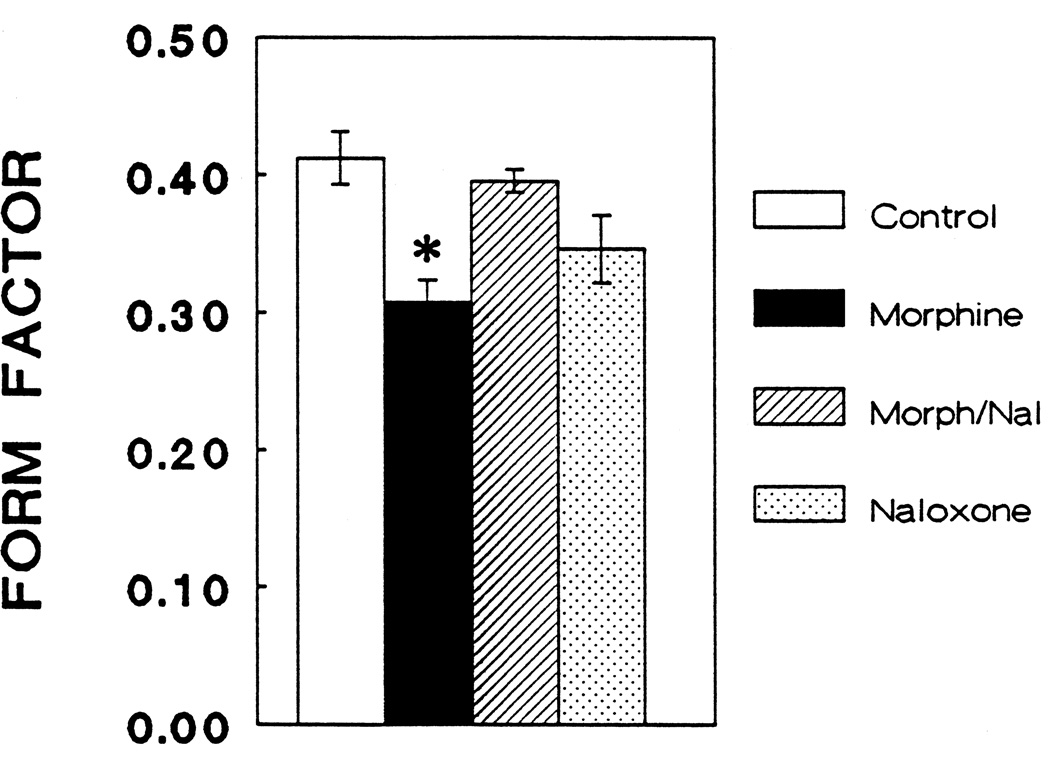
The cytoplasmic areas of 120 consecutive, single, flat, GFAP-positive cells for each treatment group were outlined using a cursor-guided digitizing tablet attached to a computerized video imaging system (MicroComp Software; Southern Micro Instruments, Atlanta, GA) connected to an Olympus Microscope. The system was calibrated and the cells outlined using a 20× objective. Analyses were performed with the observer unaware of which group was being sampled. GFAP immunoreactive process-bearing cells were present in very small numbers and hence were not analyzed. For each cell, perimeter, area (µm2), and "form factor" were determined. Form factor is an index of the number of processes of a cell and is defined as (4[π])(area)/perimeter2) (MicroComp Software). A histogram was generated based on the areas from a random sample of individual flat astrocytes from both the control and morphine-treated groups.
Statistics
Data were reported as the mean ± the standard error of the mean. Overall differences due to experimental treatments were tested using one- or two-way analysis of variance (ANOVA) and subsequent comparisons were made using Newman-Keuls test (General ANOVA programs; StatSoft, Tulsa, OK). Differences were considered significant if P < 0.05.
RESULTS
Absolute Cell Counts
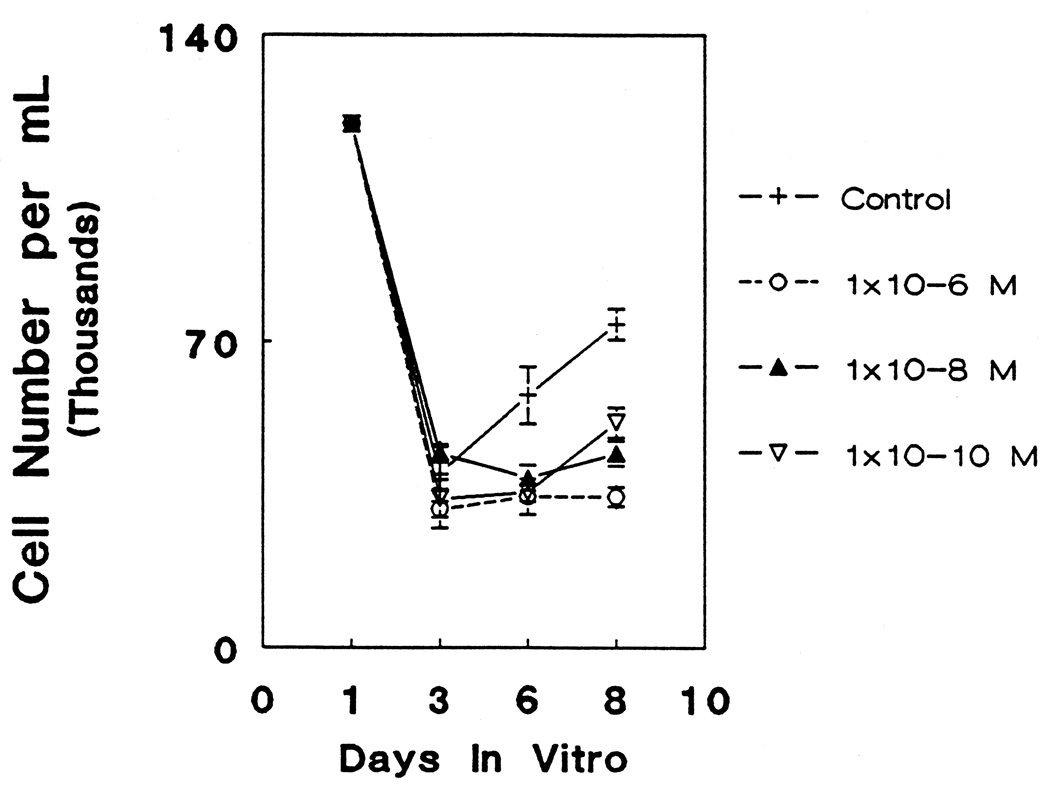
Cultures treated with morphine for 6 days in vitro exhibited significant dose-dependent depressions in absolute cell numbers compared to controls which persisted through day 8 (Fig. 1). There was virtually no increase in cell numbers from day 3 to 8 following 10−6 M morphine exposure. Likewise, 10−8 M morphine suppressed cell numbers over this time period although there appeared to be a slight (not statistically significant) increase in cell numbers by day 8. A lower (10−10 M) concentration of morphine showed equal suppression of cell numbers at day 6 compared to control values, but significant recovery (relative to control values) was evident at day 8 compared to higher morphine concentrations (P < 0.05). Nevertheless, the lowest dosage of morphine markedly decreased the number of glial cells. At day 8, there were significantly fewer cells in cultures treated with 10−10 M morphine than control cultures (P < 0.05).
Figure 1.
The effects of decreasing dosages of morphine (10−6 M, 10−8 M, 10−10 M) on the total numbers of cells per culture dish from 3 to 8 days in vitro (DIV). Baseline cell counts for all cultures prior to treatment are indicated at day 1. Morphine treatment caused an overall decrease in cell number over this time period (ANOVA; df = 3, 80; F = 18.16; P < 0.001). Newman-Keuls test revealed no difference from control values after 3 DIV; however, at 6 DIV, all three concentrations were significantly different from control (P < 0.05) but not from each other. At 8 DIV, morphine (10−6, 10−8, or 10−10 M) caused a marked reduction in cell number compared to control values (P < 0.05), although 10−10 M morphine treatment did not reduce cell numbers as much as 10−6 or 10−8 M dosages (P < 0.05).
Labelling Index
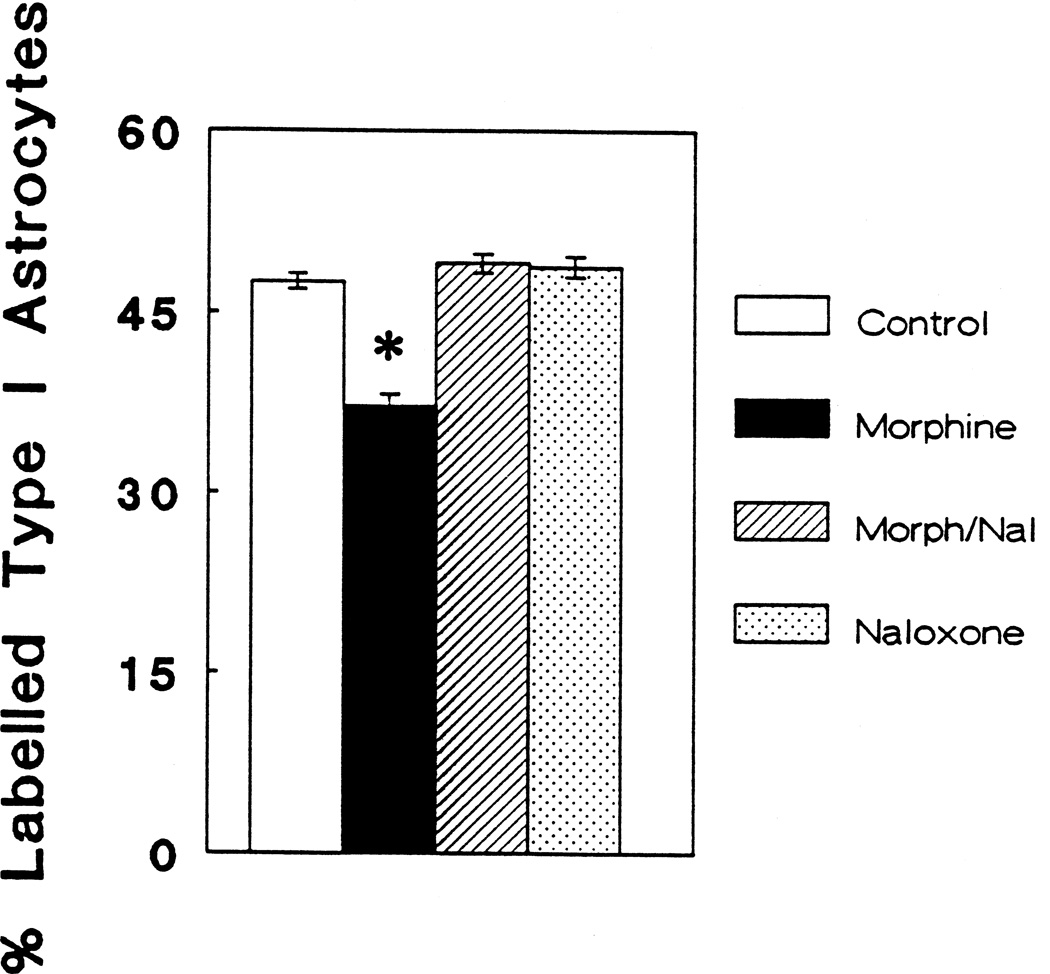
Figure 2 compares the percentage of GFAP-immunolabeled astrocytes with flat (type 1) morphology between the control group and groups treated with 10−6 M morphine, 10−6 M morphine plus 3 × 10⁻⁶ M naloxone, or 3 × 10⁻⁶ M naloxone alone. There was a significant decrease in the percentage of cells incorporating [3H]thymidine in the group treated with morphine (P < 0.05). This suppression was prevented by the addition of naloxone.
Figure 2.
The percentage of flat astrocytes labeled with [3H]-thymidine comparing controls, morphine (10−6 M), morphine plus naloxone (10−6 M and 3 × 10⁻⁶ M) (Morph/Nal), and naloxone alone (3 × 10⁻⁶ M); Overall differences (ANOVA; df = 3, 43; F = 26.363; P < 0.001). Newman-Keuls test revealed that morphine (10−6 M) significantly (*) suppresses the incorporation of [3H]thymidine by flat (type 1) astrocytes at 6 days in vitro compared to the control group, or groups treated morphine plus naloxone, or naloxone alone (P < 0.05).
Morphometry
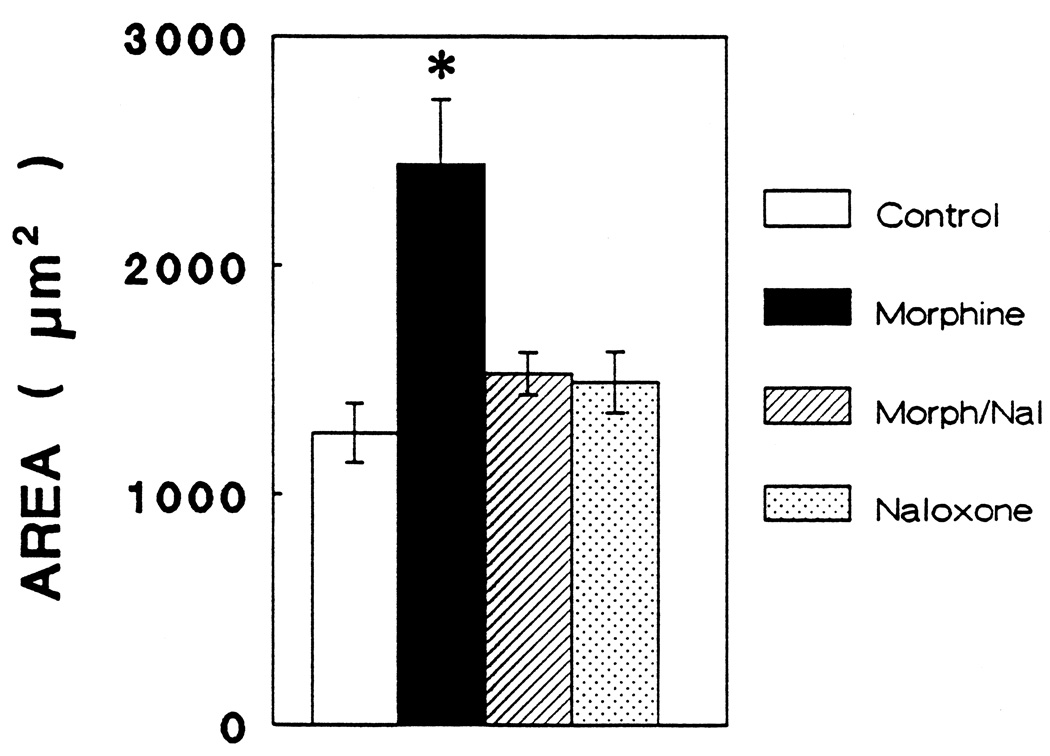
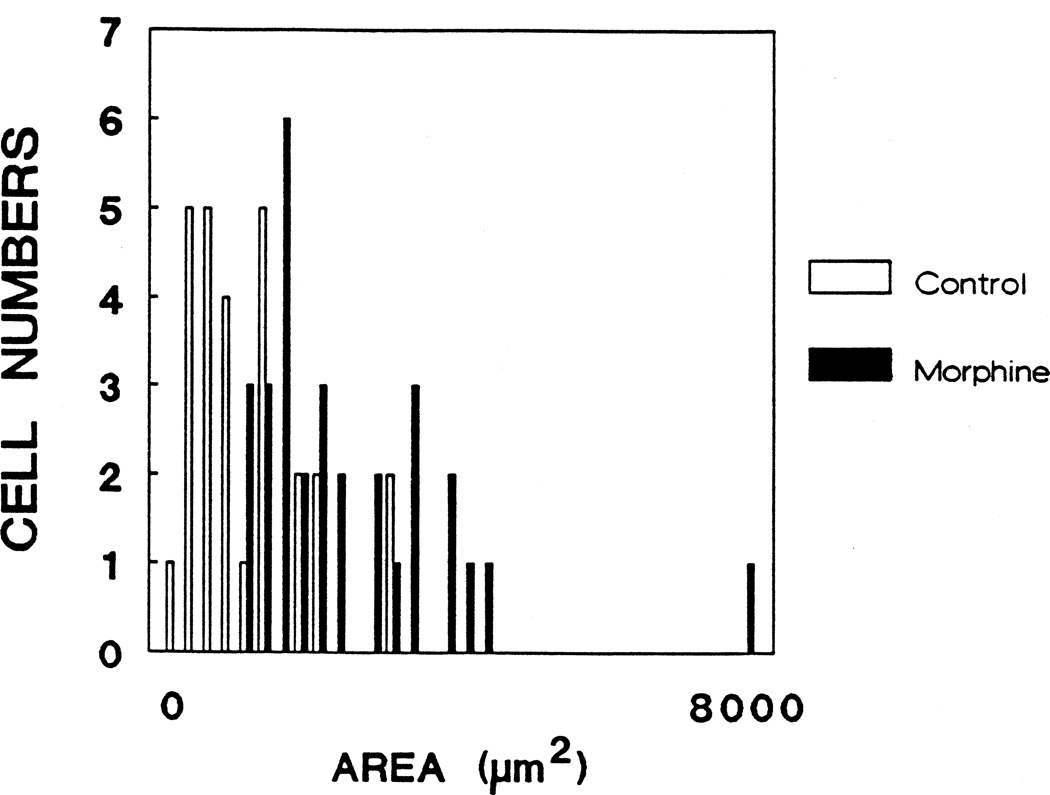
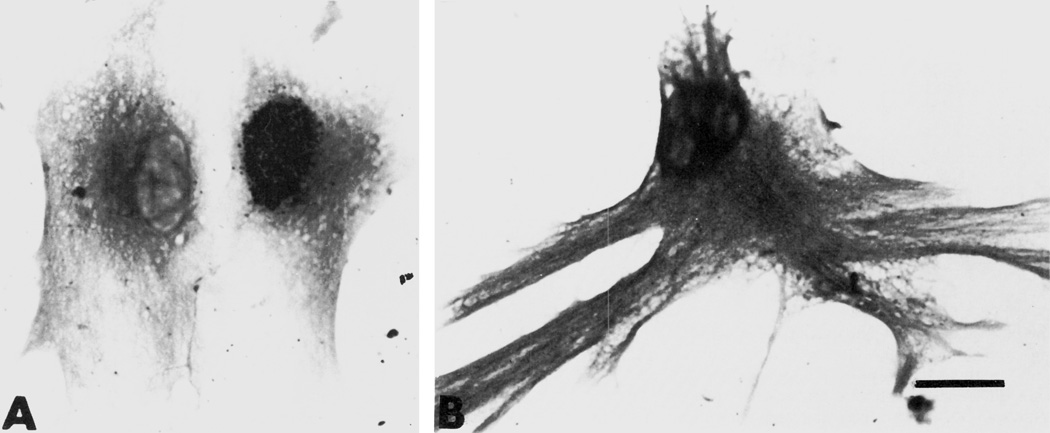
Type 1, GFAP-immunoreactive astrocytes treated with morphine exhibited a significant increase in total cell area (P < 0.05) that was prevented by concomitant treatment with naloxone (Fig. 3). Examination of a histogram based on individual astrocyte areas (Fig. 4) reveals an apparent bimodal distribution of morphine-treated astrocytes since a small portion of the cells exhibited an exaggerated response. Furthermore, morphine treatment caused a significant decrease in the form factor parameter compared to control cells (P < 0.05) indicating an increase in the perimeter of a cell in relation to its area (Fig. 5). The latter finding coincides with the appearance of increased numbers of cytoplasmic processes by morphine-treated astrocytes (Fig. 6).
Figure 3.
At 6 days in vitro, the total area of flat (type 1) astrocytes following treatment with morphine (10−6 M), morphine (10−6 M) plus naloxone (3 × 10⁻⁶ M) (Morph/Nal), or naloxone (3 × 10⁻⁶ M) alone (ANOVA; df = 3, 32; F = 7.848; P < 0.003). Post hoc comparisons revealed significant differences (Newman-Keuls; P < 0.05) between morphine treatment compared to the other three treatments, whereas there was no difference between controls and cultures treated with morphine plus naloxone, or naloxone alone.
Figure 4.
A histogram comparing the area of randomly selected astrocytes in control and morphine-treated cultures revealed an apparent bimodal distribution within the morphine-treated group. Morphine treatment resulted in an overall increase in astrocyte area (compared to controls), as well as an exaggerated increase in the area of a small percentage of astrocytes.
Figure 5.
At 6 days in vitro, form factor (4[π])(area)/perimeter2) measurements were significantly altered by morphine treatment (ANOVA; df = 3,28; F = 6.01; P < 0.01). Morphine (10−6 M) caused a significant decrease in the form factor of flat (type 1) astrocytes indicating an increase in cytoplasmic process complexity when compared to controls, morphine (10−6 M) plus naloxone (3 × 10⁻⁶ M), or naloxone (3 × 10⁻⁶ M) alone (Newman-Keuls; P < 0.05). There was no different between controls and cultures treated with morphine plus naloxone or naloxone alone.
Figure 6.
(A and B). Brightfield photomicrographs of glial fibrillary acidic protein (GFAP)-immunoreactive astrocytes. Compared to astrocytes treated with growth media alone (A, controls); many of those treated with 10−6 M morphine show a greatly exaggerated increase in both size and the elaboration of cytoplasmic processes (B). Scale bar = 25 µm.
DISCUSSION
Morphine appears to modify the growth of astrocytes in primary culture by influencing two separate developmental events. First, the morphine-dependent decline in both cell number and [3H]thymidine incorporation suggests that morphine inhibits the rate of astrocyte proliferation. Second, morphine-dependent increases in cell area combined with the elaboration of cytoplasmic processes suggests that morphine causes astrocytes to differentiate more rapidly. In all the above studies, morphine action can be negated by simultaneous treatment with naloxone; therefore, with respect to astrocyte growth, morphine's action is specific, reversible, and mediated at the level of opioid receptors. We will discuss morphine's action with respect to each developmental event separately.
Morphine caused a decline in total cell numbers in mixed glial cultures that was in some ways similar to previously reported action of [Met5]enkephalin44. To determine if the observed decrease in cell numbers was due to a decline in the production of new astrocytes, [3H]thymidine incorporation was assessed autoradiographically in individual cells that were immunoreactive for the astrocyte-specific marker, GFAP. The results indicate that morphine treatment causes a significant decrease in DNA synthesis by astrocytes. This, in conjunction with the fact that there are fewer total cells, strongly suggests that morphine inhibits astrocyte proliferation. However, since the net total number of cells present at any time is also dependent on cell survival, morphine-dependent enhancement of glial cell death could additionally contribute to a decrease in the total number of cells. Morphine in higher concentrations (10−6 M) does, in fact, appear to contribute to an enhanced rate of cell death since the net total cell number did not increase from days 3 to 8 in culture (Fig. 1), despite a percentage of flat astrocytes that continued to incorporate [3H]thymidine (Fig. 2). The apparent absence of new cell production was not previously noted when identical glial cultures were treated with equimolar (10−6 M) dosages of [Met5]enkephalin43,44, and suggests real differences between the action of morphine and [Met5]enkephalin during gliogenesis.
Morphine-related changes in astrocyte morphology have not been previously reported. The rationale for examining morphometric parameters was an attempt to better understand how astrocytes were responding to morphine. Astrocytes can undergo reactive morphologic changes including swelling17 which are perhaps related more to pathology than growth. In non-neural, cultured epithelial cell lines, morphine has been shown to induce reactive swelling31. Therefore, in addition to determining overall cell size (i.e., area measurement), the complexity of astrocytic processes were also estimated (i.e., form factor determination) which should not change dramatically with swelling. The general finding of astrocyte hypertrophy with concomitant increases in elaboration of cytoplasmic processes suggests that morphine is eliciting morphologic differentiation rather than reactive swelling. Microscopically, morphine-treated astrocytes appeared to contain an equivalent complement of GFAP-immunoreactive intermediate filaments compared to control cells further implying cellular differentiation rather than swelling. Thus, morphine treatment appears to enhance the rate of development of the less differentiated GFAP-immunoreactive, pleomorphic, "astroblast" into "stellate astrocytes" with more extensive processes7. Analysis of the histogram shows a small subpopulation of astrocytes with an exaggerated increase in area (Fig. 4). Morphine-dependent morphologic changes in the group of astrocytes with an exaggerated increase in area did not resemble what is typically described as "stellation" (see ref 1), but were similar to changes observed in reactive astrocytes. Lastly, the opioid-dependent changes in astrocyte morphology appear to be specific, since dynorphin (a preferential κ-opioid receptor agonist) has no effect on the morphology of cultured pituicytes (GFAP-positive pituitary cells)2.
Findings that morphine directly inhibits astrocyte growth in mixed-glial cultures were somewhat unexpected. Morphine typically fails to alter growth in tumor cell lines where endogenous opioids such as [Met5]enkephalin have a profound inhibitory effect on cell replication in vitro35,57. However, disparity between findings in primary cell cultures and tumor cell lines may lie in the fact that malignant cells, in general, have an altered response to growth factors15. Studies exploring morphine effects on the growth of primary cell cultures are relatively inconsistent compared to studies utilizing tumor cell lines16,18,48,53. These discrepancies can perhaps be attributed to differences in experimental conditions. It is reasonable to assume that differences in species (or strain), age (including the age of the tissue when it is placed into culture, as well as time spent in vitro), culture type (e.g., dissociated vs explant), nutrient media (e.g., in serum-containing nutrient media contains both opioids or non-opioid growth factors), as well as other factors could profoundly affect the response of developing cells to opioids in vitro.
Comparing our present findings that morphine suppresses primary glial cell growth with our previous observations that 10−6 M [Met5]enkephalin has a similar effect44, is exciting because they suggest that the opioid-dependent mechanisms influencing growth are more complex than previously thought; perhaps involving two separate opioid receptor types. The fact that relatively low concentrations (10−10 M) of either morphine (preferential µ opioid receptor ligand) or [Met5]enkephalin (unpublished observations) (preferential δ opioid receptor ligand) inhibited astrocyte growth suggest that both µ and δ opioid receptor types might be involved in growth regulation. Our reports are not the first to indicate similar actions by both [Met5]enkephalin and morphine that, presumably, act on separate opioid receptor types. For example, both [Met5]enkephalin and morphine have been reported to stimulate the release of corticotrophin releasing factor from the hypothalamus4, and both are implicated in the inhibition of norepinephrine-dependent cAMP induction in hypothalamic cells30. Interconversion of µ and δ forms of the opiate receptors as a function of incubation conditions has also been suggested3. Furthermore, µ and δ opioid receptors are coupled (in an inhibitory fashion) during activation of dopamine-dependent adenylate cyclase6,34 in adult rat neostriatum. An interesting hypothesis has been proposed to explain why some opioid receptor types do not always function independently. In particular, µ and δ opioid receptors sometimes display allosteric interactions which may relate to these receptors' ability to associate and form a single functionally unique receptor complex6. Yet, there are several problems with these interpretations for astrocyte growth: (i) Even at dilute (10−10 M) concentrations there may be sufficient cross-reactivity between ligands and opioid receptors so that [Met5]enkephalin might act on µ opioid receptors19 or that morphine might bind to δ opioid sites9. (ii) Most importantly, the present studies were performed on 1-day-old mouse pups (maintained for as long as 8 days in vitro). However, δ opioid receptors are not reported to be expressed until postnatal days 10–14 in rodent brain24,40,46, although [3H]DADLE binding sites have been identified immediately after birth18. Thus, there is evidence that δ opioid receptors may not be present in our glial cultures, although the extent to which tissue culture conditions might artificially induce the premature expression of δ opioid receptors should also be considered. Still another possibility is that a different receptor such as the controversial zeta opioid receptor58 mediates this response. Lastly, morphine might perturb proenkephalin gene expression. Proenkephalin is expressed by astrocytes in vivo42 and in vitro13,25,36,42,45,51. Altered proenkephalin expression may, in turn, modulate opioid-dependent astrocyte growth by an autocrine and/or paracrine mechanism(s)13.
Glia are ten times more numerous than neurons in the CNS1 and are crucial in the normal function of the nervous system. During development, the role of glia is perhaps more profound, since glia provide essential trophic support necessary for the establishment, organization, and survival of maturing neuronal systems22. The findings that astrocyte proliferation and differentiation are vulnerable to the effects of morphine may explain at least one of the mechanisms responsible for the neurological and psychological impairments observed in infants born to mothers addicted to opiates.
Acknowledgments
The authors wish to thank Dr. John Porter for expert technical assistance and the use of the Southern Micro Instruments Image Analysis System (MicroComp); Dr. John Carney for providing morphine sulfate and for expert technical advice; Drs. Narayan Bhat, William Bartlett, and Harold Traurig for critical advice and comments; and Dr. M.B. Nikitovitch-Winer for continued support and encouragement. Supported by a grant from the National Institute on Drug Abuse (DA 06204) to K.F.H.
REFERENCES
- 1.Bass NH, Hess HH, Pope A, Thalheimer C. Quantitative cytoarchitectonic distribution of neurons, glia and DNA in rat cerebral cortex. J. Comp. Neurol. 1971;143:481–490. doi: 10.1002/cne.901430405. [DOI] [PubMed] [Google Scholar]
- 2.Bicknell RJ, Luckman SM, Inenaga K, Mason WT, Hatton GI. Beta adrenergic and opioid receptors on pituicytes cultured from adult rat neurohypophysis: regulation of cell morphology. Brain Res. Bull. 1989;22:379–388. doi: 10.1016/0361-9230(89)90065-8. [DOI] [PubMed] [Google Scholar]
- 3.Bowen WD, Gentleman S, Herkenham M, Pert CB. Interconverting mu and delta forms of the opiate receptor in rat striatal patches. Proc. Natl. Acad. Sci. (USA) 1981;78:4818–4822. doi: 10.1073/pnas.78.8.4818. [DOI] [PMC free article] [PubMed] [Google Scholar]
- 4.Buckingham JC. Secretion of corticotrophin and its hypothalamic releasing factor in response to morphine and opioid peptides. Neuroendocrinology. 1982;35:111–116. doi: 10.1159/000123364. [DOI] [PubMed] [Google Scholar]
- 5.Davila-Garcia MI, Azmitia EC. Effects of acute and chronic administration of Leu-enkephalin on cultured serotonergic neurons: evidence for opioids as inhibitory neuronal growth factors. Dev. Brain Res. 1989;49:97–103. doi: 10.1016/0165-3806(89)90062-x. [DOI] [PubMed] [Google Scholar]
- 6.De Vries TJ, Hogenboom F, Mulder AH, Schoffelmeer ANM. Ontogeny of mu, delta and kappa-opioid receptors mediating inhibition of neurotransmitter release and adenylate cyclase activity in rat brain. Dev. Brain Res. 1990;54:63–69. doi: 10.1016/0165-3806(90)90065-7. [DOI] [PubMed] [Google Scholar]
- 7.Fedoroff S. Astrocyte cell lineage III. The morphology of differentiating mouse astrocytes in colony culture. J. Neurocytol. 1984;13:1–20. doi: 10.1007/BF01148315. [DOI] [PubMed] [Google Scholar]
- 8.Ghadirian A. A tissue culture study of morphine dependence on the mammalian CNS. Can. Psychiatr. Ass. J. 1969;14:607–615. doi: 10.1177/070674376901400609. [DOI] [PubMed] [Google Scholar]
- 9.Goldstein A. Binding selectivity profiles for ligands of multiple receptor types: focus on opioid receptors. TIPS. 1987;8:456–459. [Google Scholar]
- 10.Hammer RP, Jr, Ricalde AA, Seatriz JV. Effects of opiates on brain development. Neurotoxicology. 1989;10:475–484. [PubMed] [Google Scholar]
- 11.Hauser KF, McLaughlin PJ, Zagon IS. Endogenous opioids regulate dendritic growth and spine formation in developing rat brain. Brain Res. 1987;416:157–161. doi: 10.1016/0006-8993(87)91509-5. [DOI] [PubMed] [Google Scholar]
- 12.Hauser KF, McLaughlin PJ, Zagon IS. Endogenous opioid systems and the regulation of dendritic growth and spine formation. J. Comp. Neurol. 1989;281:13–22. doi: 10.1002/cne.902810103. [DOI] [PubMed] [Google Scholar]
- 13.Hauser KF, Osborne JG, Stiene-Martin A, Melner MH. Cellular localization of proenkephalin mRNA and enkephalin peptide products in cultured astrocytes. Brain Res. 1990;522:347–353. doi: 10.1016/0006-8993(90)91482-v. [DOI] [PMC free article] [PubMed] [Google Scholar]
- 14.Hertz L, Juurlink BHJ, Szuchet S. Cell cultures. In: Lajtha A, editor. Handbook of Neurochemistry. Vol. 8. New York: Plenum Press; 1985. pp. 603–661. [Google Scholar]
- 15.Hunter T. Oncogenes and growth control. In: Bradshaw RA, Prentis S, editors. Oncogenes and Growth Factors. New York: Elsevier Science Publishers; 1987. pp. 135–142. [Google Scholar]
- 16.Ilyinsky OB, Kozlova MV, Kondrikova ES, Kalentchuk VU, Titov MI, Bespalova ZdD. Effects of opioid peptides and naloxone on nervous tissue in culture. Neuroscience. 1987;22:719–735. doi: 10.1016/0306-4522(87)90368-x. [DOI] [PubMed] [Google Scholar]
- 17.Kimelberg HK, Ransom BR. Physiological and pathological aspects of astrocytic swelling. In: Fedoroff S, Vernadakis A, editors. Astrocytes, Cell Biology and Pathology of Astrocytes. Vol. 3. New York: Academic Press, Inc; 1986. pp. 129–166. [Google Scholar]
- 18.Kornblum HI, Loughlin SE, Leslie FM. Effects of morphine on DNA synthesis in neonatal rat brain. Dev. Brain Res. 1987;31:45–52. doi: 10.1016/0165-3806(87)90081-2. [DOI] [PubMed] [Google Scholar]
- 19.Kornblum HI, Hurlbut DE, Leslie FM. Postnatal development of multiple opioid receptors in rat brain. Dev. Brain Res. 1987;37:21–41. doi: 10.1016/0165-3806(87)90226-4. [DOI] [PubMed] [Google Scholar]
- 20.Licata SP, Nalwal JW, Hough LB. Actions of morphine on histamine dynamics in the mouse brain: a strain comparison. Biochem. Pharmacol. 1990;39:978–981. doi: 10.1016/0006-2952(90)90219-b. [DOI] [PubMed] [Google Scholar]
- 21.Loughlin SE, Massamiri TR, Kornblum HI, Leslie FM. Postnatal development of opioid systems in rat brain. Neuropeptides. 1985;5:469–472. doi: 10.1016/0143-4179(85)90056-3. [DOI] [PubMed] [Google Scholar]
- 22.Manthorpe M, Rudge JS, Varon S. Astroglial cell contributions to neuronal survival and neuritic growth. In: Fedoroff S, Vernadakis A, editors. Astrocytes: Biochemistry, Physiology, and Pharmacology of Astrocytes. Vol. 2. New York: Academic Press, Inc; 1986. pp. 315–376. [Google Scholar]
- 23.Mauer R. Multiplicity of opiate receptors in different species. Neurosci. Lett. 1982;30:303–307. doi: 10.1016/0304-3940(82)90417-7. [DOI] [PubMed] [Google Scholar]
- 24.McDowell J, Kitchen I. Development of opioid systems: peptides, receptors, and pharmacology. Brain Res. Rev. 1987;12:397–421. doi: 10.1016/0165-0173(87)90006-3. [DOI] [PubMed] [Google Scholar]
- 25.Melner MH, Low KG, Allen RG, Nielson CP, Young SL, Saneto RP. The regulation of proenkephalin expression in a distinct population of glial cells. EMBO J. 1990;9:791–796. doi: 10.1002/j.1460-2075.1990.tb08175.x. [DOI] [PMC free article] [PubMed] [Google Scholar]
- 26.Miller RH, David S, Patel R, Abney ER, Raff MC. A quantitative immunohistochemical study of macroglial cell development in the rat optic nerve: in vivo evidence for two distinct astrocyte lineages. Dev. Biol. 1985;111:35–41. doi: 10.1016/0012-1606(85)90432-4. [DOI] [PubMed] [Google Scholar]
- 27.Morrison RS, de Vellis J. Differentiation of purified astrocytes in a chemically defined medium. Dev. Brain Res. 1983;9:337–345. doi: 10.1016/0165-3806(83)90030-5. [DOI] [PubMed] [Google Scholar]
- 28.Pert CB, Aposhian D, Snyder SH. Phylogenetic distribution of opiate receptor binding. Brain Res. 1974;75:356–361. doi: 10.1016/0006-8993(74)90761-6. [DOI] [PubMed] [Google Scholar]
- 29.Raff MC, Abney ER, Cohen J, Lindsay R, Noble M. Two types of astrocytes in culture of developing rat white matter: differences in morphology, surface gangliosides and growth characteristics. J. Neurosci. 1983;3:1289–1300. doi: 10.1523/JNEUROSCI.03-06-01289.1983. [DOI] [PMC free article] [PubMed] [Google Scholar]
- 30.Rougon G, Noble M, Mudge AW. Neuropeptides modulate the beta-adrenergic response of purified astrocytes in vitro. Nature. 1983;305:715–717. doi: 10.1038/305715a0. [DOI] [PubMed] [Google Scholar]
- 31.Ruffin NE, Reed BL, Finnin BC. Effects of morphine withdrawal on cells in continuous culture. Life Sci. 1969;8:671–675. doi: 10.1016/0024-3205(69)90001-0. [DOI] [PubMed] [Google Scholar]
- 32.Sakellaridis N, Vernadakis A. An unconventional response of adenylate cyclase to morphine and nalaxone in the chicken during early development. Proc. Natl. Acad. Sci. (USA) 1986;83:2738–2742. doi: 10.1073/pnas.83.8.2738. [DOI] [PMC free article] [PubMed] [Google Scholar]
- 33.Schmahl W, Funk R, Miaskowski U, Plendl J. Long-lasting effects of naltrexone, an opioid receptor antagonist, on cell proliferation in developing rat forebrain. Brain Res. 1989;486:297–300. doi: 10.1016/0006-8993(89)90515-5. [DOI] [PubMed] [Google Scholar]
- 34.Schoffelmeer ANM, Hansen HA, Stoof JC, Mulder AH. Blockade of D2 dopamine receptors strongly enhances the potency of enkephalins to inhibit dopamine-sensitive adenylate cyclase in rat neostriatum: involvement of delta- and mu-opioid receptors. J. Neurosci. 1986;6:2235–2239. doi: 10.1523/JNEUROSCI.06-08-02235.1986. [DOI] [PMC free article] [PubMed] [Google Scholar]
- 35.Schwartz JP. Chronic exposure to opiate agonists increases proenkephalin biosynthesis in NG108 cells. Mol. Brain Res. 1988;3:141–146. doi: 10.1016/0169-328x(88)90059-9. [DOI] [PubMed] [Google Scholar]
- 36.Shinoda H, Marini AM, Cosi C, Schwartz JP. Brain region and gene specificity of neuropeptide gene expression in cultured astrocytes. Science. 1989;245:415–417. doi: 10.1126/science.2569236. [DOI] [PubMed] [Google Scholar]
- 37.Slotkin TA, Whitmore WL, Salvaggio M, Seidler FJ. Perinatal methadone addiction affects brain synaptic development of biogenic amine systems in the rat. Life Sci. 1979;24:1223–1230. doi: 10.1016/0024-3205(79)90059-6. [DOI] [PubMed] [Google Scholar]
- 38.Slotkin TA, Seidler FJ, Whitmore WL. Effects of maternal methadone administration on ornithine decarboxylase in brain and heart of the offspring: relationships of enzyme activity to dose and growth impairment in the rat. Life Sci. 1980;26:861–867. doi: 10.1016/0024-3205(80)90348-3. [DOI] [PubMed] [Google Scholar]
- 39.Smith AA, Hui FW, Crofford MJ. Inhibition of growth in young mice treated with d,l-methadone. Eur. J. Pharmacol. 1977;43:307–314. doi: 10.1016/0014-2999(77)90036-x. [DOI] [PubMed] [Google Scholar]
- 40.Spain JW, Roth BL, Coscia CJ. Differential ontogeny of multiple opioid receptors (mu, delta and kappa) J. Neurosci. 1985;5:585–588. doi: 10.1523/JNEUROSCI.05-03-00584.1985. [DOI] [PMC free article] [PubMed] [Google Scholar]
- 41.Sparber SB, Lichtblau L. Neonatal undernutrition alters responsiveness to morphine in mature rats: a possible source of epiphenomena in developmental drug studies. J. Pharmacol. Exp. Ther. 1983;225:1–7. [PubMed] [Google Scholar]
- 42.Spruce BA, Curtis R, Wilkin GP, Glover DM. A neuropeptide precursor in cerebellum: proenkephalin exists in subpopulations of both neurons and astrocytes. EMBO J. 1990;9:1787–1795. doi: 10.1002/j.1460-2075.1990.tb08303.x. [DOI] [PMC free article] [PubMed] [Google Scholar]
- 43.Stiene-Martin A, Hauser KF. Opioids directly modulate the growth of mixed-glial cultures: suppression of astrocyte proliferation by Met-enkephalin. Soc. Neurosci. Abstr. 1989;15:278. [Google Scholar]
- 44.Stiene-Martin A, Hauser KF. Opioid-dependent growth of glial cultures: suppression of astrocyte DNA synthesis by Met-enkephalin. Life Sci. 1990;46:91–98. doi: 10.1016/0024-3205(90)90041-o. [DOI] [PubMed] [Google Scholar]
- 45.Stiene-Martin A, Osborne JG, Hauser KF. Co-localization of proenkephalin mRNA using cRNA probes and a cell-type-specific immunocytochemical marker for intact astrocytes in vitro. J. Neurosci. Meth. doi: 10.1016/0165-0270(91)90037-z. (in press) [DOI] [PubMed] [Google Scholar]
- 46.Tavani A, Robson LE, Kosterlitz HW. Differential postnatal development of mu, delta and kappa-opioid binding sites in mouse brain. Dev. Brain Res. 1985;23:306–309. doi: 10.1016/0165-3806(85)90056-2. [DOI] [PubMed] [Google Scholar]
- 47.Toran-Allerand CD. On the genesis of sexual differentiation of the central nervous system: morphogenetic consequences of steroidal exposure and possible role of α-fetoprotein. Prog. Brain Res. 1984;61:63–98. doi: 10.1016/s0079-6123(08)64429-5. [DOI] [PubMed] [Google Scholar]
- 48.Vernadakis A, Estin C, Gibson DA, Amott S. Effects of methadone on ornithine decarboxylase and cyclic nucleotide phosphohydrolase in neuronal and glial cell cultures. J. Neurosci. Res. 1982;7:111–117. doi: 10.1002/jnr.490070203. [DOI] [PubMed] [Google Scholar]
- 49.Vernadakis A, Kentroti S. Opioids influence neurotransmitter phenotypic expression in chick embryonic neuronal cultures. J. Neurosci. Res. 1990;26:342–348. doi: 10.1002/jnr.490260311. [DOI] [PubMed] [Google Scholar]
- 50.Vertes Z, Melegh G, Vertes M, Kovacs S. Effect of naloxone and D-Met2-Pro5-enkephalinamide treatment on the DNA synthesis in the developing rat brain. Life Sci. 1982;31:119–126. doi: 10.1016/0024-3205(82)90423-4. [DOI] [PubMed] [Google Scholar]
- 51.Vilijn M-H, Vayasse PJ-J, Zukin RS, Kessler JA. Expression of preproenkephalin mRNA by cultured astrocytes and neurons. Proc. Natl. Acad. Sci. (USA) 1988;85:6551–6555. doi: 10.1073/pnas.85.17.6551. [DOI] [PMC free article] [PubMed] [Google Scholar]
- 52.Wilson GS, McCreary R, Kean J, Baxter JC. The development of preschool children of heroin-addicted mothers: a controlled study. Pediatrics. 1979;63:135–141. [PubMed] [Google Scholar]
- 53.Willson NJ, Schneider JF, Roizin L, Fleiss JF, Rivers W, Demartini JE. Effects of methadone HCl on the growth of organotypic cerebellar cultures prepared from methadone tolerant and control rats. J. Pharmacol. Exp. Ther. 1976;199:368–374. [PubMed] [Google Scholar]
- 54.Zagon IS, McLaughlin PJ. Increased brain size and cellular content in infant rats treated with an opiate antagonist. Science. 1983;221:1179–1180. doi: 10.1126/science.6612331. [DOI] [PubMed] [Google Scholar]
- 55.Zagon IS, McLaughlin PJ. Beta-funaltrexamine (β-FNA) and the regulation of body and brain development in rats. Brain Res. Bull. 1986;17:5–9. doi: 10.1016/0361-9230(86)90155-3. [DOI] [PubMed] [Google Scholar]
- 56.Zagon IS, McLaughlin PJ. Endogenous opioid systems regulate cell proliferation in the developing rat brain. Brain Res. 1987;412:68–72. doi: 10.1016/0006-8993(87)91440-5. [DOI] [PubMed] [Google Scholar]
- 57.Zagon IS, McLaughlin PJ. Endogenous opioid systems regulate the growth of neural tumor cells in culture. Brain Res. 1989;490:14–25. doi: 10.1016/0006-8993(89)90425-3. [DOI] [PubMed] [Google Scholar]
- 58.Zagon IS, Goodman SR, McLaughlin PJ. Demonstration and characterization of zeta (ζ), a growth-related opioid receptor, in a neuroblastoma cell line. Brain Res. 1990;511:181–186. doi: 10.1016/0006-8993(90)90159-9. [DOI] [PubMed] [Google Scholar]


