Abstract
Background
Diffusion tensor imaging exploits preferential diffusional motion of water molecules residing within tissue compartments for assessment of tissue structural anisotropy. However, instrumentation and post-processing errors play an important role in determination of diffusion tensor elements. In the study, several experimental factors affecting accuracy of diffusion tensor determination were analyzed.
Materials and methods
Effects of signal-to-noise ratio and configuration of the applied diffusion-sensitizing gradients on fractional anisotropy bias were analyzed by means of numerical simulations. In addition, diffusion tensor magnetic resonance microscopy experiments were performed on a tap water phantom and bovine articular cartilage-on-bone samples to verify the simulation results.
Results
In both, the simulations and the experiments, the multivariate linear regression of the diffusion-tensor analysis yielded overestimated fractional anisotropy with low SNRs and with low numbers of applied diffusion-sensitizing gradients.
Conclusions
An increase of the apparent fractional anisotropy due to unfavorable experimental conditions can be overcome by applying a larger number of diffusion sensitizing gradients with small values of the condition number of the transformation matrix. This is in particular relevant in magnetic resonance microscopy, where imaging gradients are high and the signal-to-noise ratio is low.
Keywords: microscopy, diffusion tensor imaging, anisotropy, signal-to-noise ratio, cartilage
Introduction
Diffusion tensor imaging (DTI) is a widely used magnetic-resonance imaging (MRI) technique, which enables noninvasive assessment of structural integrity of fibrous tissues with a high degree of anisotropy, such as brain white matter and myocardium.1, 2 Specifically, the technique could be exploited for a dynamical follow-up of minor anisotropy alternations due to tissue structural changes arising during progressive disease development, such as schizophrenia3, multiple sclerosis4 and myocardium infarct.5 The method is gaining clinical interest also in applications to tissues with less expressive anisotropy or highly localized compartments with increased level of fiber alignment, such as articular cartilage6, 7, which is a relatively thin tissue with a thickness of up to few millimeters and has a depth-dependent collagen fiber architecture. In DTI, the basic assumption is that diffusive motion of spin bearing particles within the tissue is determined by an alignment of tissue fibers; hence their diffusional anisotropy directly corresponds to anisotropy of the restrictive fibers. The method basically consists of an imaging part, usually employing spin-echo based MRI pulse sequences8, to which a pair of diffusion sensitizing gradients (DSG) is added in order to encode magnetic resonance (MR) signal of spin bearing particles with diffusive motion, resulting into a diffusion-attenuated MR signal. In order to obtain sufficient information on anisotropy of diffusive motion, DSG must be applied in at least six non-coplanar directions to determine six independent elements of the laboratory-frame diffusion tensor.9 In the DT-MRI analysis, diffusion anisotropy is calculated by transforming the laboratory-frame diffusion tensor into the principal frame of reference using diagonalization.10
Determination of diffusion anisotropy can be biased due to instrumentation imperfections9, such as non-optimally calibrated DSG, and due to postprocessing errors.11, 12 It was shown, that a number and directionality of the applied DSG configuration play an important role in a noise propagation in DTI post-processing analysis.12 Specifically, noise propagation in DTI, resulting to noise-induced rotational variance of diffusion tensor ellipsoid, can be reduced by decreasing a condition number (CN) of the b-matrix12 as well as by increasing the signal-to-noise ratio (SNR).11 Therefore, attempts were made to find a robust measure for diffusion anisotropy, such as the lattice index.13 Among all the proposed measures fractional anisotropy (FA) became commonly accepted. Accuracy in determination of diffusion tensor is of a great importance in biomedical imaging as falsely measured tissue anisotropy could lead to clinical misinterpretations and inappropriate treatment decisions.14
Reliability of the DTI method can be efficiently tested either by using perfectly aligned fiber phantoms with an a priori known anisotropy, yielding anisotropic diffusion along the preferential fiber orientation15, 16, or by using completely isotropic materials. In both cases, overestimated apparent anisotropy could arise as an undesirable consequence of the DTI analysis. A fundamental question is, how the DTI factors, specifically SNR and a choice of a DSG configuration, influence accuracy of a diffusion tensor determination. This issue is specifically important in diffusion tensor magnetic resonance microscopy (DT-MRM), in which SNR is usually low due a high diffusion weighting and due to a small voxel size, respectively. The effect of low SNR is more pronounced in some biomaterials with anisotropic diffusion that exhibit short T2 relaxation time, as for example articular cartilage.17, 18
The main motivation for this study is analysis of factors influencing diffusion anisotropy in DTMRM signal post-processing. The study is organized into two parts. In the first part, the effect of noise propagation from synthetic raw DTI data to the diffusion tensor eigenvalues is examined theoretically for different DSG configurations: selected commonly used, random and isotropic DSG configurations. In the second part, the theoretical results are verified experimentally. DT-MRM was performed for two different materials, tap water with isotropic diffusion and bovine articular cartilage-on-bone samples before and after compression. The study is in particular focused to unfavorable experimental conditions that often arise in DT-MRM and could result in biased diffusional anisotropy.
Materials and methods
Theoretical background and simulations
Single-voxel DTI data of an isotropic medium with a diffusion constant equal to D0 were generated as a NDSG-dimensional column vector (being the number of DSG directions) containing normalized magnitude MR signal intensities
| [1] |
where is referred to as diffusion attenuation 19 and is a noise factor. Here, is gyromagnetic ratio, is DSG amplitude, δ is duration of an individual DSG pulse, Δ is time-separation between the two DSG pulses and is signal-to-noise ratio in the pulsed field gradient (PFG) pulse sequence. The noise was introduced to the generated DTI data by a NDSG-dimensional noise vector ς, of which components ς ∈ [0,1] are uniformly distributed random numbers, which are included in the noise factor. Seventeen commonly used DSG directions12, presented in Table 1, as well as different random and isotropic DSG directions with 6 ≤ NDSG ≤ 300 were considered. With random DSG configurations, directions of diffusion sensitizing gradients were modeled as
| [2] |
Table 1.
A list of the analyzed commonly used diffusion sensitizing gradients (DSG) configurations in DTI, adopted from12, along with the corresponding values of NDSG, condition number(CN) and P.
| # | Scheme name | NDSG[1] | CN[1] | P[%] |
|---|---|---|---|---|
| 1 | Tetrahedral | 6 | 9.148 | 16.53 |
| 2 | Cond 6 | 6 | 5.984 | 14.19 |
| 3 | Decahedral | 10 | 2.748 | 10.70 |
| 4 | Jones noniso | 7 | 2.560 | 12.13 |
| 5 | Dual-gradient | 6 | 2.000 | 11.44 |
| 6 | Jones 10 | 10 | 1.624 | 9.67 |
| 7 | Jones 20 | 20 | 1.615 | 8.10 |
| 8 | Jones 30 | 30 | 1.594 | 7.16 |
| 9 | Papadakis | 12 | 1.587 | 9.29 |
| 10 | Jones 6 | 6 | 1.583 | 11.04 |
| 11 | Muthupallai | 6 | 1.581 | 11.11 |
| 12 | Tetraortho | 7 | 1.527 | 10.68 |
| 13 | DSM 6 | 6 | 1.323 | 11.41 |
| 14 | DSM 10 | 10 | 1.324 | 10.02 |
| 15 | DSM 20 | 20 | 1.668 | 8.43 |
| 16 | DSM 30 | 30 | 1.430 | 7.45 |
| 17 | DSM 40 | 40 | 1.401 | 6.87 |
where ξx,n ∈ [0, 1], ξy,n ∈ [0, 1] and ξz,n ∈ [0, 1] are three evenly distributed random numbers with . Isotropic DSG configurations were obtained from the corresponding random DSG configurations (for each NDSG) by numerically minimizing their average Coulomb-like interaction energy (i.e., the Thompson’s problem20)
| [3] |
using Monte Carlo simulation approach.21 For each DSG, its transformation matrix was calculated using definition
| [4] |
where
| [5] |
and the effective gradient for a spin echo-like DTI pulse sequence including a pair of DSG gradients is equal to
| [6] |
The 3 x 3 b-value matrix 𝒷 defined in Eq. 4 has only six different elements that can be arranged into a 1 x 6 raw vector with elements 𝒷 = (bn,xx, bn,yy, bn,zz, bn,xy, bn,xz, bn,yz). The raw vectors can be further arranged into a NDSG × 6 DTI transformation matrix 𝒷. A condition number of the matrix was calculated as CN = ||𝒷||||𝒷−1. The components of the diffusion tensor in the laboratory frame of reference, 𝓓 = (𝓓xx, 𝓓yy, 𝓓zz, 𝓓xy, 𝓓xz, 𝓓yz)T, were calculated by solving an over-determined system of equations, 𝒷𝓓 = −In{I}, in a form of
| [7] |
The laboratory-frame diffusion tensor,
| [8] |
was then diagonalized to the principal-axis-frame diffusion tensor
| [9] |
The diffusion tensor eigenvalues Dv, D2, and D3, were used to calculate the average diffusion coefficient, , and the fractional anisotropy, defined as10
| [10] |
For each DSG configuration, either taken from the Table 112 or calculated as random or isotropic directions, diffusion tensor eigenvalues as well as
the corresponding ADC and FA were calculated as a function of DA(0 ≤ DA ≤ 1) and SNR(1 ≤ SNR ≤ 100) for Nˤ = 100 different noise vectors ˤ mimicking Nˤ different experiments of which results were then averaged in order to reduce their randomness:
| [11] |
The diffusion tensor quantities were then averaged over the characteristic window of the domain (0.4 ≤ DA ≤ 0.6,20 ≤ SNR ≤ 60) to obtain their representative characteristic scalar values denoted as D1, D2, D3, ADC and FA. For random DSG configurations, a relation between CN and FA was modeled with a power-law function
| [12] |
where αFA and kFA are two fitting parameters. In the simulations, water-like isotropic medium with D0 = 2.3.10−9 m2/s was considered.
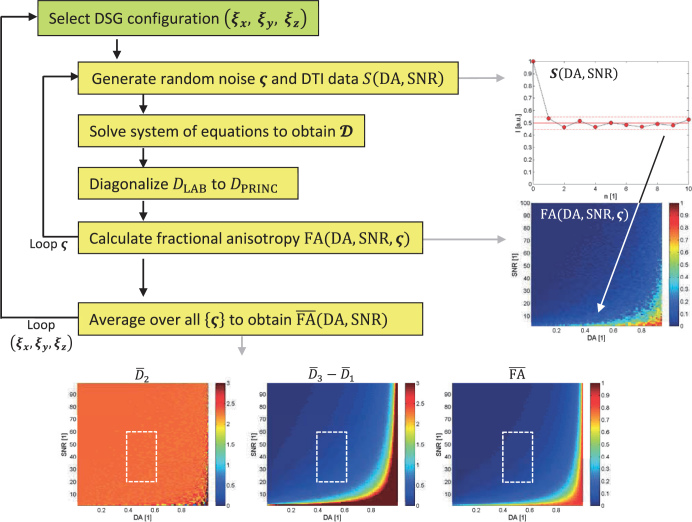
Simulations were performed using an in-house written program, developed within the Matlab programming environment (MathWorks Inc., Natick, MA, USA). Flowcharts presenting the simulation algorithm for the simulations including DSG configurations from Table 1 and random or isotropic DSG configurations are shown in Figure 1.
Figure 1.
A simulation flowchart for analysis of selected commonly used and random/isotropic diffusion sensitizing gradients (DSG) configurations.
Additional numerical simulations were performed in order to investigate the effect of noise propagation in tissues with low diffusional anisotropy. In these simulations, diffusion tensor in the principal frame of reference was considered as a prolate spheroid, which was, for the sake of convenience, oriented with the largest dimension along the z-axis of the laboratory frame of reference (zLAB). In this direction, non-restricted diffusion was assumed, i.e., the corresponding eigenvalue was equal to D0, while diffusion was reduced to αD0 (0 ≤ α ≤ 1) in the other two orthogonal directions. The principal-frame diffusion tensor was hence modeled as
| [13] |
The primary eigenvector (corresponding to the largest eigenvalue) was equal to P3 = (0, 0, 1), while the other two eigenvectors were chosen as and . The eigenvectors determined the change-of-basis transformation matrix between the principal and the laboratory frame of reference:
| [14] |
The transformation of the diffusion tensor into the laboratory frame of reference was calculated as DLAB = P DPRINC P−1. In the case of the above-defined prolate spheroid, components of the diffusion tensor in the laboratory frame of reference were expressed by where ᾱ = (α, α, 1). Normally distributed (Gaussian) noise was added to the MR signal intensities. For a given preset FA value and for a given DSG configuration, the results of simulations are presented by a difference between the calculated fractional anisotropy FA’ and the preset fractional anisotropy FA, i.e., by . In addition, an orientation difference between the preset and the calculated primary eigenvector, i.e., , is presented as well.
DT-MRM of tap water
DT-MRM experiments of a tap water phantom with a cone shape were performed on a horizontal-bore 2.35-T MRI scanner (Oxford Instruments, Abingdon, United Kingdom), equipped with microimaging accessories (Bruker, Ettlingen, Germany) and controlled by a Tecmag Apollo spectrometer (Tecmag, Houston TX, USA). The gradient system had top gradients of 0.25 T/m and slew rate of 1200 mT/m/ ms. For acquisition of one-dimensional DTI profiles along cone axis, a spin-echo based 1D DT-MRM sequence was employed. For the sequence, the following imaging parameters were used: 256 acquisition points, field of view 40 mm, spatial resolution of 156 μm, dwell time 10 μs, number of averages 4 (with the half-Cyclops phase cycling scheme), echo and repetition time TE/TR = 30/1030 ms. Square-shaped DSG pulses with G0 = 0.157T/m and δ / Δ = 3.0/20 ms were used, yielding the corresponding diffusion attenuation equal to DA = 0.50. 1D DT-MRM was examined for isotropic DSG configurations with NDSG = 6 − 100. The contribution of imaging gradients to the DTI transformation matrix was minimized using non-selective (hard) excitation RF pulses and by performing imaging in just one dimension. As the read gradients in 1D DT-MRM were applied only during or close to MR signal acquisition, their contribution to the transformation matrix was minor and was therefore neglected. Prior to the experiments, Stejskal-Tanner plots were measured for each gradient channel. The gradient channels were then calibrated to yield a diffusion constant of water at room temperature.
DT-MRM of articular cartilage
Bovine cartilage-on-bone samples, containing an intact cartilage tissue and the underlying part of a subchondral bone, were carefully dissected from fresh stifle joints of bovine femur bones (provided by a local meat provider) using a commercially available bow saw and a dentist driller set (Meisinger, Neuss, Germany). Samples were cut into cylindrically shaped pieces with a diameter of 6 mm and with an average height of 8 mm, fitting to an NMR tube with an inner diameter of 7 mm. After dissection, the samples were washed in physiological phosphate buffer saline (PBS) and sealed into plastic bags for deep-freezing storage.22 Prior to DT-MRM experiments, each sample was allowed to spontaneously defreeze at temperature of 8°C. Then, the sample was inserted into an NMR tube and immersed into Fluorinert FC-70 (Sigma-Aldrich, Germany), which was used to prevent samples from desiccation. Compression of articular cartilage was obtained by loading a plastic indenter, positioned above the articular surface, with weight-induced pressure of p = 0.56 at the indenter-cartilage interface. After the application of an external pressure, each sample was allowed for spontaneous equilibration for 2 hours.17
DT-MRM experiments on articular cartilage-on-bone samples were performed on a 7-Tesla vertical-bore superconducting magnet equipped with microimaging accessories and controlled by the Avance spectrometer (Bruker, Ettlingen, Germany). The gradient system had maximum gradients of 1 T/m and slew rate of 4000 mT/m/ms. Due to relatively fast transversal relaxation processes in cartilage tissue, DT-MRM was performed using a stimulated-echo pulse sequence. The following imaging parameters were used: imaging matrix 256 × 128 (or 128 × 64), field of view 20 × 10 mm, isotropic in-plane resolution of 78 um (or 156 um), slice thickness 2 mm, dwell time 10 μs (or 20 μs), number of averages 32, echo and repetition time. TE/TR = 40/2000 ms. A DSG configuration with NDSG = 6 and CN = 2.618 was used.18 Square-shaped DSG pulses with G0 = 0.19T/m and δ/Δ = 2.1/30 ms were used, yielding the corresponding diffusion attenuation equal to DA = 0.47. Again, the imaging gradients (read-dephase and phase gradients) were applied immediately before MR signal acquisition in order to minimize their contribution to the transformation matrix 𝒷. All gradients, the imaging gradients and DSG, were considered in the numerical calculation of the transformation matrix elements (according to Eq. 4). All DT-MRM analyses were performed within the Matlab programming environment.
Results
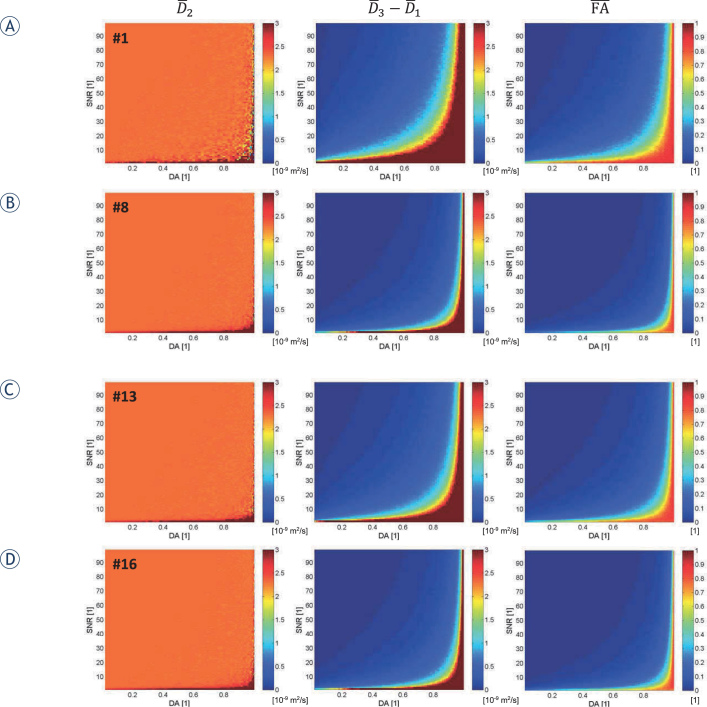
Simulated 2D maps over the DA-SNR domain of the second largest eigenvalue D̅2 (DA, SNR), of the difference among the smallest and the largest eigenvalue D̅3 (DA, SNR) - D̅1 (DA, SNR) and of the corresponding fractional anisotropy FA (DA, SNR) for four representative DSG configurations, i.e., the DSG configurations #1, #8, #13 and #16 from Table 1, are presented in Figure 2. Two of the selected DSG configurations correspond to the commonly used DSG configurations (#1 with NDSG = 6 and #8 with NDSG = 30 in Figure 3A, B, respectively), while the other two correspond to the DSG configurations, optimized in12 with respect to the condition number CN (again with NDSG = 6 and NDSG = 30). It can be seen that the largest deviations of the studied diffusion tensor quantities from their ideal values (D̅2 from D0 from D̅3 − D̅1, from 0 and FA from 0) are found at high values of DA and low values of SNR. From the result in Table 1, it is evident that region proportions p of poorly determined DT eigenvalues, i.e., dark red regions in maps in Figure 2 defined by the condition D̅3 − D̅1 > 1.3D0 = 3∙10−9 m2/s de-crease with a decreasing . The results in Table 1 also indicate that for all DSG configurations, the proportion P could be additionally decreased by increasing NDSG.
Figure 2.
Simulated two dimensional maps of D̅2 (DA signal - to - [SNR]), D̅3 (DA, SNR) - D̅1 (DA, SNR), and fractional anisotropy (FA)(DA, SNR) for four representative, commonly used diffusion sensitizing gradients (DSG) configurations from Table 1 (#1, #8, #13 and #16).
Figure 3.
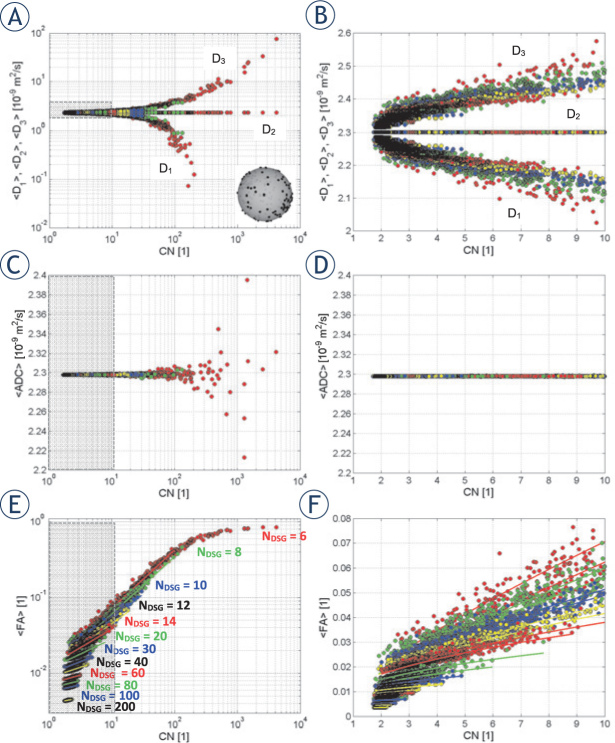
Panels on the left show simulated average values of diffusion tensor eigenvalues D1,D2 and D3 (A), of average diffusion constant ADC(C) and of fractional anisotropy FA(E) as a function of condition number 1<CN<104 for random diffusion sensitizing gradients (DSG) configurations. Panels on the right (B,D,F) display the zoomed left-side panels for condition numbers in the range 1<CN<10. Solid-line curves (E,F) correspond to best fits of the model function [Eq. 12] to the simulated data. The graphical insert in panel (A) illustrates the selected random DSG configuration with NDSG = 220.
Figure 3 shows DA−SNR domain-averaged values of diffusion tensor eigenvalues D1,D2 and D3 (Figure 3A, B) along with the corresponding average diffusion coefficient ADC (Figure 3C, D) and fractional anisotropy FA (Figure 3E, F) as a function of for random DSG configurations with different NDSG = 6, 8, 10, 12, 14, 20, 30, 40, 60, 80, 100, 200. The results are shown in two formats, i.e., the calculated quantities in a log format with a broad range of condition numbers 1<CN<104 are shown in Figure 3A, C, E, while the same quantities in a linear format with the range of 1<CN<104 (zoomed gray regions of the corresponding log graphs) are shown in Figure 3B, D, F. From the graphs in Figure 4 it can be seen that random DSG configurations with low NDSG and high CN overestimate the largest diffusion tensor eigenvalue and underestimate the smallest eigenvalue, while the remaining eigenvalue remains independent on CN and the equality D2 = D0 holds for a broad range of CN. Therefore, the difference D3 − D1 remains non-zero (of the order of ≲0.05D0) also for the smallest D2 values. Interestingly, as the difference is symmetric with respect to D2, its undesired contribution is canceled in the calculation of ACD, of which values are hence only weakly scattered around D0 in a broad range of CN. On the contrary, the symmetric difference D3 − D1 is not canceled in the calculation of FA, which thus contributes to an existence of the apparent fractional anisotropy of a generic isotropic medium. With FA in the range of 1<CN<10, the values of FA span range between 0.01 and 0.08. In Figure 4, the minimal CN = 1.786 was obtained with NDSG = 30. Clearly, apparent fractional anisotropy is highly dependent on the condition number. Solid curves in Figure 3E, F represent best fits of the model function in Eq. 12 to the simulated FA vs. CN data calculated for each NDSG independently. As can be seen from the graphs in Figure 3E, F, the model fits well to the data for CN < 100, while for CN ≳ 100 the model is less accurate due to saturation of FA → 1.
Figure 4.
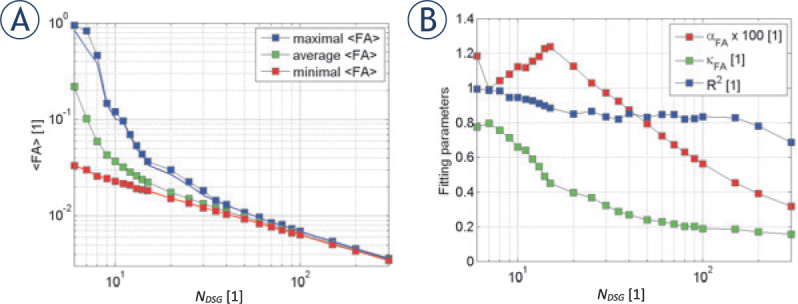
Characteristic values of the simulated correlations between FA and condition number(CN)for random diffusion sensitizing gradients (DSG) configurations as a function of NDSG: maximal, average and minimal values of FA (A), best fit parameters αFA, κFA and fit quality R2(B). The arrow designates a crossover, at which apparent fractional anisotropy drops below fractional anisotropy FA ~0.01. The graphical insert in panel A illustrates the selected random DSG configuration with NDSG = 220.
Figure 4 shows maximal, average and minimal values of FA (Figure 4A) as well as the optimally fitting parameters of Eq. 12, i.e., 𝛼FA and 𝜅FA, along with the corresponding values of R2 as a function of NDSG for random DSG directions (Figure 4B). The data shown in Figure 4 are taken from Figure 3E, F. From Figure 4A it can be seen that the maximal and minimal FA as well as the difference between them decrease with an increasing . NDSG. At NDSG ~40, both, the maximal and minimal drop to approximately 0.01. In addition, as can be seen from Figure 4B, best fit parameters are monotonically decreasing for NDSG > 15. However, fit quality decreases with larger NDSG from R2 = 1 at NDSG = 6 to R2 = 0.7 at NDSG = 300.
Average fractional anisotropy FA (solid symbols) and the corresponding condition number CN (void symbols) as a function of NDSG, for both random (blue symbols) and the corresponding isotropic (red symbols) DSG configurations, are shown in Figure 5. The data shown in Figure 5 were obtained by averaging the corresponding quantities that were calculated with two different random seeds. As can be clearly seen from the blue curves, the condition number is for random DSG configurations in the range of 2 < CN < 10 with a plateau value of ~2, while average fractional anisotropy is a monotonically decreasing function of NDSG. Both CN and average fractional anisotropy values are more scattered at smaller NDSG and less scattered at larger NDSG. With isotropic DSG configurations (red curves), however, both average fractional anisotropy and condition number at a given NDSG are comparatively smaller than with the corresponding random DSG configurations. Moreover, the condition number decreases with an increasing NDSG to approximately NDSG ~30, where it attains a constant plateau value of 1.59±0.01, while the average fractional anisotropy monotonically decreases with an increasing NDSG. A significant drop of the average fractional anisotropy from FA = 0.0083±0.031 at FA = 0.011±0.000 to at NDSG = 30 is noticed for both isotropic as well as random DSG configurations.
Figure 5.
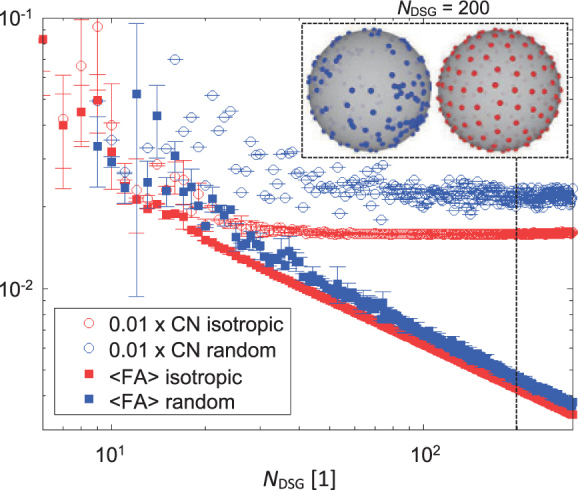
Simulated average fractional anisotropy FA (solid symbols) and the corresponding condition number CN(void symbols) as a function of NDSG for random (blue symbols) and isotropic (red symbols) diffusion sensitizing gradients (DSG) configurations. The graphical insert illustrates a distribution of DSG directions in a random and an isotropic DSG configuration with NDSG = 200.
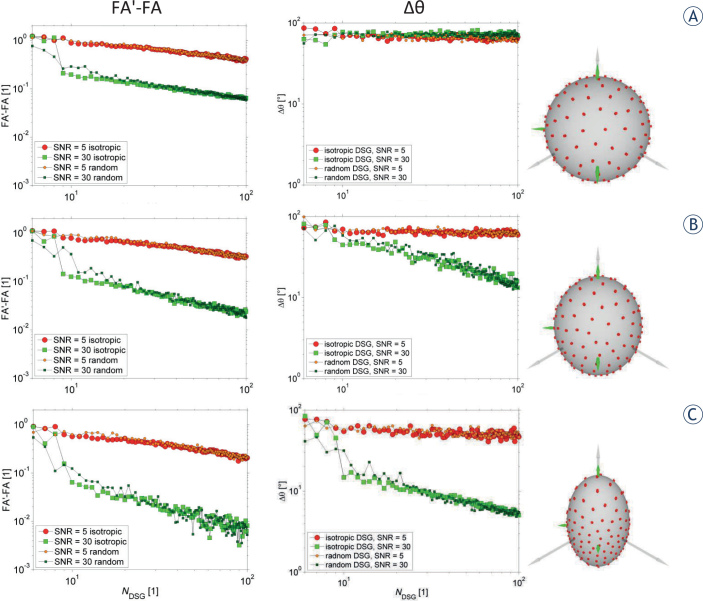
Figure 6 depicts results of numerical simulations that were performed with three different preset fractional anisotropies (FA = 0.0, 0.1, 0.3) and with two different SNRs (SNR = 5, 30). In the simulations random and isotropic DSG configurations with NDSG = 6-100 were considered, while diffusion attenuation was held constant by setting G0 = 0.3 T/m and δ/Δ = 2/15 ms. For each DSG configuration, the results are displayed as an average of Nς = 100 simulation runs of different noise vectors. As can be seen, the curves of FA'–FA and the curves of ∆θare decreasing with an increasing NDSG and SNR; both curve types are decreasing also with an increasing preset FA. Interestingly, the difference of FA'–FA is largest with small NDSG ≤ 10 with both random and isotropic DSG configurations (irrespective of the preset FA value and SNR).
Figure 6.
The results of numerical simulations with three different fractional anisotropy (FA) values: 0, 0.1, and 0.3 for isotropic (FA = 0) vs. anisotropic (FA = 0.1, 0.3) case.
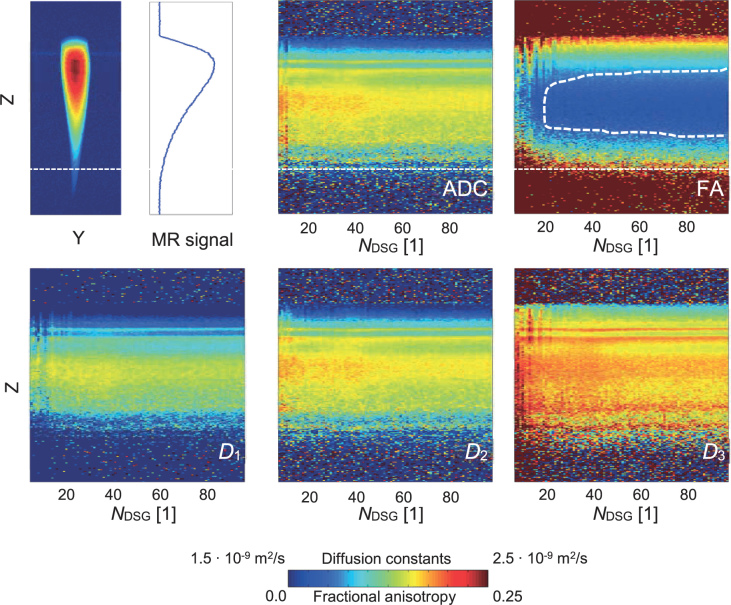
Experimental results of a tap water phantom, examined by 1D DT-MRM are shown in Figure 7 with stack plots of 1D profiles of diffusion tensor quantities (ADC, FA, D1,D2 and D3) as a function of NDSG. The 1D profiles were measured with isotropic DSG configurations (the same configurations as in Figure 6) along the axis of the cone-shaped phantom. As can be seen from the 2D MR image (without slice selection) of the phantom and the corresponding 1D intensity profile along the phantom axis, SNR decreases monotonically towards the tip of the cone-shaped phantom. From the stack plots it can be seen that diffusion tensor quantities are biased in the phantom regions with poor SNR. The results can be improved by increasing NDSG. This can be well seen in the stack plot of FA, where is the lowest in the encircled region (FA < 0.03) corresponding to NDSG ≳ 20 and the central phantom region with high SNR.
Figure 7.
Experimental 1D DT-MRM results of the cone-shaped water phantom: 2D MR image of the phantom with the corresponding signal-to-noise ratio (SNR) 1D profile along the phantom axis (top left) and stack plots of the diffusion tensor quantities (D1, D2, D3, average diffusion coefficient [ADC] and FA) as 1D profiles as a function of NDSG. Isotropic diffusion sensitizing gradients (DSG) configurations were used. The white dotted curve depicts the region with noticeably reduced fractional anisotropy.
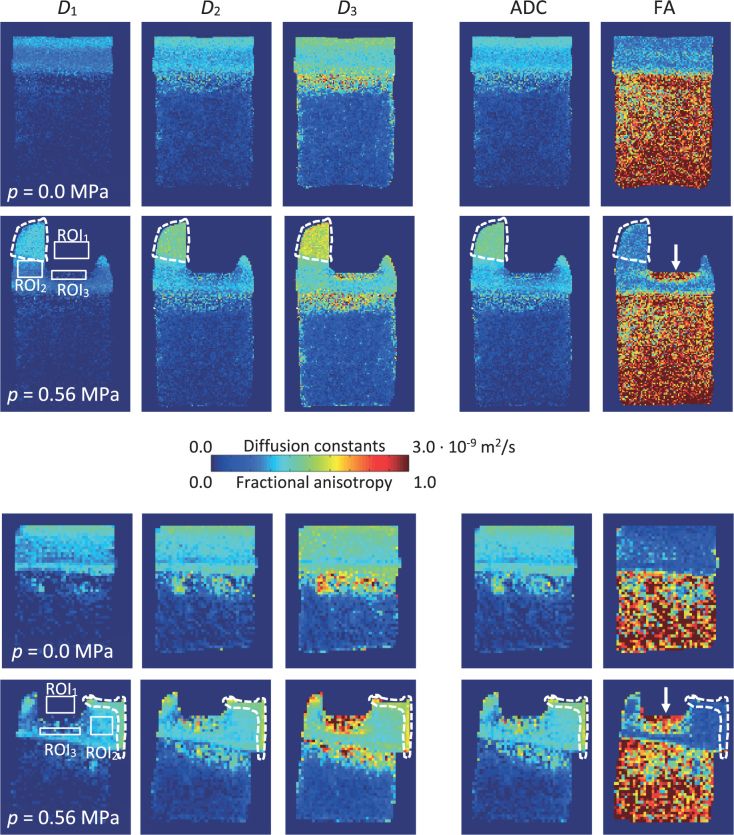
Figure 8 shows the experimental DT-MRM results of two bovine cartilage-on-bone samples, i.e., maps of D1, D2, and D3 as well as the corresponding maps of ADC and FA, obtained before and after its compression with p = 0.56 MPa. The maps were calculated from the corresponding magnitude MR images obtained with an isotropic in-plane resolution of either 78 μm (Figure 8A) or 156 μm (Figure 8B). In Figure 8 with the compressed sample, three various regions of interest (ROI1-ROI3) are delineated, from which SNR was determined. While ROI1 designates the indenter region (providing no MR signal) for background noise determination, ROI2 and ROI3 designate two regions of weakly and fully compressed cartilage, respectively. The corresponding SNR values were in the higher-resolution MR images equal to SNR2 = 29 and SNR3 = 4, while they were equal to SNR2 = 33 and SNR3 = 6 in the lower-resolution MR images. Average values of and in three different regions (uncom-pressed cartilage, compression zone, liquid expelled from the cartilage tissue) of uncompressed and compressed cartilage obtained with two different spatial resolutions are given in Table 2.
Figure 8.
Experimental DT-MRM results of articular cartilage-on-bone samples in a form of 2D maps of D1, D2, D3, average diffusion coefficient (ADC) and fractional anisotropy (FA). The maps were obtained with a spatial resolution of either 78 μm (A) or 156 μm (B). Solid white boxes indicate three different ROI regions for signal-to-noise ratio (SNR) determination, while dashed white lines encircle droplets of liquid expelled from the cartilage tissue. White arrows denote the compression zone.
Table 2.
Average values of average diffusion coefficient (ADC) and fractional anisotropy (FA) in three different regions of an uncompressed and compressed cartilage sample obtained with two different spatial resolutions
| Higher resolution (78 μm) | Lower resolution (156 μm) | |||
|---|---|---|---|---|
| ADC [10−9 m2/s] | FA[1] | ADC [10−9 m2/s] | FA[1] | |
| Uncompressed cartilage | 0.99±0.13 | 0.27±0.13 | 1.12±0.14 | 0.14±0.08 |
| Compression zone | 0.63±0.42 | 0.87±0.27 | 1.01±0.82 | 0.82±0.23 |
| Liquid droplet | 1.35±0.11 | 0.24±0.06 | 1.34±0.19 | 0.11±0.04 |
ADC = average diffusion coefficient; FA = fractional anisotropy
Discussion
The aim of this study is to analyze the effect of the signal-to-noise ratio and DSG configuration on noise propagation in the DT-MRM post-processing analysis for the isotropic (FA = 0) as well as for anisotropic case (FA > 0). The principal findings of the study are: i) noise propagation in the DT-MRM analysis is manifested in an increased deviation of diffusion tensor eigenvalues; ii) deviations of diffusion tensor eigenvalues result to an overestimation of fractional anisotropy, while the average diffusion coefficient remains unchanged; iii) fractional anisotropy bias could be reduced by increasing and by optimizing a DSG configuration to a small condition number at a large number of DSG directions.
The analysis of numerical simulations is based on correlating the diffusion tensor quantities of isotropic medium with the condition number of the transformation matrix and the number of DSG directions. It was evidently shown (Figures 3-5) that the extent of the fractional anisotropy overestimation is dependent of the both parameters. Interestingly, noise propagation with random DSG configurations appears in a form of a symmetric deviation of the largest and the smallest diffusion tensor eigenvalue from the expected value of (Figure 3B), while the second diffusion tensor eigenvalue remains practically unchanged over the entire range of condition numbers. The deviation contributes to an apparent fractional anisotropy considerably, while the deviation is canceled in the calculation of the average diffusion coefficient.
With random DSG configurations, an average fractional anisotropy highly correlates with a condition number, which is consistent with et al.12 The minimal values of were obtained with the smallest values of the condition number (1 < CN < 2 in Figure 3F) corresponding to nearly isotropic DSG configurations, which is in agreement with the results of the study by Batchelor et al.23 This is evident from comparison of minimal FA as a function of NDSG with random DSG configurations (Figure 4A) and of FA as a function of NDSG with isotropic DSG configurations (Figure 5). However, high values of correspond to DSG configurations with one or more preferential directions around which DSG directions are clustered. From the results of simulations, it is also evident that the apparent fractional anisotropy decreases with a large number of DSG directions. Namely, the difference between the maximal and the minimal fractional anisotropy in Figure 4A monotonically decreases with an increasing number of DSG directions. The decrease is also associated with a reduction of the corresponding best fit parameters and the fit quality R2 (Figure 4B).
Fractional anisotropy overestimation in iso-tropic water phantom was studied by DT-MRM only in 1D due to a required large set of isotropic DSG configurations with different. NDSG The experiments were performed in 1D to reduce the total acquisition time and for the phantom cone-shaped water-filled sample was used to obtain continuously decreasing SNR along the phantom axis. In 2D DT-MRM of articular cartilage, SNR was reduced additionally due to a faster transversal relaxation and a reduced voxel size, which resulted into an overestimation of fractional anisotropy. The measured values listed in Table 2 are somewhat larger than those in literature.17 The reported fractional anisotropy values in the uncompressed cartilage are equal to FA ~0.08 in the tangential zone close to the articular surface, FA ~0.05 in the intermediate zone with disordered collagen fibers and FA ~0.14 in the radial zone close to the cartilage-bone interface, while after compression fractional anisotropy in the compression zone increases to FA ~0.14 and remained unaltered in other zones. A discrepancy between the measured and the reported values can be attributed mostly to the unfavorable SNR conditions. SNR was the lowest in the compression zone, on account of water redistribution from the zone to the articular surface.24 However, the measured fractional anisotropy values in the subchondral bone region were close to unity, which is in an agreement with another high-field DT-MRM study of articular cartilage.25
In comparison to conventional MRI, in MRM, noise has additional origins. Firstly, SNR is usually low due to a much smaller voxel size. Secondly, in MRM imaging gradients are due to an increased spatial resolution large, which in turn contribute to their interaction with DSG. Interaction between DSG and possible background gradients is possible as well. If the contributions are neither compensated by flipping the signs of DSG on alternate averages9 nor properly considered in the calculation of transformation matrix elements according to Eq. 4, variations of the diffusion attenuated MR signal within an individual voxel could be misinterpreted as a noise which could lead to an overestimated fractional anisotropy. SNR can be improved by optimizing magnetization recovery during each repetition time. The echo time, however, should be set as a compromise between two competing effects, diffusion weighting that increases with the echo time and transversal relaxation that decreases with it.
A limitation of the study is that the simulations of anisotropic diffusion were performed only with two different SNR values. However, the selected SNRs were taken from DT-MRM experiment on articular cartilage presented in this study. Another limitation of the study is that the experiments on the water phantom were performed only in one dimension to save experimental time and to thus enable testing of more DSG configurations. The one dimensional DT-MRM approach would be difficult to apply with cartilage samples due to the tissue heterogeneity, which was even more pronounced after the cartilage compression.
Conclusions
In this study a possible overestimation of fractional anisotropy in DT-MRM was analyzed. It was shown by means of numerical simulations and DT-MRM experiments on the isotropic water phantom and low-anisotropy bovine cartilage-on-bone samples that noise propagation from raw data to diffusion tensor eigenvalues can be efficiently reduced by applying DSG configurations with small condition numbers and large numbers of DSG directions.
Disclosure: No potential conflicts of interest were disclosed.
References
- 1.Assaf Y, Pasternak O. Diffusion tensor imaging (DTI)-based white matter mapping in brain research: A review. J Mol Neurosci 2008; 34: 51-61. [DOI] [PubMed]; Assaf Y, Pasternak O. Diffusion tensor imaging (DTI)-based white matter mapping in brain research: A review. J Mol Neurosci. 2008;34:51–61. doi: 10.1007/s12031-007-0029-0. [DOI] [PubMed] [Google Scholar]
- 2.Axel L, Wedeen VJ, Ennis DB. Probing dynamic myocardial microstructure with cardiac magnetic resonance diffusion tensor imaging. J Cardiovas Magn Res 2014; 16: 89. [DOI] [PMC free article] [PubMed]; Axel L, Wedeen VJ, Ennis DB. Probing dynamic myocardial microstructure with cardiac magnetic resonance diffusion tensor imaging. J Cardiovas Magn Res. 2014;16:89. doi: 10.1186/s12968-014-0089-6. [DOI] [PMC free article] [PubMed] [Google Scholar]
- 3.Kubicki M, Westin CF, McCarley RW, Shenton ME. The application of DTI to investigate white matter abnormalities in schizophrenia. Ann Ny Acad Sci 2005; 1064: 134-48. [DOI] [PMC free article] [PubMed]; Kubicki M, Westin CF, McCarley RW, Shenton ME. The application of DTI to investigate white matter abnormalities in schizophrenia. Ann Ny Acad Sci. 2005;1064:134–48. doi: 10.1196/annals.1340.024. [DOI] [PMC free article] [PubMed] [Google Scholar]
- 4.Roosendaal SD, Geurts JJ, Vrenken H, Hulst HE, Cover KS, Castelijns JA, et al. Regional DTI differences in multiple sclerosis patients. NeuroImage 2009; 44: 1397-403. [DOI] [PubMed]; Roosendaal SD, Geurts JJ, Vrenken H, Hulst HE, Cover KS, Castelijns JA. et al. Regional DTI differences in multiple sclerosis patients. NeuroImage. 2009;44:1397–403. doi: 10.1016/j.neuroimage.2008.10.026. [DOI] [PubMed] [Google Scholar]
- 5.Wu EX, Wu Y, Nicholls JM, Wang J, Liao S, Zhu S, et al. MR diffusion tensor imaging study of postinfarct myocardium structural remodeling in a porcine model. Magn Reson Med 2007; 58: 687-95. [DOI] [PubMed]; Wu EX, Wu Y, Nicholls JM, Wang J, Liao S, Zhu S. et al. MR diffusion tensor imaging study of postinfarct myocardium structural remodeling in a porcine model. Magn Reson Med. 2007;58:687–95. doi: 10.1002/mrm.21350. [DOI] [PubMed] [Google Scholar]
- 6.Filidoro L, Dietrich O, Weber J, Rauch E, Oerther T, Wick M, et al. High-resolution diffusion tensor imaging of human patellar cartilage: Feasibility and preliminary findings. Magn Reson Med 2005; 53: 993-8. [DOI] [PubMed]; Filidoro L, Dietrich O, Weber J, Rauch E, Oerther T, Wick M. et al. High-resolution diffusion tensor imaging of human patellar cartilage: Feasibility and preliminary findings. Magn Reson Med. 2005;53:993–8. doi: 10.1002/mrm.20469. [DOI] [PubMed] [Google Scholar]
- 7.Pierce DM, Trobin W, Raya JG, Trattnig S, Bischof H, Glaser C, et al. DT-MRI based computation of collagen fiber deformation in human articular cartilage: a feasibility study. Ann Biomedical Eng 2010; 38: 2447-63. [DOI] [PubMed]; Pierce DM, Trobin W, Raya JG, Trattnig S, Bischof H, Glaser C. et al. DT-MRI based computation of collagen fiber deformation in human articular cartilage: a feasibility study. Ann Biomedical Eng. 2010;38:2447–63. doi: 10.1007/s10439-010-9990-9. [DOI] [PubMed] [Google Scholar]
- 8.Basser PJ, Mattiello J, LeBihan D. Estimation of the effective self-diffusion tensor from the NMR spin echo. J Magn Reson Series B 1994; 103: 247-54. [DOI] [PubMed]; Basser PJ, Mattiello J, LeBihan D. Estimation of the effective self-diffusion tensor from the NMR spin echo. J Magn Reson Series B. 1994;103:247–54. doi: 10.1006/jmrb.1994.1037. [DOI] [PubMed] [Google Scholar]
- 9.Basser PJ, Jones DK. Diffusion-tensor MRI: theory, experimental design and data analysis - a technical review. NMR Biomed 2002; 15: 456-67. [DOI] [PubMed]; Basser PJ, Jones DK. Diffusion-tensor MRI: theory, experimental design and data analysis - a technical review. NMR Biomed. 2002;15:456–67. doi: 10.1002/nbm.783. [DOI] [PubMed] [Google Scholar]
- 10.Callaghan PT. Translational dynamics and magnetic resonance. New York: Oxford University Press; 2011.; Callaghan PT. New York: Oxford University Press; 2011. Translational dynamics and magnetic resonance. [Google Scholar]
- 11.Bastin ME, Armitage PA, Marshall I. A theoretical study of the effect of experimental noise on the measurement of anisotropy in diffusion imaging. Magn Reson Imaging 1998; 16: 773-85. [DOI] [PubMed]; Bastin ME, Armitage PA, Marshall I. A theoretical study of the effect of experimental noise on the measurement of anisotropy in diffusion imaging. Magn Reson Imaging. 1998;16:773–85. doi: 10.1016/s0730-725x(98)00098-8. [DOI] [PubMed] [Google Scholar]
- 12.Skare S, Hedehus M, Moseley ME, Li TQ. Condition number as a measure of noise performance of diffusion tensor data acquisition schemes with MRI. J Magn Reson 2000; 147: 340-52. [DOI] [PubMed]; Skare S, Hedehus M, Moseley ME, Li TQ. Condition number as a measure of noise performance of diffusion tensor data acquisition schemes with MRI. J Magn Reson. 2000;147:340–52. doi: 10.1006/jmre.2000.2209. [DOI] [PubMed] [Google Scholar]
- 13.Pierpaoli C, Basser PJ. Toward a quantitative assessment of diffusion anisotropy. Magn Reson Med 1996; 36: 893-906. [DOI] [PubMed]; Pierpaoli C, Basser PJ. Toward a quantitative assessment of diffusion anisotropy. Magn Reson Med. 1996;36:893–906. doi: 10.1002/mrm.1910360612. [DOI] [PubMed] [Google Scholar]
- 14.Jones DK, Knosche TR, Turner R. White matter integrity, fiber count, and other fallacies: the do’s and don’ts of diffusion MRI. NeuroImage 2013; 73: 239-54. [DOI] [PubMed]; Jones DK, Knosche TR, Turner R. White matter integrity, fiber count, and other fallacies: the do’s and don’ts of diffusion MRI. NeuroImage. 2013;73:239–54. doi: 10.1016/j.neuroimage.2012.06.081. [DOI] [PubMed] [Google Scholar]
- 15.Farrher E, Kaffanke J, Celik AA, Stöcker T, Grinberg F, Shah NJ. Novel multisection design of anisotropic diffusion phantoms. Magn Reson Imaging 2012; 30: 518-26. [DOI] [PubMed]; Farrher E, Kaffanke J, Celik AA, Stöcker T, Grinberg F, Shah NJ. Novel multisection design of anisotropic diffusion phantoms. Magn Reson Imaging. 2012;30:518–26. doi: 10.1016/j.mri.2011.12.012. [DOI] [PubMed] [Google Scholar]
- 16.Hellerbach A, Schuster V, Jansen A, Sommer J. MRI phantoms - are there alternatives to agar? PloS one 2013; 8: e70343. [DOI] [PMC free article] [PubMed]; Hellerbach A, Schuster V, Jansen A, Sommer J. MRI phantoms - are there alternatives to agar? PloS one. 2013;8:e70343. doi: 10.1371/journal.pone.0070343. [DOI] [PMC free article] [PubMed] [Google Scholar]
- 17.de Visser SK, Crawford RW, Pope JM. Structural adaptations in compressed articular cartilage measured by diffusion tensor imaging. Osteoarthritis Cartilage 2008; 16: 83-9. [DOI] [PubMed]; de Visser SK, Crawford RW, Pope JM. Structural adaptations in compressed articular cartilage measured by diffusion tensor imaging. Osteoarthritis Cartilage. 2008;16:83–9. doi: 10.1016/j.joca.2007.05.013. [DOI] [PubMed] [Google Scholar]
- 18.Deng X, Farley M, Nieminen MT, Gray M, Burstein D. Diffusion tensor imaging of native and degenerated human articular cartilage. Magn Reson Imaging 2007; 25: 168-71. [DOI] [PubMed]; Deng X, Farley M, Nieminen MT, Gray M, Burstein D. Diffusion tensor imaging of native and degenerated human articular cartilage. Magn Reson Imaging. 2007;25:168–71. doi: 10.1016/j.mri.2006.10.015. [DOI] [PubMed] [Google Scholar]
- 19.Kuchel PW, Pages G, Nagashima K, Velan S, Vijayaragavan V, Nagarajan V, et al. Stejskal-tanner equation derived in full. Concept Magn Reson A 2012; 40A: 205-14.; Kuchel PW, Pages G, Nagashima K, Velan S, Vijayaragavan V, Nagarajan V. et al. Stejskal-tanner equation derived in full. Concept Magn Reson A. 2012;40A:205–14. [Google Scholar]
- 20.Altschuler EL, Williams TJ, Ratner ER, Tipton R, Stong R, Dowla F, et al. Possible global minimum lattice configurations for Thomson’s problem of charges on a sphere. Phys Rev Lett 1997; 78(14): 2681-2685.; Altschuler EL, Williams TJ, Ratner ER, Tipton R, Stong R, Dowla F. et al. Possible global minimum lattice configurations for Thomson’s problem of charges on a sphere. Phys Rev Lett. 1997;78(14):2681–2685. [Google Scholar]
- 21.Press WH. Numerical recipes in C : the art of scientific computing. 2nd ed. Cambridge Cambridgeshire ; New York: Cambridge University Press; 1992.; Press WH. Numerical recipes in C : the art of scientific computing. Cambridge Cambridgeshire New York: Cambridge University Press; 1992. 2nd ed. [Google Scholar]
- 22.Rössler E, Mattea C, Stapf S. NMR dispersion investigations of enzymatically degraded bovine articular cartilage. Magn Reson Med 2015; 73: 2005-14. [DOI] [PubMed]; Rössler E, Mattea C, Stapf S. NMR dispersion investigations of enzymatically degraded bovine articular cartilage. Magn Reson Med. 2015;73:2005–14. doi: 10.1002/mrm.25292. [DOI] [PubMed] [Google Scholar]
- 23.Batchelor PG, Atkinson D, Hill DLG, Calamante F, Connelly A. Anisotropic noise propagation in diffusion tensor MRI sampling schemes. Magn Reson Med 2003; 49: 1143-51. [DOI] [PubMed]; Batchelor PG, Atkinson D, Hill DLG, Calamante F, Connelly A. Anisotropic noise propagation in diffusion tensor MRI sampling schemes. Magn Reson Med. 2003;49:1143–51. doi: 10.1002/mrm.10491. [DOI] [PubMed] [Google Scholar]
- 24.Greene GW, Zappone B, Banquy X, Lee DW, Söderman O, Topgaard D, et al. Hyaluronic acid-collagen network interactions during the dynamic compression and recovery of cartilage. Soft Matter 2012; 8: 9906-14.; Greene GW, Zappone B, Banquy X, Lee DW, Söderman O, Topgaard D. et al. Hyaluronic acid-collagen network interactions during the dynamic compression and recovery of cartilage. Soft Matter. 2012;8:9906–14. [Google Scholar]
- 25.Raya JG, Melkus G, Dietrich O, et al. Multiparametric characterization of healthy and diseased articular cartilage at 17.6T: Early results. Proc Intl Soc Mag Reson Med 2008; 16: 330.; Raya JG, Melkus G, Dietrich O. et al. Multiparametric characterization of healthy and diseased articular cartilage at 17.6T: Early results. Proc Intl Soc Mag Reson Med. 2008;16:330. [Google Scholar]


