

Abstract
We investigated whether graphomotor organization during a digitized Clock Drawing Test (dCDT) would be associated with cognitive and/or brain structural differences detected with a tractography-derived structural connectome of the brain. 72 non-demented/non-depressed adults were categorized based on whether or not they used ‘anchor’ digits (i.e., 12,3,6,9) before any other digits while completing dCDT instructions to “draw the face of a clock with all the numbers and set the hands to 10 after 11”. ‘Anchorers’ were compared to ‘non-anchorers’ across dCDT, additional cognitive measures and connectome-based metrics. In the context of grossly intact clock drawings, anchorers required fewer strokes to complete the dCDT and outperformed non-anchorers on executive functioning and learning/memory/recognition tasks. Anchorers had higher local efficiency for the left medial orbitofrontal and transverse temporal cortices as well as the right rostral anterior cingulate and superior frontal gyrus versus non-anchorers suggesting better regional integration within local networks involving these regions; select aspects of which correlated with cognition. Results also revealed that anchorers’ exhibited a higher degree of modular integration among heteromodal regions of the ventral visual processing stream versus non-anchorers. Thus, an easily observable graphomotor distinction was associated with 1) better performance in specific cognitive domains, 2) higher local efficiency suggesting better regional integration, and 3) more sophisticated modular integration involving the ventral (‘what’) visuospatial processing stream. Taken together, these results enhance our knowledge of the brain-behavior relationships underlying unprompted graphomotor organization during dCDT.
Keywords: executive functioning, aging, human connectome, neural network, clock drawing, digital clock drawing
Graphical Abstract

Older adults who plan out visuospatial performance show a more integrated modular network involving heteromodal regions (in yellow) of the ventral (‘what’) visuospatial processing stream (in red) than older adults who do not plan their performance who incorporate more unimodal regions (in blue).
1.0 Introduction
The clock drawing test, one of the most commonly used tests by neuropsychologists (Rabin, Barr, & Burton, 2005), provides an economical and comprehensive assessment of multiple cognitive domains including, but not limited to, graphomotor/visuoconstructional abilities, executive functioning, and access to semantic knowledge (Cosentino, Jefferson, Chute, Kaplan, & Libon, 2004; Libon, Malamut, Swenson, Sands, & Cloud, 1996; Royall, Cordes, & Polk, 1998). Performance on the clock drawing test has also been shown to indicate the integrity of subcortical structures (Samton, et al., 2005) as well as focal brain dysfunction (Tranel, Rudrauf, Vianna, & Damasio, 2008). Determinations of ‘impaired’ from ‘unimpaired’ performance, particularly during bedside screening when limited time and tools may be available, have traditionally focused on gross or visually observable errors in output by clinical populations, especially individuals with dementias. Less work has been done studying clock drawing test performance-based outcomes reflecting successful performance, i.e., lacking gross or observable errors. It may be that subtle individual differences may signal larger distinctions in cognition and/or brain structure worth considering. Advances in digital technology allow for a closer inspection of successful clock drawing performance including the efficient use of time and graphomotor output to facilitate performance (Davis, et al., 2010; Penney, Davis, et al., 2010). Likewise, advances in brain network analysis or brain connectomics have emerged as an exciting way to examine neural organization (Bullmore & Sporns, 2009; Rubinov & Sporns, 2010). We used a digital CDT (dCDT) to determine what subtleties in successful clock drawing performance revealed about higher-level cognition and underlying brain connectomics.
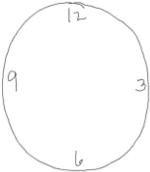
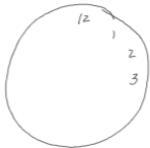
The Clock Drawing Task (CDT) (digital or not), requires participants to “draw the face of a clock with all the numbers and set the hands to 10 after 11”; it has long provided an assessment of multiple cognitive domains (Cosentino, et al., 2004; Libon, et al., 1996; Royall, et al., 1998). For example, evidence suggests the CDT requires executive functioning during the Command condition (Cohen, et al., 2014; Cosentino, et al., 2004) when participants must initiate, unassisted, CDT task demands. Likewise, a larger brain network including prefrontal as well as right parietal and bilateral temporal regions is thought to be involved in Command condition performance compared to Copy and/or ‘pre-drawn’ CDT trials (Matsuoka, et al., 2011). Thus, spontaneous graphomotor organization during the CDT Command condition, e.g., deliberately placing the 12, 6, 3, and/or 9 to ensure adequate spacing of all numbers, may promote executive functioning in the form of greater efficiency during the task. It may also signal better cognitive functions and underlying neural organization more generally when compared to individuals who lack such organization. It follows that such a distinction may differentiate groups of individuals with otherwise grossly intact performance.
Borrowing techniques from graph theory in mathematics, connectomics examines the brain as a ‘graph’ or network, thus allowing us to gain insight into integrative patterns of brain connectivity. Indeed, instead of focusing on few connections linking select regions-of-interest, connectomics allows for a graph-theoretical assessment of system properties in order to quantitatively understand how brain regions or ‘nodes’ communicate and interact. Additionally, advanced graph-theoretical ‘modularity analysis’ investigates how a group of nodes preferentially interact among themselves to form a community or module, which can then be compared between groups of brain networks to assess for ‘modular’ differences (GadElkarim, et al., 2012; Ye, et al., 2015). Understanding not only the cognitive differences associated with graphomotor organization during the CDT but also their connectome neurocircuit underpinnings may enhance our knowledge of the brain-behavior relationships that underlie unprompted (graphomotor) organization during bedside evaluations of overall cognitive performance.
The overarching goal of this study is to determine the cognitive and neural phenotypes of adults who, without prompting, use graphomotor organization during CDT compared to adults who do not use such organization. We hypothesize that individuals who ‘anchor’ digits 12, 6, 3, and/or 9 (i.e., deliberately place these numbers to ensure adequate spacing of all digits) will be more efficient in completing a digitized version of the CDT (Davis, et al., 2010; Penney, Davis, et al., 2010). We will measure efficiency by quantifying total graphomotor output in strokes and time to completion in milliseconds (Cohen, et al., 2014; Penney, Libon, et al., 2010). We further hypothesize that these same individuals will display better executive functioning using independent test measures when compared to ‘non-anchorers’. Given that prefrontal, temporal and parietal regions have been implicated in CDT performance including the organization of spatial information such as the layout of numbers (Ino, Asada, Ito, Kimura, & Fukuyama, 2003; Lee, et al., 2008; Matsuoka, et al., 2011; Parks, et al., 2010; Samton, et al., 2005; Tranel, et al., 2008), we hypothesize that individuals who organize their CDT output (versus those who do not) will also show more efficient neural networks associated with these brain regions.
2.0 Materials and Methods
2.1 Participants
Participants, 55 years or older, were recruited through community outreach (e.g., advertisements, fliers) for a larger program of research at the University of Illinois at Chicago (UIC) Department of Psychiatry that included a study of Type 2 diabetes and depression. Informed consent was obtained according to the Institutional Review Board guidelines at UIC and in accordance with the Declaration of Helsinki.
An initial telephone screen determined study eligibility. At this screen, exclusion criteria for consideration as a healthy control included a diagnosis of any Axis I disorder (including depression), a history of head trauma or loss of consciousness, a history or presence of any neurological disorders (e.g., dementia, stroke, seizure), and/or substance abuse or dependence. A history of stable or remitted medical disorders was not an exclusionary factor.
Following the telephone screen, participants were scheduled for cognitive (e.g., Mini Mental State Examination; MMSE) (Folstein, 1975) and affective (e.g., Structured Clinical Interview for the DSM-IV; SCID) (Spitzer, Williams, Gibbon, & First, 1992) screens, administered by a trained research assistant, for determination of final inclusion or exclusion. Additionally, either a board certified (AK) or board eligible (OA) psychiatrist completed the 17-item Hamilton Rating Scale of Depression (HAM-D) (Hamilton, 1960) for final determination of the absence of depression. Non-depressed adults were defined by a HAM-D≤8 and an absence of depressive symptoms based on the SCID. All raters were blind to telephone screen information.
Of the 90 participants eligible for inclusion based on the above criteria, 13 were excluded for: antidepressant use for nerve pain/insomnia-2; missing behavioral data-4; English as a second language-6; or having a diagnostic history of depression-1. This left 77 eligible participants.
2.2 Neuropsychological Protocol
2.2.1 The Digital Clock Drawing Test (dCDT) (Davis, et al., 2010; Penney, Libon, et al., 2010)
The dCDT was developed by the Lahey Clinic and Massachusetts Institute of Technology in collaboration with the Clock Sketch Consortium and uses digital pen technology developed by Anoto, Inc. The pen works as an ordinary ballpoint pen while capturing pen position 80 times/second ±0.002. Thus, the data reported by the pen is time-stamped; allowing the pen to capture the final product (i.e., the clock drawing) as well as the behavior that produced it for more accurate classifications than would be possible without this technology.
As with the CDT, the dCDT utilizes one trial of two conditions: Command and Copy. In the Command condition, participants are asked to “draw the face of a clock with all of the numbers and set the hands to 10 after 11.” The Copy condition asks participants to copy a model of a clock with the hands set for ‘10 after 11’. The Copy condition is always presented immediately after the Command condition is complete so as not to spoil spontaneous output during the Command condition. Below are the parameters for the current research. It should be noted that the observance of anchoring behavior does not require digital technology although the dCDT software does allow for the confirmation of digit order and the classification of anchoring. We utilized dCDT scoring software to automatically capture other behavior that would be difficult to obtain otherwise including total number of strokes and total time to completion outlined below.
Anchors – Anchors, i.e., digits used to set guidelines for where the remaining digits will be placed on the clock face during the Command condition, served as our measure of prospective planning. Anchor digits (numbers 12, 3, 6 and/or 9; Table 1) had to be drawn before all other digits. Two or four anchors could be used, as these digits set the framework for all other digits within the clock.
Total Number of Strokes – calculated as the total number of distinct graphomotor marks (i.e., strokes) completed with the pen during clock drawing to Command and to Copy.
Total Time to Completion – calculated as the total time taken to complete the dCDT during the Command condition and again during the Copy condition. Time was documented from when the participant starts drawing, i.e., initial ink on the page, to the end of the clock's final element.
Table 1.
Sample Characteristics
|
|
||
|---|---|---|---|
| dCDT & COGNITIVE SAMPLE | Anchorers n=36 | Non-Anchorers n=35 | Statistics |
| Age (years) | 66.75±5.73 | 66.94±7.20 | F(1,69)=0.01, p=.90 |
| Sex (M:F) | 12 : 24 | 18 : 17 | x2=2.38, p=.12 |
| Race (white:nonwhite) | 22 : 14 | 20 : 15 | x2=0.11, p=.73 |
| Handedness (R:L:mixed) | 32 : 4 : 0 | 31 : 2 : 2 | x2=2.66, p=.26 |
| Education (years) | 15.75±2.61 | 14.60±3.09 | F(1,69)=2.87, p=.09 |
| Mini-Mental State Examination | 28.89±1.25 | 28.70±1.43 | F(1,68)=0.38, p=.53 |
| predicted verbal IQ | 108.44±13.08 | 105.74±15.12 | F(1,69)=0.65, p=.42 |
| Hamilton Depression Rating Scale | 1.42±1.66 | 1.80±1.66 | F(1,69)=0.94, p=.33 |
| Center for Epidemiologic Studies of Depression | 5.50±4.76 | 7.31±5.40 | F(1,69)=2.26, p=.13 |
| WMS-III Visual Reproduction Copy | 95.80±5.27 | 93.60±6.26 | F(1,69)=2.58, p=.11 |
| Type 2 Diabetes (healthy:diabetes) | 21:15 | 17:18 | x2=0.68, p=.41 |
| Diabetes Duration (months) | 37.34±67.75 | 59.22±75.57 | F(1,69)=1.62, p=.20 |
| hemoglobin A1c | 6.20±0.80 | 6.51±1.22 | F(1,69)=1.49, p=.22 |
| CONNECTOMICS SAMPLE | Anchorers n=22 | Non-Anchorers n=21 | Statistics |
|---|---|---|---|
| Age (years) | 68.05±5.88 | 65.52±5.06 | F(1,41)=2.26, p=.14 |
| Sex (M:F) | 6 : 16 | 10 : 11 | x2=1.90, p=.16 |
| Race (white:nonwhite) | 12 : 10 | 13 : 8 | x2=0.24, p=.62 |
| Handedness (R:L:mixed) | 20 : 2 : 0 | 18 : 2 : 1 | x2=1.08, p=.58 |
| Education (years) | 15.32±2.78 | 14.52±2.82 | F(1,41)=0.86, p=.35 |
| Mini-Mental State Examination | 28.95±1.21 | 29.05±1.07 | F(1,41)=0.07, p=.79 |
| predicted verbal IQ | 107.18±15.20 | 105.00±15.06 | F(1,41)=0.22, p=.64 |
| Hamilton Depression Rating Scale | 1.27±1.49 | 1.95±1.63 | F(1,41)=2.05, p=.16 |
| Center for Epidemiologic Studies of Depression | 5.00±4.89 | 6.43±5.18 | F(1,41)=0.86, p=.35 |
| Type 2 Diabetes (healthy:diabetes) | 15:7 | 9:12 | x2=2.79, p=.09 |
| hemoglobin A1c | 6.15±0.87 | 6.54±1.24 | F(1,41)=1.31, p=.26 |
| Diabetes Duration (months) | 34.72±68.87 | 63.86±78.40 | F(1,41)=1.68, p=.20 |
Note: There were no between-group differences in demographic variables.
2.2.2 Additional Cognitive Tasks
A larger neuropsychological protocol tested cognitive domains of executive functioning (EF), attention and information processing (AIP), learning/memory/recognition (LMR), and semantic language (SEM). These domains, based on theoretical groupings of similar test variables of interest (VOIs) as published in the literature (Charlton, Lamar, et al., 2014; Cohen, et al., 2014; Lamar, et al., 2015), were as follows: EF – Trail Making Test (TMT) Part B time to completion, Wechsler Adult Intelligence Scale 3rd Edition (WAIS-III) (Wechsler, 1997a) Digit Span-Backward subtest raw score and Matrix Reasoning raw score, and the Self-Ordered Pointing Task total errors (Petrides, Alivisatos, & Frey, 2002); AIP – raw scores from the Stroop Color Naming and Word Reading trials (Golden, 1978), WAIS-III Digit-Symbol Coding (Wechsler, 1997a), and TMT-A time to completion; LMR – the California Verbal Learning Test – 2nd Edition (CVLT) (Delis & Kramer, 2000) Immediate and Long Delay Free Recall totals and Recognition Discriminability Index calculated by [1-(false positive+misses/# possible correct)]*100, Wechsler Memory Scale – 3rd Edition (WMS-III) (Wechsler, 1997b) Logical Memory I, II and Recognition raw scores, as well as Visual Reproduction I, II and Recognition raw scores; and SEM – Animal fluency measures of total correct, percent in cluster, and the Association Index (Carew, Lamar, Cloud, Grossman, & Libon, 1997).
VOI described above were standardized across the entire sample with z-scores reversed where appropriate (e.g., TMT times to completion) so that higher scores always reflected better performance. Composite z-scores were then calculated for EF, AIP, LMR, and SEM. Cronbach's alphas for each cognitive domain evaluated how well the variables measured each latent construct across the entire sample; resulting values suggested that each composite score measured a unidimensional latent construct (EF, α=.72; AIP, α=.85; LMR, α=.88; SEM, α=.74).
Participants also completed the Wechsler Test of Adult Reading (Wechsler, 2001) to obtain a predicted verbal IQ (pVIQ), the Center for Epidemiological Study of Depression scale (CESD) (Radloff, 1977; Radloff & Teri, 1986) to obtain a subjective measure of depressive symptomatology and Visual Reproduction Copy raw score from the WMS-III for an estimate of visuospatial skills.
2.3 Neuroimaging Protocol
2.3.1 Data Acquisition
Brain MRI was acquired on a Philips Achieva 3T scanner (Philips Medical Systems, Best, The Netherlands) using an 8-channel SENSE (Sensitivity Encoding) head coil. Participants were positioned comfortably in the scanner and fitted with earplugs. Foam pads minimized head movement and participants were instructed to remain still throughout the scan. High resolution three-dimensional T1-weighted images were acquired with a MPRAGE sequence (field of view: FOV=240mm; 134 contiguous axial slices; TR/TE=8.4/3.9ms; flip angle=8°; voxel size=1.1×1.1×1.1mm3). DTI images were acquired using single-shot spin-echo EPI sequence (FOV=240mm; voxel size=0.83×0.83×2.2mm3; TR/TE=6,994/71ms; flip angle=90°). Sixty-seven contiguous axial slices aligned to the AC-PC line were collected in 32 gradient directions with b=700s/mm2. Parallel imaging technique was utilized with a factor of 2.5 to reduce scanning time to approximately 4 minutes. The acquisition of these images was part of a larger protocol.
2.3.2 Image Analysis
To generate connectome data and network efficiency information using graph theory analyses, a pipeline was constructed which integrates multiple image analysis techniques. DTI was eddy current corrected using the automatic image registration tool in DTI-Studio (http://www.mristudio.org) by registering all diffusion-weighted images to their corresponding b0 images. An eddy current correction technique using affine transformation was performed (rotation, translation, scaling and shear, 12-parameters). This was followed by the computation of diffusion tensors then deterministic tractography using Fiber Assignment by Continuous Tracking (FACT) algorithm built into the DTI-Studio program. For each subject, tractography was first performed by tracking the whole brain, initiating tracts at each voxel. Fiber tracking was stopped when FA value fell below 0.15 or a turning angle became larger than 60°.
T1-weighted images were used to generate label maps using FreeSurfer (http://surfer.nmr.mgh.harvard.edu/) for volumetric segmentation (Desikan, et al., 2006; Destrieux, Fischl, Dale, & Halgren, 2010; Fischl, et al., 2004). Each label map is composed of 87 different grey matter regions of interest (ROIs), which include cortical and subcortical regions, brainstem and cerebellum.
In brief, we generated brain structural networks by counting the number of reconstructed streamlines resulting from DTI-Studio white matter tractography data described above that connected every pair of grey matter ROIs defined by Freesurfer's parcellation atlas (i.e., the 87 ROIs); this in-house developed pipeline has been previously published and described in more detail in (Ajilore, Lamar, & Kumar, 2014; Charlton, Leow, et al., 2014). The resulting matrices were then analyzed using the Brain Connectivity Toolbox (BCT) (Rubinov & Sporns, 2010). In order to minimize multiple comparisons of graph theory metrics, variables of interest were carefully selected to represent global and local system properties that have been shown to be associated with aging and cognitive function (Ajilore, et al., 2014; Brown, et al., 2011; Geerligs, Renken, Saliasi, Maurits, & Lorist, 2015; Wen, et al., 2011).
In graph theory, a network is a set of ‘nodes’ or brain regions with ‘edges’ or connections between them. Various metrics have been proposed (see Rubinov & Sporns, 2011, Rubinov, 2010 #98 for details) and it has been suggested that an optimized network can be described as exhibiting a balance between global integration (measured using network efficiency or shortest path length) and local segregation (measured using clustering coefficient). Our graph theory metrics of network system properties included measures of 1) normalized clustering coefficient or Gamma which quantifies the strength of interconnection among neighborhood nodes (higher clustering indicates that the immediate neighbors of a node tend to be immediate neighbors among themselves, thus collectively forming a tightly-knit “cluster”); 2) normalized characteristic path length or Lambda which measures the averaged graph distance between nodes, thus indicating the overall efficiency in information transfer (the lower the path length the higher the efficiency). Both 1 and 2 were normalized against 1,000 randomly generated networks with the same number of nodes and edge distribution; and 3) normalized global network efficiency or Eglobal (how efficiently the entire network exchanges information; note this measure is considered closely related to the characteristic path length and mathematically there is an inverse relationship between their values). Last, regional connectivity of a node (Wen, et al., 2011) was measured using the local efficiency, mathematically defined as the Eglobal with respect to the graph formed by the local neighborhood of this node (Rubinov & Sporns, 2010). These metrics were calculated using the Brain Connectivity Toolbox. For detailed description of the equations, please refer to (Rubinov & Sporns, 2010). Connectome data was visualized using BrainNet Viewer (Xia, Wang, & He, 2013).
For connectome hierarchical modularity analysis, i.e., how local nodes or brain regions interact to form communities or modules, we employed the path length associated community estimation (PLACE) technique (Gadelkarim, et al., 2014; GadElkarim, et al., 2012) which was fully developed in-house in order to compare a connectome's hierarchical modularity between groups. Instead of the well-known Q modularity metric that only takes into account the connections or edges at the intra-community level, PLACE extracts communities via optimal edge partition into two categories: connections between versus connections within communities. Previously work has shown this approach to be advantageous when compared to modularity metric “Q” (Gadelkarim, et al., 2014), namely PLACE does not suffer from the same resolution limits as Q. Mathematically, PLACE utilizes a path length based novel metric and exploits powers of 2 to compute regularly hierarchical trees. In order to extract community structures at each tree-level using PLACE, nodes were assigned to one of two communities by maximizing the difference between the mean inter-modular and the mean intra-modular path lengths (Gadelkarim, et al., 2014; GadElkarim, et al., 2012). To quantify modular or community affiliation differences, PLACE, designed for various computational strategies, compared the scaled inclusivity metric V that quantifies affiliation ‘mis-match’ between two modular structures at a specific node or a specific community (V ranges from 0 to 1; 0 indicates no modular pattern is shared at this node while 1 indicates a complete match).
2.4 Statistical analyses
Group differences for demographic variables were tested using IBM SPSS Statistics v20 analysis of variance (ANOVA) for continuous variables and chi-square tests for categorical variables. For dCDT and cognitive variables, one-way ANOVAs were performed controlling for statistically significant demographic variables as appropriate.
Connectome metrics were analyzed using independent t-tests and Q<0.30 for false discovery rate (FDR) bounds; Q is a statistically distinct threshold from p-values (Benjamini & Hochberg, 1995; Bhaumik, et al., 2009) previously employed to successfully control for type I error rate for multiple comparisons (Charlton, Leow, et al., 2014; Kumar, et al., 2015). PLACE analyses (Gadelkarim, et al., 2014; GadElkarim, et al., 2012) used the anchorer subjects as the reference group and tested for group modular differences in V using two-sample Hotelling T-squared test, p≤.05.
We performed post-hoc correlations (with and without adjustments as appropriate) to determine if significant between-group differences resulting from our connectome analyses related to significant between-group differences resulting from our cognitive analyses. To minimize the number of correlations, we restricted our analyses to variables where there were significant group differences regardless of adjustments and that had been previously associated in the connectome literature, e.g., local efficiency and memory and executive functioning (Ajilore, et al., 2014; Brown, et al., 2011; Geerligs, et al., 2015; Wen, et al., 2011).
3.0 Results
3.1 Demographics
Six participants were excluded because they did not meet criteria for either group based on anchoring behavior as described above. This left 71 individuals (41 women) with an average age of 66.85±6.45; 36 anchorers (31 anchored all 4 digits) and 35 non-anchorers (Table 1). All participants were native English speakers (42 Caucasian, 25 African American, 4 Hispanic/Asian/Other) with an average education of 15.18±2.89 and MMSE scores ≥ 25.
Individual ANOVAs did not reveal any significant group differences for age, MMSE, years of education, pVIQ or CESD (p-values≥0.09) and chi-square testing did not reveal any significant differences in sex or race distributions between groups (Table 1). There were no significant group differences on our estimate of visuospatial skills (i.e., the WMS-III Visual Reproduction Copy raw score; p=0.11). Thus, we did not adjust for any demographic variables in our analyses.
Given individuals with Type 2 diabetes were oversampled for the larger program of research, we investigated the number of individuals in our final sample with this vascular risk. Thirty-three individuals had Type 2 diabetes; however, chi-square analyses revealed equal representation across our groups (p=0.41; Table 1). We further compared our groups on diabetes duration (months) and severity (hemoglobin A1c or hA1c, a measure of average plasma glucose concentration over prolonged periods of time). There were no significant between-group differences on these diabetes measures (p≥0.20; Table 1). As the presence of Type 2 diabetes has been associated with cognitive and brain structural alterations in older and younger adults (Bangen, et al., 2015; Weinstein, et al., 2015) we performed all analyses with and without the covariate of hA1c to ensure that diabetes did not affect our reported results.
3.2 dCDT
3.2.1 dCDT Overall Performance
Clock performance was evaluated for gross and observable differences based on a comparison to previously published work in healthy controls and clinically deemed to be within normal limits. Using a published scoring system to quantify the size, shape and position of the clock face, numbers and hands on a 0-10 scale (Libon, et al., 1996; Libon, Swenson, Barnoski, & Sands, 1993), group differences during the Command condition (anchorers=8.61±1.27, non-anchorers=7.97±1.40; p=0.05) did not remain significant once adjusting for hA1c (p=0.11). Non-Anchorers did not perform as well as Anchorers during the Copy condition (anchorers=8.97±0.87, non-anchorers=8.43±1.0 p=0.01) regardless of covariates.
3.2.2 dCDT Efficiency
Groups did not differ in total time to completion for either Command or Copy condition (Table 2). There was a significant difference between groups for total strokes to completion (anchorers used fewer strokes than non-anchorers), but only in the Command condition [F(1, 70)=4.31; p=0.04]. This result did not meet our a priori threshold for significance after adjusting for hA1c (p=0.08).
Table 2.
dCDT Efficiency and Cognitive Domains of Functioning
| Anchorers n=36 | Non-Anchorers n=35 | p-values |
||
|---|---|---|---|---|
| no adjustment for hA1c | with adjustment for hA1c | |||
| DIGITAL CLOCK (dCDT) | ||||
| Drawing Time | ||||
| Command condition | 37.55±12.76 | 42.26±25.13 | 0.321 | 0.327 |
| Copy condition | 32.17±11.53 | 32.88±12.72 | 0.808 | 0.717 |
| Number of Strokes | ||||
| Command condition | 22.94±2.66 | 25.23±6.02 | 0.042 | 0.081 |
| Copy condition | 23.86±2.74 | 24.06±3.45 | 0.792 | 0.506 |
| COGNITIVE DOMAINS | ||||
| Executive Functioning | 0.27±0.55 | −0.20±0.80 | 0.009 | 0.028 |
| Attention/Information Processing | 0.13±0.80 | −0.10±0.84 | 0.245 | 0.298 |
| Learning/Memory/Recognition | 0.26±0.60 | −0.19±0.75 | 0.008 | 0.017 |
| Semantic Language | 0.004±0.82 | −0.004±0.81 | 0.963 | 0.736 |
NOTE: hA1c=hemoglobin A1c
3.3 Cognition
Despite equivalent pVIQ, individual ANOVAs revealed significant differences for EF [F(1, 64)=7.31; p=0.009] and LMR [F(1, 66)=7.45; p=.008], such that anchorers outperformed non-anchorers in both domains (Table 2). Results for AIP and SEM were not significant (Table 2). Results did not change when using hA1c as a covariate or after multiple comparison correction (p≤0.01).
3.4 Neuroimaging
Of the 71 participants included in the behavioral analyses, 29 did not have DTI data for extraction of connectome data secondary to time constraints in the scanner. Characteristics (demographics and dCDT) of this smaller MRI sample (n=43) remained unchanged from those reported for the larger sample and no between group differences were noted in the demographics of this smaller sample of anchorers and non-anchorers (Table 1).
3.4.1 Global and local network metrics
There were no significant differences between groups across global system properties of clustering coefficient, path length or network efficiency (all p-values >0.65; Table 3).
Table 3.
Global System Properties and Local Efficiency Results
| Anchorers n=22 | Non-Anchorers n=21 | Statistics | |
|---|---|---|---|
| GLOBAL NETWORK PROPERTIES | |||
| Clustering Coefficient (Gamma) | 2.38±0.24 | 2.38±0.27 | t(41)=0.02, p=0.98 |
| Path Length (Lambda) | 1.22±0.21 | 1.21±0.07 | t(41)=−0.41, p=0.69 |
| Network efficiency (Eglobal) | 0.95±0.04 | 0.94±0.03 | t(41)=0.96, p=0.34 |
| LOCAL EFFICIENCY | |||
| Left Hemisphere | |||
| Medial Orbitofrontal Cortex | 0.23±0.06 | 0.19±0.04 | t(41)=−2.7, p=0.01 |
| Transverse Temporal Cortex | 0.12±0.09 | 0.05±0.04 | t(41)=−3.2, p=0.003 |
| Right Hemisphere | |||
| Rostral Anterior Cingulate Cortex | 0.19±0.05 | 0.15±0.05 | t(41)=−2.8, p=0.008 |
| Superior Frontal Cortex | 0.23±0.03 | 0.19±0.04 | t(41)=−3.1, p=0.003 |
Note: Reported values for the global network properties Gamma and Lambda were normalized against randomly generated networks with the same number of nodes (brain regions) and edges (connections).
By contrast, local-level analyses revealed significantly higher efficiency for anchorers versus non-anchorers in the left medial orbitofrontal cortex (OFC), t(41)=−2.7, p=0.01, left transverse temporal cortex (Heschl's gyrus), t(41)=−3.2, p=0.003, right rostral anterior cingulate cortex (ACC) , t(41)=−2.8, p=0.008, and right superior frontal gyrus (SFG), t(41)=−3.1, p=0.003 (Table 3) controlling for multiple comparisons.
Post-hoc correlational analyses (2-tailed) between the local efficiency of these four regions and the significantly different cognitive domains revealed associations between the right SFG and EF, r(38)=.47, p=.003, and the right SFG and LMR, r(39)=.45, p=.005, only (Figure 1). There were no other significant correlations between the local efficiency of the four identified regions and the significantly different cognitive domains. Not surprisingly, EF and LMR were significantly correlated with each other, r(38)=.78, p<0.001. None of our post-hoc correlational analyses changed with the addition of hA1c as a covariate.
Figure 1.

Scatterplots with trend lines of 2-tailed correlations between local efficiency metrics within the right superior frontal gyrus (rightSFG) and composite z-scores of executive functioning (EF; r(38)=.47, p=.003) and learning/memory/recognition (LMR; r(39)=.45, p=.005) stratified by group (anchorers labeled ‘+’; non-anchorers labeled ‘o’).
3.4.2 Hierarchical modularity analyses
After correcting for multiple comparisons, results of our investigation of modular organization between-groups (Figure 2) revealed differential patterns of affiliation in the right hemisphere involving the fusiform gyrus, lateral occipital cortex, pericalcarine cortex, and lingual gyrus (p=0.003). In anchorers, these regions together formed one module that also included the right inferior temporal cortex. By contrast, in place of right inferior temporal cortex, non-anchorers’ module incorporated the right cuneus.
Figure 2.

Modular organization differences between-groups with common affiliations within right fusiform and lingual gyri as well as lateral occipital and pericalcarine cortices (in red) with a higher degree of modular integration with heteromodal regions of the ventral visual processing stream in anchorers (right inferior temporal cortex in yellow) compared to the unimodal integration within right cuneus seen in non-anchorers (in blue).
Post-hoc, we explored PLACE-derived V values for each subject in the right inferior temporal cortex and the right cuneus as they related to cognition; correlational analyses (2-tailed) between V values in these distinct regions and EF and LMR were not significant.
4.0 Conclusions
As hypothesized, individual differences in graphomotor organization as defined by anchoring behavior during the dCDT associated with distinct cognitive skills and underlying neural phenotypes. dCDT clock accuracy was better for anchorers and the dCDT metric recording the total number of strokes used during performance was lower for anchorers than non-anchorers; however, these results did not remain significant after adjusting for hA1c. Anchorers also demonstrated superior EF as well as LMR compared to non-anchorers within the context of equivalent pVIQ. Although global network properties of structural connectome did not differ between groups, local network properties did differ. Specifically, local efficiency measured in the left medial OFC and temporal gyrus as well as the right rostral anterior cingulate and SFG was higher in anchorers compared to non-anchorers; furthermore, local efficiency of the right SFG was associated with better cognitive abilities. Modularity analyses found differences between anchorers and non-anchorers in key right hemisphere regions associated with the ventral visual processing stream. Taken together, these results suggest that individual differences in easily observable graphomotor behaviors may reflect subtle differences (and some brain-behavior associates) across other cognitive domains and brain networks.
From the perspective of using the CDT as a bedside screen to determine ‘impaired’ from ‘unimpaired’ performance, had a distinction not been drawn on the basis of using graphomotor organization, individuals in these groups may not have appeared different from each other on the basis of gross CDT output. More specifically, conducting a visual inspection of non-anchorers’ clock drawing did not suggest gross errors in task execution compared to non-anchorers. Furthermore, overall cognitive functioning as measured by the MMSE, another commonly used bedside screener, was also comparable between groups. Despite this, individuals who organized their dCDT output (anchorers) displayed relative strengths in more detailed assessments of dCDT performance, e.g., total strokes used to complete the task, as well as select cognitive, e.g., executive, abilities and network distinctions outlined below.
More specifically, anchorers displayed differences in their connectome signature when compared to non-anchorers. For example, anchorers compared to non-anchorers had higher local efficiency for the left medial OFC, the right rostral ACC and the right SFG as well as the left temporal gyrus that includes Heschl's gyrus. In general terms, several of these regions were hypothesized to be involved in CDT performance and graphomotor organization more specifically based on previous research in normal and pathological aging (Ino, et al., 2003; Lee, et al., 2008; Matsuoka, et al., 2011; Thomann, Toro, Dos Santos, Essig, & Schroder, 2008; Tranel, et al., 2008). We did not, however, find support for parietal involvement in anchoring behavior; this may be due, in part, to the fact that our local efficiency results may represent a relative advantage for anchorers with respect to the connectivity of neurocircuits responsible for the activation, control, and regulation of visually guided motor acts (Izquierdo, Suda, & Murray, 2004; Koechlin, Ody, & Kouneiher, 2003). From a theoretical perspective developed from a review of the CDT brain/behavior literature (Eknoyan, Hurley, & Taber, 2012), fronto-parietal and fronto-striatal circuitry likely play a role in the coordination of the visuospatial understanding of the CDT and the executive functioning required for accurate CDT performance, respectively. It may be that for anchorers in our study, greater local efficiency within frontally mediated cognitive control regions including the rostral ACC and temporal regions thought to provide additional support to visuospatial abilities (Glascher, et al., 2012) including the processing and organization of visual stimuli (Fink, et al., 1997) promoted the evaluation (and execution) of planning and organization during the dCDT. It should be noted that aspects of these behaviors may also be supported by parietal regions (and the larger fronto-parietal and fronto-striatal circuitry for that matter) in both anchorers and non-anchorers, but the additional local efficiency of specific frontal, temporal and ACC regions may be required for the successful execution of anchoring behavior. This conclusion is further supported by the significant correlations between the SFG's local efficiency and EF and LMR measures. Not only is our work consistent with the literature showing higher local efficiency correlating with better cognitive, e.g., executive and visuospatial, functioning (Ajilore, et al., 2014; Brown, et al., 2011; Geerligs, et al., 2015; Wen, et al., 2011), it further signals local efficiency distinctions that may allow for better organization of information and more efficient strategy use during task performance, one example of which includes graphomotor organization, i.e., anchoring behavior, during a CDT.
Also of note, modularity analyses identified differential patterns of affiliation within the right-hemisphere between anchorers and non-anchorers that also supported our hypothesis of connectome differences between these groups. Thus, while connectome properties linking visual processing regions including the fusiform (‘face’ – perhaps even clock face) region, the lingual gyrus, lateral occipital and pericalcarine cortices were common to both groups, there were also key differences. The anchorers’ module also involved the right inferior temporal cortex while, in contrast, the non-anchorers’ module involved the right cuneus. Thus, subtle distinction existed within specific regions of the well-established ventral or ‘what’ visual processing stream (Goodale & Milner, 1992; Mishkin & Ungerleider, 1982). Perhaps differences in regional synergy allowed for better organization of information and more efficient strategy use during cognitive testing (Baria, Baliki, Parrish, & Apkarian, 2011). For example, higher-level heteromodal aspects of the ventral visual processing stream may have facilitated the integration of complex object features for the anchorers while lower-level unimodal regions of this same pathway may have supported more basic processing in non-anchorers. Much like the anchorers’ relative strengths in higher-level cognitive abilities, their unique subnetwork inclusion of heteromodal regions of the ventral visual processing stream occurred within the context of equivalent visuospatial skills to their non-anchoring counterparts.
Our sample consisted of individuals with Type 2 diabetes. Although there was equal representation of affected individuals across our two groups and we statistically controlled for diabetes severity, we cannot rule out the possibility that diabetes may have nonetheless influenced our results. For example, the significant differences between our groups on dCDT variables weakened to non-significant p-values when adjusting for hA1c suggesting a role of diabetes and long term blood glucose control on these findings; however, hA1c did not alter any other results of this study. Additionally, diabetes is often comorbid with other cardiovascular disease (CVD) risk factors; however, post-hoc analysis revealed that CVD risk factors were not different between our groups. Thus, we are fairly certainly that neither diabetes nor other CVD risk factors more generally drove our results. Our measures of visuospatial ability relied on overall performance on the dCDT itself in conjunction with the copy results of simple geometric shapes from the WMS-III Visual Reproduction test; more complex measures of visuospatial abilities would have strengthened this study. It may be argued that education should have been a covariate in our analyses; however, it did not meet a priori p-level thresholding and was highly correlated to other measures of global intelligence and cognitive processing that were not significantly different between groups, e.g., pVIQ.
Despite using sensitive MRI analytic techniques, limitations merit discussion. Our MRI sample was smaller than our cognitive sample which may have reduced our power to detect differences in global network properties. Our small sample size is one of the reasons why we did not discuss the laterality effects of our results; i.e., we did not want to over-interpret a ‘pattern’ that may have merely resulted from the fact that homologous regions with similar between-group differences did not reach our a prior threshold. We would emphasize, however, that a lack of global network property differences is not necessarily surprising in the context of similar non-significant global connectome differences previously reported in the aging literature (Cao, et al., 2014; Stam, 2014). Furthermore, the groups’ distinguishing behavior, anchoring, is a discrete aspect of otherwise errorless performance and therefore one should not be surprised to find – as was the case – local as opposed to large-scale global effects. Methodologically speaking, probabilistic tractography may be more realistic in areas of crossing fibers than the deterministic tractography approach employed in this study; however, probabilistic tractography is not necessarily superior overall (Zhan, et al., 2015).
Given the fact that segmented regions are not uniform, it has been suggested that volume correction should be conducted to guard against the size of the ROI influencing fiber selection procedures. We opted not to adjust for the size of FreeSurfer ROIs given that 1) volume correction has the potential to overcompensate volume-driven effects on the streamline count and varying normalization strategies may result in varying bias on the data (van den Heuvel & Sporns, 2011); and 2) our groups did not differ in volume or thickness in the ROIs identified through local efficiency or PLACE analyses (data not shown). Furthermore, a study on the human connectome (van den Heuvel & Sporns, 2011) investigated different normalization strategies (un-weighted, weighted by streamline count, weighted by streamline count corrected for ROI volume, and weighted by FA values). In their analyses, the authors chose to focus on the un-weighted (i.e., binarized) and weighted by streamline count matrices (the latter approach is what we adopted in this study), as they argued these two strategies may be the most natural formulation in defining connectivity matrices.
In summary, by considering individual differences in graphomotor organization during otherwise visually successful performance on a simple and widely used task, subtleties in dCDT performance, higher-level cognition and underlying neurocircuitry were revealed. Individuals who anchored their dCDT performance showed greater efficiency in their overall dCDT output and had better performance across specific cognitive domains (i.e., EF and LMR). Further, these cognitive domains correlated with local efficiency of SFG, thus pointing to the role of SFG (and its immediate connections) in supporting anchoring behavior, likely through their involvement in cognitive control as well as activation and regulation of visually guided motor acts. Anchorers were also distinguished from non-anchorers in their inclusion of more heteromodal regions of the ventral visual processing stream suggesting better regional integration of areas that receive and process input from multiple sensory and/or multi-modal brain regions. We are not suggesting that anchoring behavior captures or explains network differences in a manner different from that of our measures of EF and LMR. We are suggesting that by observing the presence or absence of such graphomotor organization when limited in time and/or tools, e.g., at the bedside, may serve as a proxy measure of these cognitive domains and network differences. Future work is needed to confirm these associations; however, individuals that rely on the CDT to ‘screen’ participants should be encouraged to consider the subtle behaviors and approaches to task demands that may be taken when faced with a visibly ‘normal’ clock. Such observations may intimate other subtle cognitive and connectivity differences that are involved in these behaviors.
Highlights.
We studied graphomotor organization during grossly normal clock drawing performance
Organized individuals anchored the 12,3,6, and/or 9 during their clock drawing
Anchorers had better executive functioning, learning and memory than non-anchorers
Anchorers had higher efficiency of a local brain network regulating motor acts
Anchorers had more heteromodal integration of the ventral visual processing stream
Acknowledgements
Funding for this study was provided by NIA K01-AG040192 (ML) and by NIMH R01-MH073989 (AK).
Footnotes
Publisher's Disclaimer: This is a PDF file of an unedited manuscript that has been accepted for publication. As a service to our customers we are providing this early version of the manuscript. The manuscript will undergo copyediting, typesetting, and review of the resulting proof before it is published in its final citable form. Please note that during the production process errors may be discovered which could affect the content, and all legal disclaimers that apply to the journal pertain.
The authors have nothing to disclose.
References
- Ajilore O, Lamar M, Kumar A. Association of brain network efficiency with aging, depression, and cognition. American Journal of Geriatric Psychiatry. 2014;22:102–110. doi: 10.1016/j.jagp.2013.10.004. [DOI] [PMC free article] [PubMed] [Google Scholar]
- Bangen KJ, Gu Y, Gross AL, Schneider BC, Skinner JC, Benitez A, Sachs BC, Shih R, Sisco S, Schupf N, Mayeux R, Manly JJ, Luchsinger JA. Relationship Between Type 2 Diabetes Mellitus and Cognitive Change in a Multiethnic Elderly Cohort. J Am Geriatr Soc. 2015;63:1075–1083. doi: 10.1111/jgs.13441. [DOI] [PMC free article] [PubMed] [Google Scholar]
- Baria AT, Baliki MN, Parrish T, Apkarian AV. Anatomical and functional assemblies of brain BOLD oscillations. The Journal of Neuroscience. 2011;31:7910–7919. doi: 10.1523/JNEUROSCI.1296-11.2011. [DOI] [PMC free article] [PubMed] [Google Scholar]
- Benjamini Y, Hochberg Y. Controlling the FDR: a practical and powerful approach to multiple testing. Journal of the Royal Statistical Society: Series B Statistical Methodology. 1995;57:289–300. [Google Scholar]
- Bhaumik DK, Roy A, Lazar NA, Kapur K, Aryal S, Sweeney JA, Patterson D, Gibbons RD. Hypothesis testing, power and sample size determination for between group comparisons in fMRI experiments. Stat Methodol. 2009;6:133–146. doi: 10.1016/j.stamet.2008.05.003. [DOI] [PMC free article] [PubMed] [Google Scholar]
- Brown JA, Terashima KH, Burggren AC, Ercoli LM, Miller KJ, Small GW, Bookheimer SY. Brain network local interconnectivity loss in aging APOE-4 allele carriers. Proc Natl Acad Sci U S A. 2011;108:20760–20765. doi: 10.1073/pnas.1109038108. [DOI] [PMC free article] [PubMed] [Google Scholar]
- Bullmore E, Sporns O. Complex brain networks: graph theoretical analysis of structural and functional systems. Nature Reviews Neuroscience. 2009;10:186–198. doi: 10.1038/nrn2575. [DOI] [PubMed] [Google Scholar]
- Cao M, Wang JH, Dai ZJ, Cao XY, Jiang LL, Fan FM, Song XW, Xia MR, Shu N, Dong Q, Milham MP, Castellanos FX, Zuo XN, He Y. Topological organization of the human brain functional connectome across the lifespan. Dev Cogn Neurosci. 2014;7:76–93. doi: 10.1016/j.dcn.2013.11.004. [DOI] [PMC free article] [PubMed] [Google Scholar]
- Carew TG, Lamar M, Cloud BS, Grossman M, Libon DJ. Impairment in category fluency in ischemic vascular dementia. Neuropsychology. 1997;11:400. doi: 10.1037//0894-4105.11.3.400. [DOI] [PubMed] [Google Scholar]
- Charlton RA, Lamar M, Zhang A, Yang S, Ajilore O, Kumar A. White-matter tract integrity in late-life depression: associations with severity and cognition. Psychol Med. 2014;44:1427–1437. doi: 10.1017/S0033291713001980. [DOI] [PMC free article] [PubMed] [Google Scholar]
- Charlton RA, Leow A, GadElkarim J, Zhang A, Ajilore O, Yang S, Lamar M, Kumar A. Brain Connectivity in Late-Life Depression and Aging Revealed by Network Analysis. Am J Geriatr Psychiatry. 2014 doi: 10.1016/j.jagp.2014.07.008. [DOI] [PMC free article] [PubMed] [Google Scholar]
- Cohen J, Penney DL, Davis R, Libon DJ, Swenson RA, Ajilore O, Kumar A, Lamar M. Digital Clock Drawing: Differentiating “Thinking” versus “Doing” in Younger and Older Adults with Depression. Journal of the International Neuropsychological Society. 2014;20:920–928. doi: 10.1017/S1355617714000757. [DOI] [PMC free article] [PubMed] [Google Scholar]
- Cosentino S, Jefferson A, Chute DL, Kaplan E, Libon DJ. Clock drawing errors in dementia: neuropsychological and neuroanatomical considerations. Cognitive and Behavioral Neurology. 2004;17:74–84. doi: 10.1097/01.wnn.0000119564.08162.46. [DOI] [PubMed] [Google Scholar]
- Davis R, Penney DL, Pittman D, Libon DJ, Swenson R, Kaplan E. The Digital Clock Drawing Test (dCDT) I: Development of a new computerized quantitative system. The International Neuropsychological Society; Montreal, Canada: 2010. [Google Scholar]
- Delis DC, Kramer JH. California Verbal Learning Test: CvLT-II; Adult Version. Psychological Corporation; 2000. [Google Scholar]
- Desikan RS, Segonne F, Fischl B, Quinn BT, Dickerson BC, Blacker D, Buckner RL, Dale AM, Maguire RP, Hyman BT, Albert MS, Killiany RJ. An automated labeling system for subdividing the human cerebral cortex on MRI scans into gyral based regions of interest. Neuroimage. 2006;31:968–980. doi: 10.1016/j.neuroimage.2006.01.021. [DOI] [PubMed] [Google Scholar]
- Destrieux C, Fischl B, Dale A, Halgren E. Automatic parcellation of human cortical gyri and sulci using standard anatomical nomenclature. Neuroimage. 2010;53:1–15. doi: 10.1016/j.neuroimage.2010.06.010. [DOI] [PMC free article] [PubMed] [Google Scholar]
- Eknoyan D, Hurley RA, Taber KH. The clock drawing task: common errors and functional neuroanatomy. J Neuropsychiatry Clin Neurosci. 2012;24:260–265. doi: 10.1176/appi.neuropsych.12070180. [DOI] [PubMed] [Google Scholar]
- Fink GR, Halligan PW, Marshall JC, Frith CD, Frackowiak RS, Dolan RJ. Neural mechanisms involved in the processing of global and local aspects of hierarchically organized visual stimuli. Brain. 1997;120(Pt 10):1779–1791. doi: 10.1093/brain/120.10.1779. [DOI] [PubMed] [Google Scholar]
- Fischl B, van der Kouwe A, Destrieux C, Halgren E, Segonne F, Salat DH, Busa E, Seidman LJ, Goldstein J, Kennedy D, Caviness V, Makris N, Rosen B, Dale AM. Automatically parcellating the human cerebral cortex. Cerebral Cortex. 2004;14:11–22. doi: 10.1093/cercor/bhg087. [DOI] [PubMed] [Google Scholar]
- Folstein MF FS, McHugh PR. “Mini-mental state.” A practical method for grading the cognitive state of patients for the clinician. Journal of Psychiatric Research. 1975;12:189–198. doi: 10.1016/0022-3956(75)90026-6. [DOI] [PubMed] [Google Scholar]
- Gadelkarim JJ, Ajilore O, Schonfeld D, Zhan L, Thompson PM, Feusner JD, Kumar A, Altshuler LL, Leow AD. Investigating brain community structure abnormalities in bipolar disorder using path length associated community estimation. Hum Brain Mapp. 2014;35:2253–2264. doi: 10.1002/hbm.22324. [DOI] [PMC free article] [PubMed] [Google Scholar]
- GadElkarim JJ, Schonfeld D, Ajilore O, Zhan L, Zhang AF, Feusner JD, Thompson PM, Simon TJ, Kumar A, Leow AD. A framework for quantifying node-level community structure group differences in brain connectivity networks. Med Image Comput Comput Assist Interv. 2012;15:196–203. doi: 10.1007/978-3-642-33418-4_25. [DOI] [PMC free article] [PubMed] [Google Scholar]
- Geerligs L, Renken RJ, Saliasi E, Maurits NM, Lorist MM. A Brain-Wide Study of Age-Related Changes in Functional Connectivity. Cerebral Cortex. 2015;25:1987–1999. doi: 10.1093/cercor/bhu012. [DOI] [PubMed] [Google Scholar]
- Glascher J, Adolphs R, Damasio H, Bechara A, Rudrauf D, Calamia M, Paul LK, Tranel D. Lesion mapping of cognitive control and value-based decision making in the prefrontal cortex. Proc Natl Acad Sci U S A. 2012;109:14681–14686. doi: 10.1073/pnas.1206608109. [DOI] [PMC free article] [PubMed] [Google Scholar]
- Golden C. Stroop colour and word test. 1978 [Google Scholar]
- Goodale MA, Milner AD. Separate Visual Pathways for Perception and Action. Trends in Neurosciences. 1992;15:20–25. doi: 10.1016/0166-2236(92)90344-8. [DOI] [PubMed] [Google Scholar]
- Hamilton MA. A rating scale for depression. Journal of Neurology, Neurosurgery, and Psychiatry. 1960;23:56–62. doi: 10.1136/jnnp.23.1.56. [DOI] [PMC free article] [PubMed] [Google Scholar]
- Ino T, Asada T, Ito J, Kimura T, Fukuyama H. Parieto-frontal networks for clock drawing revealed with fMRI. Neurosci Res. 2003;45:71–77. doi: 10.1016/s0168-0102(02)00194-3. [DOI] [PubMed] [Google Scholar]
- Izquierdo A, Suda RK, Murray EA. Bilateral orbital prefrontal cortex lesions in rhesus monkeys disrupt choices guided by both reward value and reward contingency. Journal of Neuroscience. 2004;24:7540–7548. doi: 10.1523/JNEUROSCI.1921-04.2004. [DOI] [PMC free article] [PubMed] [Google Scholar]
- Koechlin E, Ody C, Kouneiher F. The architecture of cognitive control in the human prefrontal cortex. Science. 2003;302:1181–1185. doi: 10.1126/science.1088545. [DOI] [PubMed] [Google Scholar]
- Kumar A, Yang S, Ajilore O, Wu M, Cohen J, Lamar M, Bhaumik D. Biophysical changes in subcortical nuclei: the impact of diabetes and major depression. Mol Psychiatry. 2015 doi: 10.1038/mp.2015.89. [DOI] [PMC free article] [PubMed] [Google Scholar]
- Lamar M, Rubin LH, Ajilore O, Charlton R, Zhang A, Yang S, Cohen J, Kumar A. What Metabolic Syndrome Contributes to Brain Outcomes in African American & Caucasian Cohorts. Curr Alzheimer Res. 2015;12:640–647. doi: 10.2174/1567205012666150701102325. [DOI] [PMC free article] [PubMed] [Google Scholar]
- Lee DY, Seo EH, Choo IH, Kim SG, Lee JS, Lee DS, Jhoo JH, Kim KW, Youn JC, Woo JI. Neural correlates of the Clock Drawing Test performance in Alzheimer's disease: a FDG-PET study. Dement Geriatr Cogn Disord. 2008;26:306–313. doi: 10.1159/000161055. [DOI] [PubMed] [Google Scholar]
- Libon DJ, Malamut BL, Swenson R, Sands LP, Cloud BS. Further analyses of clock drawings among demented and nondemented older subjects. Archives of Clinical Neuropsychology. 1996;11:193–205. [PubMed] [Google Scholar]
- Libon DJ, Swenson RA, Barnoski EJ, Sands LP. Clock drawing as an assessment tool for dementia. Archives of Clinical Neuropsychology. 1993;8:405–4158. [PubMed] [Google Scholar]
- Matsuoka T, Narumoto J, Shibata K, Okamura A, Nakamura K, Nakamae T, Yamada K, Nishimura T, Fukui K. Neural correlates of performance on the different scoring systems of the clock drawing test. Neurosci Lett. 2011;487:421–425. doi: 10.1016/j.neulet.2010.10.069. [DOI] [PubMed] [Google Scholar]
- Mishkin M, Ungerleider LG. Contribution of Striate Inputs to the Visuospatial Functions of Parieto-Preoccipital Cortex in Monkeys. Behavioural Brain Research. 1982;6:57–77. doi: 10.1016/0166-4328(82)90081-x. [DOI] [PubMed] [Google Scholar]
- Parks RW, Thiyagesh SN, Farrow TF, Ingram L, Wilkinson K, Hunter MD, Wilkinson ID, Young C, Woodruff PW. Performance on the clock drawing task correlates with FMRI response to a visuospatial task in Alzheimer's disease. Int J Neurosci. 2010;120:335–343. doi: 10.3109/00207450903320339. [DOI] [PubMed] [Google Scholar]
- Penney DL, Davis R, Libon DJ, Lamar M, Price CC, Swenson R, Garrett KD, Freedland A, Weninger C, Scala S, Giovannetti T, Kaplan E. The Digital Clock Drawing Test (dCDT) - II: A new computerized quantitative system.. The International Neuropsychological Society; Montreal, Canada. 2010. [Google Scholar]
- Penney DL, Libon DJ, Lamar M, Swenson R, Price CC, Weninger C, Freedland A, Garrett KD, Scala S, Davis R. The Digital Clock Drawing Test (dCDT) - III: Clinician reliability for a new quantitative system.. The International Neuropsychological Society; Montreal, Canada. 2010. [Google Scholar]
- Petrides M, Alivisatos B, Frey S. Differential activation of the human orbital, mid ventrolateral, and mid-dorsolateral prefrontal cortex during the processing of visual stimuli. Proceedings of the National Academy of Sciences of the USA. 2002;99:5649–5654. doi: 10.1073/pnas.072092299. [DOI] [PMC free article] [PubMed] [Google Scholar]
- Rabin LA, Barr WB, Burton LA. Assessment practices of clinical neuropsychologists in the United States and Canada: a survey of INS, NAN, and APA Division 40 members. Archives of Clinical Neuropsychology. 2005;20:33–65. doi: 10.1016/j.acn.2004.02.005. [DOI] [PubMed] [Google Scholar]
- Radloff LS. The CES-D Scale: a self-report depression scale for research in the general population. Applied Psychological Measures. 1977;1:385–401. [Google Scholar]
- Radloff LS, Teri L. Use of the Center for Epidemiological Studies Depression Scale with older adults. Clinical Gerontology. 1986;5:119–136. [Google Scholar]
- Royall DR, Cordes JA, Polk M. CLOX: an executive clock drawing task. Journal of Neurology, Neurosurgery, and Psychiatry. 1998;64:588–594. doi: 10.1136/jnnp.64.5.588. [DOI] [PMC free article] [PubMed] [Google Scholar]
- Rubinov M, Sporns O. Complex network measures of brain connectivity: uses and interpretations. Neuroimage. 2010;52:1059–1069. doi: 10.1016/j.neuroimage.2009.10.003. [DOI] [PubMed] [Google Scholar]
- Rubinov M, Sporns O. Weight-conserving characterization of complex functional brain networks. Neuroimage. 2011;56:2068–2079. doi: 10.1016/j.neuroimage.2011.03.069. [DOI] [PubMed] [Google Scholar]
- Samton JB, Ferrando SJ, Sanelli P, Karimi S, Raiteri V, Barnhill JW. The clock drawing test: diagnostic, functional, and neuroimaging correlates in older medically ill adults. J Neuropsychiatry Clin Neurosci. 2005;17:533–540. doi: 10.1176/jnp.17.4.533. [DOI] [PubMed] [Google Scholar]
- Spitzer RL, Williams JBW, Gibbon M, First MB. The Structured Clinical Interview for DSM-III-R (SCID) I: History, Rationale, and Description. Archives of General Psychiatry. 1992;49:624–629. doi: 10.1001/archpsyc.1992.01820080032005. [DOI] [PubMed] [Google Scholar]
- Stam CJ. Modern network science of neurological disorders. Nature reviews. Neuroscience. 2014;15:683–695. doi: 10.1038/nrn3801. [DOI] [PubMed] [Google Scholar]
- Thomann PA, Toro P, Dos Santos V, Essig M, Schroder J. Clock drawing performance and brain morphology in mild cognitive impairment and Alzheimer's disease. Brain Cogn. 2008;67:88–93. doi: 10.1016/j.bandc.2007.11.008. [DOI] [PubMed] [Google Scholar]
- Tranel D, Rudrauf D, Vianna EP, Damasio H. Does the Clock Drawing Test have focal neuroanatomical correlates? Neuropsychology. 2008;22:553–562. doi: 10.1037/0894-4105.22.5.553. [DOI] [PMC free article] [PubMed] [Google Scholar]
- van den Heuvel MP, Sporns O. Rich-club organization of the human connectome. Journal of Neuroscience. 2011;31:15775–15786. doi: 10.1523/JNEUROSCI.3539-11.2011. [DOI] [PMC free article] [PubMed] [Google Scholar]
- Wechsler D. Wechsler Adult Intelligence Scale (WAIS-III) Psychological Corporation; 1997a. [Google Scholar]
- Wechsler D. Wechsler memory scale (WMS-III) Psychological Corporation; 1997b. [Google Scholar]
- Wechsler D. Wechsler Test of Adult Reading: WTAR. Psychological Corporation; 2001. [Google Scholar]
- Weinstein G, Maillard P, Himali JJ, Beiser AS, Au R, Wolf PA, Seshadri S, DeCarli C. Glucose indices are associated with cognitive and structural brain measures in young adults. Neurology. 2015;84:2329–2337. doi: 10.1212/WNL.0000000000001655. [DOI] [PMC free article] [PubMed] [Google Scholar]
- Wen W, Zhu W, He Y, Kochan NA, Reppermund S, Slavin MJ, Brodaty H, Crawford J, Xia A, Sachdev P. Discrete neuroanatomical networks are associated with specific cognitive abilities in old age. Journal of Neuroscience. 2011;31:1204–1212. doi: 10.1523/JNEUROSCI.4085-10.2011. [DOI] [PMC free article] [PubMed] [Google Scholar]
- Xia M, Wang J, He Y. BrainNet Viewer: a network visualization tool for human brain connectomics. PLoS One. 2013;8:e68910. doi: 10.1371/journal.pone.0068910. [DOI] [PMC free article] [PubMed] [Google Scholar]
- Ye AQ, Zhan L, Conrin S, GadElKarim J, Zhang A, Yang S, Feusner JD, Kumar A, Ajilore O, Leow A. Measuring embeddedness: Hierarchical scale-dependent information exchange efficiency of the human brain connectome. Hum Brain Mapp. 2015;36:3653–3665. doi: 10.1002/hbm.22869. [DOI] [PMC free article] [PubMed] [Google Scholar]
- Zhan L, Zhou J, Wang Y, Jin Y, Jahanshad N, Prasad G, Nir TM, Leonardo CD, Ye J, Thompson PM, For The Alzheimer's Disease Neuroimaging, I. Comparison of nine tractography algorithms for detecting abnormal structural brain networks in Alzheimer's disease. Front Aging Neurosci. 2015;7:48. doi: 10.3389/fnagi.2015.00048. [DOI] [PMC free article] [PubMed] [Google Scholar]