

Abstract
Histone acetylation is considered a major epigenetic process that affects brain development and synaptic plasticity, as well as learning and memory. The transcriptional effectors and morphological changes responsible for plasticity as a result of long-term modifications to histone acetylation are not fully understood. To this end, we pharmacologically inhibited histone deacetylation using Trichostatin A in adult (6-month-old) mice and found significant increases in the levels of the acetylated histone marks H3Lys9, H3Lys14 and H4Lys12. High-resolution transcriptome analysis of diverse brain regions uncovered few differences in gene expression between treated and control animals, none of which were plasticity related. Instead, after increased histone acetylation, we detected a large number of novel transcriptionally active regions, which correspond to long non-coding RNAs (lncRNAs). We also surprisingly found no significant changes in dendritic spine plasticity in layers 1 and 2/3 of the visual cortex using long-term in vivo two-photon imaging. Our results indicate that chronic pharmacologically induced histone acetylation can be decoupled from gene expression and instead, may potentially exert a post-transcriptional effect through the differential production of lncRNAs.
Keywords: Histone acetylation, Epigenetics, Synaptic plasticity, RNA-seq
Introduction
The discovery that reversible alterations to DNA and associated proteins are related to the unique patterns of gene expression that define cell populations as well as different functional states of the same cells (Allfrey et al. 1964; Pogo et al. 1966) initiated research on the effects of epigenetic interactions on a variety of cellular processes. Much of this research has suggested that gene expression is plastic in the adult brain and that such changes may be necessary for its function. In particular, epigenetic modification by histone acetylases (HATs) and deacetylases (HDACs) appears to modulate the dynamic gene expression which underlies synaptic plasticity (Stefanko et al. 2009; Kavalali et al. 2011) as well as learning and memory (Haettig et al. 2011). Histone acetylation has also been considered to be critical for brain development; e.g., it has been shown to have large effects on cell proliferation (Umka et al. 2010; Yoo et al. 2011), migration (Nott et al. 2013), and synapse formation/maturation (Akhtar et al. 2009). Indeed, there seems to be few cellular processes which have not been assigned a relation to histone acetylation.
Several pathways were shown to modulate the effects of histone deacetylase inhibitors (HDACis), including the MEK/ERK, calcium-calmodulin, and cAMP signaling pathways (Levenson et al. 2004; Levenson and Sweatt 2006; Stefanko et al. 2009; Haettig et al. 2011; Kavalali et al. 2011; Foti et al. 2013). These signaling pathways are thought to be activated by HDACi-induced changes to gene expression, which thereby increases resilience to insult and enhances processes dependent on plasticity pathways. Furthermore, it has been suggested that HDACs may play a role in the closure of critical developmental periods in various brain regions, potentially through the decoupling of ERK/MAPK signaling from mechanisms of histone acetylation (Sweatt 2009). Indeed, administration of HDACis has been shown to re-open the critical period of ocular dominance plasticity after its normal closure in the visual cortex, which suggests that a reduction in histone acetylation could be at least in part responsible for the switch to a mature cortex (Putignano et al. 2007). However, the patterns of acetylation-related gene expression in individual cell types and brain regions remain unknown.
In light of these findings, we decided to examine whether or not HDACi treatment could re-establish aspects of critical period plasticity. To this end, we correlated changes in gene expression and dendritic spine plasticity in the adult visual cortex that occur during long-term HDACi treatment and compared them to those that occur during the critical period. Additionally, we examined changes in specific histone acetylation residues and also in the expression of individual gene isoforms and non-protein-coding regions of the genome to capture a holistic view of the transcriptional effects of increased histone acetylation.
Methods
Animals
All animals were bred and housed in a Yale animal care facility. Male mice which provided the tissue for the RNA-seq experiments were bred from wild-type C57BL/6 mice and were killed at P26 or P180. Ten mice were killed in total for RNA-Seq analysis: two at P26 and eight at P180. The two P26 animals were untreated and of the P180 mice, four were chronically infused with TSA and four with vehicle. Age-matched biological replicates were from different litters and killed at different times. These mice were killed by cervical dislocation and decapitation and the brain was quickly extracted and flash frozen in OCT gel in a dry ice-isopentane slurry. Once fully frozen, the brain was removed to a −80 °C freezer until dissection. Mice which were used for imaging were Thy1-YFP mice, bred from animals generously donated by Steven Strittmatter. These mice expressed YFP in layer 5 neurons across the cortex. Twelve of these mice were implanted with cortical windows, comprising six vehicle-infused controls and six TSA-infused mice. These mice underwent surgery at 6 months of age and were sacrificed immediately following imaging day 28. All procedures were approved by the Institutional Animal Care and Use Committee of Yale University and conformed to the National Institutes of Health Guide for the Care and Use of Laboratory Animals.
Pump implantation
Mini-osmotic pumps were obtained from Alzet (cat # 2002) which were capable of infusing either TSA or vehicle continuously over the course of 2 weeks without need for replacement. Each pump contained 200 μL of fluid, and the concentration of Trichostatin A (TSA) diluted at a concentration of10 mg TSA/ml of DMSO was adjusted with water so that the total amount of TSA in the pump would release a dose equivalent to 2.5 mg/kg/day at a rate of outflow of 0.5 μL/h. For vehicle controls, an amount of water was added to DMSO to give the same concentration as a TSA-infused mouse of equivalent weight. The surgical procedure consisted of inserting the pump into a small mid-scapular incision that had been hollowed out along the spine with a hemostat. The pump, therefore, rested just under the skin, along the spinal column to prevent the animal from scratching around the pump site. For the window-implanted animals which were required to be infused for a full 28 days (vs 14 days of infusion for all other experiments), the pump was replaced on day 14.
Western blotting
Mice which were either vehicle- or TSA-infused were killed by cervical dislocation and decapitation. The occipital cortex, frontal cortex, hippocampus, and olfactory bulb were rapidly dissected on wet ice, immediately frozen on dry ice and stored at −80 °C until use. Tissue was homogenized by a rotary tissue homogenizer. The homogenized samples were diluted 1:1 with Laemmli buffer and boiled for 5 min. SDS-PAGE was then performed using 4–20 % TGX gels (Bio-Rad, cat # 456-1093) which were then transferred to a polyvinylidene fluoride polymer (PVDF) membrane using a semi-dry transfer box at a constant voltage of 20 V for 50 min.The PVDFmembrane was transferred to Tris-buffered saline (TBS, 0.9 % NaCl, 10 mM Tris–HCl, pH 7.5) containing 0.05 % Tween 20 (TTBS) before being washed for 5 min in TBS and incubated for 1 h at room temperature in TTBS containing 5 % milk. After blocking, the membrane was washed in TTBS for 20 min. For acetylated histones, the membrane was incubated in either a 1:1000 dilution of rabbit anti-AcH3Lys9 antibody (Sigma Aldrich, cat # H9286), a 1:300 dilution of rabbit anti-AcH3Lys14 antibody (Cell Signaling, cat # 4318S), or a 1:500 dilution of rabbit anti-AcH4Lys12 antibody (Cell Signaling, cat # 2591S), in 5 % milk TTBS overnight at 4 °C on a rocker table. The following day, after rinsing with TTBS, the blot was incubated with anti-rabbit horseradish peroxidase-conjugated IgG (Cell Signaling) at 1:8000 concentration in 5 % milk TTBS for 1 h at room temperature. Bands were visualized using enhanced chemiluminescence (Perkin Elmer, cat # NEL104001EA) and then developed. Following imaging, the blot was stripped using 0.2 M NaOH and reprobed with a 1:5000 dilution of rabbit anti-histone H3 antibody (Millipore, cat # 05-928) or a 1:2000 dilution of rabbit anti-histone H4 antibody (Millipore cat # 362180) in 5 % milk TTBS overnight at 4 °C on a rocker table. The following day, the blot was incubated with anti-rabbit-HRP at a 1:8000 dilution and imaged as previously. ImageJ software was used to quantify the density of each band. Data were normalized as a percentage of density relative to density of pan-histone H3 or H4. Effects were normalized and measured within single gels.
Laser microdissection
Whole mouse brains were mounted in a cryostat and equilibrated at −18 °C for 1 h before cutting. Sections were made 20 μm thick and mounted on PEN slides (Leica Microsystems). Sections were dried on the slide for 15 min at room temperature before staining. Slides were then placed for 30 s in 70 % EtOH, 10 s in 0.25 % toluidine blue stain in 70 % EtOH, and then 30 s each in 70–100 % EtOH. Slides were then dried again for 5 min at room temperature before immediate microdissection. Layers were defined based on the morphology and density of cells. Layers 2/3 and 6 are easily seen with toluidine staining as their cells are much denser than neighboring layers. The upper border of layer 2/3 was defined as the edge of the dense band of cells, excluding the acellular layer 1. Layer 6 consisted of only the cellular layer and excluded the white matter and the subventricular zone. Layer 4 has smaller cells than layer 2/3 and is denser than layer 5, making it easily recognizable. As the laser cuts a wide track into the tissue that ablates the cells within it, the laser line was placed on the borders of the above-defined layers and provided a buffer zone of cells that were ablated rather than included in the samples of the layers on either side. In this way, the purity of the samples was ensured so that they were enriched only for cells in the middle of the corresponding layer. Sections from one animal were used for each biological replicate, and the two replicates in each area came from different litters of pups which were killed at different times.
Samples were dissected on a fully motorized LMD6000 microscope (Leica) under a 10× objective (Fig. 1); see Table 1 fordefinitions of sample codes used in figures. Tissue cut by the laser fell into the tops of 650 μL microcentrifuge tubes containing 35 μL of 0.1 % β-Mer-captoethanol in RLT buffer (Qiagen). After dissection, the tubes were briefly centrifuged to bring all the tissue and buffer to the bottom of the tube, the tissue pieces disrupted by vortexing and stored on dry ice temporarily until being placed in a −80 °C freezer until RNA extraction. Extraction was done using an RNeasy Microkit (Qiagen) according to the manufacturer’s instructions provided for laser-microdissected tissue. Several tubes (~4) were combined at this stage to obtain an RNA concentration sufficient for library preparation and sequencing (>20 ng total RNA/sample).
Fig. 1.

Sampled brain regions and laser microdissection technique. a The brain regions sampled with bulk dissections in black and regions that were also microdissected with in blue. b In these areas, layers were isolated by laser microdissection. All sampled tissue was then converted to cDNA and sequenced on an Illumina HiSeq 2000 sequencer. c Expression of canonical layer markers across laser-microdissected cortical layers. Expression level in arbitrary units with upper and lower bounds as highest and lowest RPKM, respectively, for the samples displayed
Table 1.
Definition of sample codes as used in figures
| Sample code | Sample name | LMD or gross dissection |
|---|---|---|
| OT1L2 | P180 TSA occipital cortex layer 2 sample 1 | LMD |
| OT2L2 | P180 TSA occipital cortex layer 2 sample 2 | LMD |
| OC1L2 | P180 Control occipital cortex layer 2 sample 1 | LMD |
| OC2L2 | P180 Control occipital cortex layer 2 sample 2 | LMD |
| FC1L2 | P180 TSA frontal cortex layer 2 sample 1 | LMD |
| FC2L2 | P180 TSA frontal cortex layer 2 sample 2 | LMD |
| FT1L2 | P180 Control frontal cortex layer 2 sample 1 | LMD |
| FT2L2 | P180 Control frontal cortex layer 2 sample 2 | LMD |
| OT1L4 | P180 TSA occipital cortex layer 4 sample 1 | LMD |
| OT2L4 | P180 TSA occipital cortex layer 4 sample 2 | LMD |
| OC1L4 | P180 Control occipital cortex layer 4 sample 1 | LMD |
| OC2L4 | P180 Control occipital cortex layer 4 sample 2 | LMD |
| FT1L4 | P180 TSA frontal cortex layer 4 sample 1 | LMD |
| FT2L4 | P180 TSA frontal cortex layer 4 sample 2 | LMD |
| FC1L4 | P180 Control frontal cortex layer 4 sample 1 | LMD |
| FC2L4 | P180 Control frontal cortex layer 4 sample 2 | LMD |
| OT1L5 | P180 TSA occipital cortex layer 5 sample 1 | LMD |
| OT2L5 | P180 TSA occipital cortex layer 5 sample 2 | LMD |
| OC1L5 | P180 Control occipital cortex layer 5 sample 1 | LMD |
| OC2L5 | P180 Control occipital cortex layer 5 sample 2 | LMD |
| FT1L5 | P180 TSA frontal cortex layer 5 sample 1 | LMD |
| FT2L5 | P180 TSA frontal cortex layer 5 sample 2 | LMD |
| FC1L5 | P180 Control frontal cortex layer 5 sample 1 | LMD |
| FC2L5 | P180 Control frontal cortex layer 5 sample 2 | LMD |
| OT1L6 | P180 TSA occipital cortex layer 6 sample 1 | LMD |
| OT2L6 | P180 TSA occipital cortex layer 6 sample 2 | LMD |
| OC1L6 | P180 Control occipital cortex layer 6 sample 1 | LMD |
| OC2L6 | P180 Control occipital cortex layer 6 sample 2 | LMD |
| FT1L6 | P180 TSA frontal cortex layer 6 sample 1 | LMD |
| FT2L6 | P180 TSA frontal cortex layer 6 sample 2 | LMD |
| FC1L6 | P180 Control frontal cortex layer 6 sample 1 | LMD |
| FC2L6 | P180 Control frontal cortex layer 6 sample 2 | LMD |
| L2P26 | P26 Occipital cortex layer 2 sample 1 | LMD |
| 2L2P26 | P26 Occipital cortex layer 2 sample 2 | LMD |
| L4P26 | P26 Occipital cortex layer 4 sample 1 | LMD |
| 2L4P26 | P26 Occipital cortex layer 4 sample 2 | LMD |
| L5P26 | P26 Occipital cortex layer 5 sample 1 | LMD |
| 2L5P26 | P26 Occipital cortex layer 5 sample 2 | LMD |
| L6P26 | P26 Occipital cortex layer 6 sample 1 | LMD |
| 2L6P26 | P26 Occipital cortex layer 6 sample 2 | LMD |
| C1OB | P180 Control olfactory bulb sample 1 | Gross dissection |
| C2OB | P180 Control olfactory bulb sample 2 | Gross dissection |
| T1OB | P180 TSA olfactory bulb sample 1 | Gross dissection |
| T2OB | P180 TSA olfactory bulb sample 2 | Gross dissection |
| C1FC | P180 Control frontal cortex sample 1 | Gross dissection |
| C2FC | P180 Control frontal cortex sample 2 | Gross dissection |
| T1FC | P180 TSA frontal cortex sample 1 | Gross dissection |
| T2FC | P180 TSA frontal cortex sample 2 | Gross dissection |
| C1OC | P180 Control occipital cortex sample 1 | Gross dissection |
| C2OC | P180 Control occipital cortex sample 2 | Gross dissection |
| T1OC | P180 TSA occipital cortex sample 1 | Gross dissection |
| T2OC | P180 TSA occipital cortex sample 2 | Gross dissection |
| C1HC | P180 Control hippocampus sample 1 | Gross dissection |
| C2HC | P180 Control hippocampus sample 2 | Gross dissection |
| T1HC | P180 TSA hippocampus sample 1 | Gross dissection |
| T2HC | P180 TSA hippocampus sample 2 | Gross dissection |
RNA sequencing
The quality of the RNA samples was checked using a BioAnalyzer (Agilent). Libraries for mRNA-Seq were made using the standard Illumina protocol. Four samples were multiplexed per sequencing lane and then sequenced at 75 bp paired-end read length using an Illumina HiSeq 2000 sequencer at the Yale Center for Genomic Analysis. Sequencing data were further processed on the Yale HPC as previously reported (Ayoub et al. 2011). RNA seq data have been deposited in SRA and can be found via the bioproject profile at (http://www.ncbi.nlm.nih.gov/bioproject/264567).
Cortical window surgery and two-photon imaging
At 6 months of age, mice underwent surgery for implantation of a non-invasive cortical window using a previously established protocol (Drew et al. 2010). Mice were imaged with a Zeiss LSM510 microscope coupled to a Chameleon Ultra II laser (Coherent Inc., Santa Clara, CA) using first a 5× objective to map the surface vasculature which is backlit by the fluorescent dendrites underneath. This surface map was then used to repeatedly find the same imaging sites over multiple imaging sessions. For each animal, nine ROIs were chosen across the occipital cortex where the window was especially clear (Fig. 2). These were imaged every session using a 40× objective at 2× zoom. A 100 μm z-stack was taken at each ROI at 1 μm intervals. Imaging was performed on 0, 4, 8 and 28 days post-surgery.
Fig. 2.

In vivo imaging allows tracking of dendritic spine dynamics over several week period. a Identification of regions of interest (ROIs). Up to nine ROIs were selected per animal in the occipital cortex. A wide-field image was first taken with a ×5 objective and then various ×40 image stacks were taken within this field of view. These ×40 images were mapped onto the ×5 “roadmap” using the surface vasculature as landmarks. These landmarks were then used in subsequent imaging sessions to find and revisit the same ROIs. b–d Examples of dendritic spine stability and instability in layers 1 and 2/3 of the occipital cortex. b Three spines (arrowheads) which were stable over the course of the 28-day imaging period. c A spine that has retracted by day 28 (arrow) among other stable spines (arrowheads). d Displays a de novo spine on day 28 (arrow)
Image processing and spine turnover analysis
After the final day of imaging, the z-stack images were processed using Zen 2009 LE (Zeiss) and dendritic spines were analyzed. Areas of dendrite which possessed clear spines orthogonal to the line of sight of the microscope and with low to no background fluorescence were chosen for counting. Spines were not counted which were elongated in the z-axis as this would indicate that they could be a section of dendrite that was oriented perpendicular to the surface of the cortex. Spines on these defined sections were examined across the time series and their presence or absence was recorded. Three measures were used to characterize the resulting data. Spine density was calculated as the % of spines that were present on a section of dendrite on a given day as a proportion of the number present on imaging day 0. Survival fraction is the fraction of spines recorded as present on day 0 that were still present on a subsequent imaging day. Turnover ratio was calculated according to the following equation:
where gains refer to the number of new spines that appeared from t1 to t2, losses are the number of spines that disappeared from t1 to t2 and number of spines was the total number recorded on those imaging days. This provided an aggregate measure of spine plasticity that was normalized to the number of initial spines.
Statistical methods
Differential gene expression and exploratory analyses were performed following the method by Ayoub et al. (2011) using R. Genes with a bhp-corrected p < 0.05 and fold changes >±2× were considered to be differentially expressed. Within each age, area, and condition, every layer was compared to every other in order to identify layer-specific genes (six comparisons each); in the adult groups, each layer in the occipital cortex was compared to its cognate layer in the frontal cortex and each gross brain region was compared to every other; each layer and brain region in the adult controls was compared to the corresponding layer or region in the adult TSA condition; and each layer the occipital cortex was compared across time points. This yielded 30 DEG lists for the first group of comparisons, 8 for the second, 12 for the third, and 4 for the fourth for a total of 54 comparisons made. Using the conservative bhp value and a fold-cutoff of>2, the number of DEGs was relatively small for most comparisons. RPKMs for differentially expressed gene isoforms (DEIs) were also calculated and conditions were analyzed for differential expression using an LRT test as for DEGs. Novel transcriptionally active regions (nTARs) were identified based on presence in both technical replicates, a minimum 0.5 base-pair coverage and less than 20 base-pair gaps with a minimum 100 base-pair length and no overlap with known genes. nTARs were merged from replicates and compared to each other between layers, regions and treatment condition. Differentially expressed nTARs (dnTARs) were merged across these same conditions and overlap then determined with known promoters, lncRNAs and enhancers using the Galaxy online resource (https://usegalaxy.org/).
Functional analysis
GO annotation terms for DEGs were acquired using the Bingo application within the open source platform Cytoscape (http://www.cytoscape.org/), which is used for visualization and analysis of complex networks. For each comparison of interest, Bingo listed GO terms that were enriched in that gene set, giving the term itself as well as a bhp-corrected p value for each. GO terms with a corrected p value<0.05 were considered to be significantly enriched. In addition, the functional annotation tool of the online resource DAVID (http://david.abcc.ncifcrf.gov/) was used for pathway analysis. For each list of DEGs, significantly differentially expressed pathways were identified and bhp-corrected p values generated based on the KEGG pathway annotation. Pathways with a bhp<0.05 were considered to be differentially expressed between the samples.
Cluster analysis
Heatmaps, unsupervised hierarchical clustering and principal component analyses were generated in R for gene sets. jColorGrid (http://jcolorgrid.sourceforge.net/) was used to create other heatmaps for DEGs of interest.
Results
Systemic TSA affects histone acetylation in the cortex
To confirm that systemic administration of TSA increases histone acetylation in the cortex, we performed Western blots for several acetylated histone marks, including AcH3Lys9 and AcH3Lys14, canonical markers of transcriptionally active genes (Crosio et al. 2003), and AcH4-Lys12, a repressive histone mark that normally marks centromeric heterochromatin (Turner et al. 1992). The results illustrated in Fig. 3, showed a significant increase in acetylated H3Lys9, H3Lys14 and H4Lys12 protein in the TSA condition relative to controls in the occipital cortex, hippocampus and olfactory bulb, with the exception of AcH4Lys12, which was not significantly enriched in the frontal cortex. No significant differences in condition were found for the same samples incubated with a pan-histone H3 or H4 antibody. Apart from this measure of histone acetylation in the cortex, there were no other phenotypes (i.e., systematic weight changes or obvious behavioral differences) which were observed over the course of TSA administration apart from a lack of hair regrowth after surgery. This latter effect was unsurprising given the known anti-proliferative effects of TSA (Table 1).
Fig. 3.

Densitometry of western blotting shows a significant increase in acetylated H3Lys9, H3Lys14 and H4Lys12 protein in the TSA condition relative to controls in the occipital cortex (for AcH3Lys9, t = 2.581, df = 4, p = 0.0306; for AcH3Lys14, t = 10.99, df = 4, p = 0.0002; for AcH4Lys12, t = 4.125, df = 4, p = 0.0072, n = 5), frontal cortex (for AcH3Lys9, t = 2.207, df = 4, p = 0.0459; for AcH3Lys14, t = 3.619, df = 4, p = 0.0112, n = 5), hippocampus (for AcH3Lys9, t = 7.511, df = 4, p = 0.0017; for AcH3Lys14, t = 4.147, df = 4, p = 0.0072; for AcH4Lys12, t = 4.077, df = 4, p = 0.0075, n = 5) and olfactory bulb (for AcH3Lys9, t = 3.169, df = 4, p = 0.0168; for AcH3Lys14, t = 6.337, df = 4, p = 0.0016; for AcH4Lys12, t = 3.184, df = 4, p = 0.0167, n = 5), with the exception of AcH4Lys12, which was not significantly enriched in the frontal cortex (t = 1.504, df = 4, p = 0.1034, n = 5). No significant differences in condition were found for the same samples incubated with a pan-histone H3 or H4 antibody. Density of AcH3 and AcH4 was normalized to total H3 and H4, respectively. Mice were administered TSA systemically at a dose of 2.5 mg/kg/day for 14 days prior to tissue collection. Asterisk indicates significance at p < 0.05 level
High-resolution transcriptome analysis after histone acetylation
In order to determine what genes were differentially expressed as a result of increases in histone acetylation in the adult cortex as well as to compare these results to differential gene expression during development, RNA seq was performed on samples from frontal and occipital cortex in the adult (P180), divided by layer (2/3, 4, 5 and 6), and also occipital cortex from P26 mice, similarly divided by layer. Tissue was collected using laser capture microdissection of six mouse brains (two adult TSA, two adult controls and two P26 controls) (Fig. 1). Analysis of additional regions (hippocampus and olfactory bulb) was done by gross dissection and the results compared with gross dissections of occipital and frontal cortex from the same animals. This required an additional two adult animals per condition. Massive parallel sequencing was performed on each sample and then reads were aligned to the mouse genome (mm9) and their normalized abundance calculated using the RPKM (reads per kilobase of exon model per million mapped reads) measure, from which composite gene models were created to get a total value for each expressed gene. Pairwise comparisons were made between layers, between regions, across time points and across conditions to identify significantly differentially expressed genes (DEGs). A likelihood ratio test was used to calculate p values for genes between samples, using a conservative Benjamini-Hochberg-corrected p value (bhp) of 10−5 as the cutoff. Both biological replicates were pooled for each pairwise analysis. Genes with a bhp<0.05 and fold changes >±2× were considered to be differentially expressed. Within each age, area, and condition, every layer was compared to every other in order to identify layer-specific genes (six comparisons each); in the adult groups, each layer in the occipital cortex was compared to its cognate layer in the frontal cortex and each brain region was compared to every other; each layer and brain region in the adult controls was compared to the corresponding layer or region in the adult TSA condition; and each layer in the occipital cortex was compared across time points. This yielded 30 DEG lists for the first group of comparisons, 8 for the second, 12 for the third, and 4 for the fourth for a total of 54 comparisons made. Using the same bhp value and a fold-cutoff of >2×, the number of DEGs was relatively small for most comparisons (Table 2). Some comparisons yielded as few as 12 DEGs (frontal vs occipital whole cortex) and others as many as 1042 (control olfactory bulb vs control frontal cortex). Most comparisons between layers of the same age and region yielded approximately 150 DEGs (range 16–397), most comparisons between regions of the same age approximately 300 DEGs (range 12–1042) and most comparisons across ages approximately 30 DEGs (range 23–47). Comparisons between TSA-treated and control animals, however, had a surprisingly low number of DEGs (range 5–19). As one of our hypotheses was that TSA would induce a critical period-like pattern of gene expression in the adult cortex, the number of genes differentially regulated between P26 occipital cortex and adult controls, between P26 and adult TSA-treated mice, and between adult control and TSA-treated groups was also compared (Fig. 4a). Although there was some overlap between TSA-regulated genes and developmentally regulated genes (P26 vs adult controls), this was a small fraction (9/46) of the total number of developmentally regulated genes. In addition, there were many genes that were differentially expressed between P26 controls and TSA-treated adults, indicating the dissimilarity between these groups. It is, therefore, evident that TSA treatment does not elicit a critical period-like pattern of gene expression. As so many comparisons were made between replicates, we created clusters of DEGs depending on whether they were differentially expressed across layers, regions, condition or some combination of the three. Figure 4b shows the number and overlap of genes differentially regulated by region, layer and TSA treatment. While 1716 genes were differentially regulated by region and 441 by layer, only 19 genes were differentially regulated by TSA, and all but two overlap with layer- and/or region-specific DEGs. Given the lack of significant TSA-DEGs in the dataset, we then examined whether or not there was perhaps a small but global increase in the expression of all neuronal genes that would fall below significance for individual genes but would be evident in a measure of the overall level of expression. Figure 4c displays the density of genes across levels of expression (here, log10 RPKMs). The green curves represent control samples and the red, TSA-treated samples. The two sets of curves overlap to a high degree, indicating that there are no global differences in gene expression between the two conditions.
Table 2.
List of number of differentially expressed genes by comparison
| Comparison | # DEGs | Comparison | # DEGs | Comparison | # DEGs | Comparison | # DEGs | Comparison | # DEGs | Comparison | # DEGs |
|---|---|---|---|---|---|---|---|---|---|---|---|
| OC vs OT L2 | 19 | OC L2 vs L4 | 87 | FC L2 vs L4 | 114 | P26 L2 vs L4 | 96 | CFC vs OC | 12 | TFC vs HC | 168 |
| OC vs OT L4 | 12 | OC L2 vs L5 | 155 | FC L2 vs L5 | 206 | P26 L2 vs L5 | 190 | COB vs HC | 995 | TOC vs HC | 96 |
| OC vs OT L5 | 9 | OC L2 vs L6 | 246 | FC L2 vs L6 | 185 | P26 L2 vs L6 | 397 | CFC vs HC | 248 | ||
| OC vs OT L6 | 8 | OC L4 vs L5 | 19 | FC L4 vs L5 | 57 | P26 L4 vs L5 | 50 | OB C vs T | 6 | ||
| FC vs FT L2 | 8 | OC L4 vs L6 | 200 | FC L4 vs L6 | 141 | P26 L4 vs L6 | 330 | FC C vs T | 10 | ||
| FC vs FT L4 | 16 | OC L5 vs L6 | 49 | FC L5 vs L6 | 30 | P26 L5 vs L6 | 90 | OC C vs T | 5 | ||
| FC vs FT L5 | 7 | OT L2 vs L4 | 87 | FT L2 vs L4 | 158 | L2 P26 vs OC | 21 | HC C vs T | 6 | ||
| FC vs FT L6 | 3 | OT L2 vs L5 | 183 | FT L2 vs L5 | 265 | L4 P26 vs OC | 15 | COC vs HC | 295 | ||
| L2 P26 vs OT | 47 | OT L2 vs L6 | 294 | FT L2 vs L6 | 195 | L5 P26 vs OC | 14 | TOB vs FC | 975 | ||
| L4 P26 vs OT | 36 | OT L4 vs L5 | 22 | FT L4 vs L5 | 16 | L6 P26 vs OC | 36 | TOB vs OC | 761 | ||
| L5 P26 vs OT | 23 | OT L4 vs L6 | 182 | FT L4 vs L6 | 83 | COB vs FC | 1042 | TOB vs HC | 831 | ||
| L6 P26 vs OT | 47 | OC L5 vs L6 | 47 | FT L5 vs L6 | 31 | COB vs OC | 1030 | TFC vs OC | 12 |
Fig. 4.

Proportional venn diagrams and density plots of differentially expressed genes. a Comparison of developmentally regulated genes in the occipital cortex between P26 and P180 for both controls and TSA-treated adults. P26 vs adult TSA has more DEGs than any other group, indicating that TSA treatment induces a pattern of gene expression that is highly dissimilar to that seen during later development. b Comparison between all genes differentially regulated by region, layer, TSA or any combination thereof. TSA induces the differential expression of only two unique genes. The remaining 17 genes are jointly differentially regulated with either layer or region or the combination of the two. This shows the lack of unique effect of TSA on the adult brain. c Density plot of all genes across conditions. Control sample densities are represented in green and TSA-treated sample densities are in red. Both sets of density curves overlap to a large extent, indicating that RPKM densities are highly similar between the two conditions
The 2-D correlation plot, principal component analysis plot, and unsupervised hierarchical clustering heatmap reveal that biological replicates are well correlated with each other (Figs. 5, 6, 7, 8). They also indicate both the quality of the data and the robustness of the negative result for differential gene expression between TSA and control. The expression of canonical layer markers was also analyzed (Fig. 1c) and confirmed that the microdissection process was accurate in isolating the proper layer consistently across sessions/samples as such markers were reliably expressed according to their established patterns. In addition, all of these analyses clearly show the additional clustering of TSA-treated with control samples. In the correlation plot, this can be seen as a high correlation between TSA and control samples; in the PCA plot by the proximity of these two sample types to one another; and in the clustering heatmap, by the two groups being on the same close branch of the dendrogram. The covariance principal component analysis also revealed components that corresponded well with the variables that differed between biological replicates. In the 2-dimensional plot of all the samples (Fig. 5a), component one clearly separates out the grossly dissected samples from the laser-microdissected samples and component two separates the brain regions. Figure 5b shows a three-dimensional plot of the same data, revealing that component three accurately distinguishes between layers. This analysis was run once more on the microdissected samples alone (Fig. 5c). In this plot, component 1 clearly corresponds to layer, component 2 to occipital vs frontal cortex and component 3 to age of the animal (P26 or P180).
Fig. 5.

Samples segregate by region, age and cortical layer, but not experimental condition. a Two-dimensional plot of the two principal components of all samples, separating regions as well as layer- from region-dissected samples. b Three-dimensional PCA plot showing division of cortical lamina in addition to gross brain regions as in a. c Three-dimensional PCA plot of only layer-dissected samples indicating that the third component of this analysis is also able to identify P26 from adult samples. Within each adult layer, it can be seen that the first component uncouples frontal from occipital layers, with occipital samples being closer to the origin of the X-axis than the frontal samples for each layer. It should be noted that although regions, layers and age can be distinguished in these components, there is no obvious division between TSA and control samples, indicating their similarity
Fig. 6.

2-D correlation plot between all sampled layers and regions. Correlation key indicates level of correlation between Pearson R values of 0.85 and 1
Fig. 7.
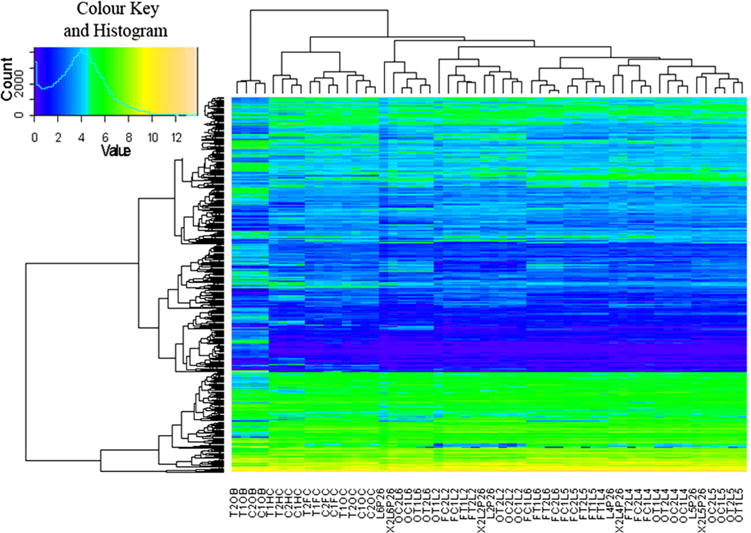
Unsupervised hierarchical clustering heatmap of all differentially expressed genes. Clustering of individual genes is shown on the left of the heatmap and clustering of samples above. Note close clustering of layers and regions and similarity between TSA-treated and control-treated groups
Fig. 8.

Heatmap of all genes differentially expressed between TSA-administered and control conditions between any pair of technical replicates
Functional effects of histone acetylation
In order to examine the TSA-induced DEGs by function and expression level, we performed Gene Ontology (GO) term and Kyoto Encyclopedia of Genes and Genomes (KEGG) pathway analyses to characterize the nature of TSA-upregulated and -downregulated genes. Figure 8 displays the expression levels of all genes that were differentially regulated by TSA in at least one pairwise comparison. We also performed a GO annotation analysis for the set of TSA-upregulated and -downregulated genes. Only the term chemotaxis (p = 0.028) reached significance for upregulated genes and for downregulated genes, hemopoiesis (p = 0.044) and oxygen transport (p = 0.028) were significant. This reveals that many of the TSA-regulated genes were non-neuronal in origin and likely a result of effects on non-native cells such as erythrocytes. A KEGG pathway analysis performed using the Database for Annotation, Visualization and Integrated Discovery (DAVID) online tool (http://david.abcc.ncifcrf.gov/) on this same gene list revealed no significant differentially regulated pathways, likely because of the paucity of genes in the list.
Isoforms
For most regions and layers there was little differential isoform expression with TSA: generally on the order of 15–30 DEIs per and comparable with the number of DEGs between control and TSA-treated groups. However, in some cortical layers, notably layer 4, there were a larger number of DEIs, some of which were enriched for neuronal genes, in opposition to the DEG data. A GO analysis of these isoforms revealed that although many of these differentially spliced genes were erythrocytic or myocytic in origin and likely a result of the effects of TSA on blood and smooth muscle cells in the vasculature of the microdissected tissue, some were plasticity related, although the number was small (see Table 3). However, given the paucity of plasticity-related genes that had differential splicing events as a result of TSA administration and also the limited areas where such events occurred, we concluded that this was likely not the primary explanatory factor behind the previously published effects of HDAC inhibition.
Table 3.
List of GO terms for TSA-induced DEIs
| GO-Id | Description | bhp value | Genes |
|---|---|---|---|
| 50775 | Positive regulation of dendrite morphogenesis | 1.89E–03 | ACTR3|SGK1|ILK |
| 48534 | Hemopoietic or lymphoid organ development | 3.46E–03 | HBA-A1|HBA-A2|PICALM|MAL|HBBB1|TCEA1|LRRC17|ADD2|CTNNB1 |
| 51147 | Regulation of muscle cell differentiation | 3.47E–03 | MORF4L2|ILK|EIF5A|RCAN1 |
| 42552 | Myelination | 4.25E–03 | PLP1|ILK|MAL|MBP |
| 43408 | Regulation of MAPKKK cascade | 5.50E–03 | PSAP|ILK|MAPK8IP3|MAPK9|MAL|CTNNB1 |
| 16458 | Gene silencing | 8.17E–03 | RBM3|SIRT2|SIRT3|ADAR |
| 48268 | Clathrin coat assembly | 1.12E–02 | AP2B1|PICALM |
| 6376 | mRNA splice site selection | 1.39E–02 | CELF4|MBNL1 |
| 6412 | Translation | 1.96E–02 | RPL19|RBM3|EIF4A2|RPL26|EIF5A|LARS2|MRPL48 |
| 48662 | Negative regulation of smooth muscle cell proliferation | 2.77E–02 | ILK|COMT |
| 2762 | Negative regulation of myeloid leukocyte differentiation | 3.33E–02 | LRRC17|CTNNB1 |
| 34101 | Erythrocyte homeostasis | 3.84E–02 | HBA-A1|HBA-A2|TCEA1 |
| 14910 | Regulation of smooth muscle cell migration | 4.24E–02 | ILK|RAPGEF4 |
| 21846 | Cell proliferation in forebrain | 4.29E–02 | FABP7|TACC2 |
| 6342 | Chromatin silencing | 4.56E–02 | SIRT2|SIRT3 |
Histone acetylation affects novel transcriptionally active regions
We examined novel transcriptionally active regions (nTARs) in an attempt to classify the effects of induced histone acetylation on areas of the genome outside of protein-coding regions in the adult brain. As such areas could potentially contain enhancers, promoters and long noncoding and micro-RNAs, differential transcription of these regions could have a variety of effects on the cell. Comparisons were made across layers, regions, and experimental condition and the resulting differentially expressed nTARs (dnTARs) were merged across these same groupings to reveal a total of 2301 dnTARs. There were 483 region-specific dnTARs, 806 layer-specific dnTARs, and 1389 dnTARs across treatment condition. There were 31 region-specific dnTARs that overlapped with known enhancers (with no enhancer overlap for the other two groups) and 65 region-specific, 47 layer-specific and 89 TSA-dnTAR regions which overlapped with known promoters. The number of dnTARs was clearly much higher for the TSA group, indicating that TSA may potentially have had an effect on the production of nTARs outside the protein-coding region of the genome. We then examined the number of such transcripts that overlapped with known long noncoding RNAs (lncRNAs), as found in the NONCODE (noncode.org) database. 343/483 (71 %) of region-specific dnTARs, 448/806 (55.6 %) of layer-specific dnTARs, and 466/1389 (33.5 %) of TSA-regulated dnTARs were comprised of lncRNA (Fig. 9). For TSA dnTARs specifically, 143/649 (22 %) of TSA-upregulated nTARs and 323/629 TSA-downregulated nTARs (51.4 %) overlapped with lncRNA regions. This indicates that a relative downregulation of lncRNAs took place with TSA administration that may have had downstream effects on transcription and translation.
Fig. 9.

TSA induces differential expression from non-coding sequences. TSA induces much more differential transcription of nTARs and comparable numbers of differentially transcribed lncRNA to region- and layer-regulated sequences, despite a lack of difference in expression of protein-coding genes
Correlation of mRNA levels with ChIP-seq for acetylated histone H3
In order to confirm that the increases in histone acetylation seen in the Western blot experiments are indeed uncorrelated with any of the small gene expression changes that were observed between conditions, we used a dataset by Lopez-Atalaya et al. (2013) of AcH3K9 and K14 acetylation peaks that were found in the hippocampus of mice of identical strain, which received an identical TSA dosage to those in our study. The enrichment levels of these peaks in the TSA group were then correlated with the expression levels of the nearest protein-coding genes in our hippocampal data. We found no significant correlation between these two measures (R = −0.02456, p = 0.6992) and as can be seen from the graph (Fig. 10), although AcH3 enrichment for these peaks was approximately 2.5-fold on average, mRNA expression was not significantly different from the average RPKM for this dataset.
Fig. 10.

Acetylated H3 residues in hippocampus are uncorrelated with mRNA expression. Using a dataset by Lopez-Atalaya et al. (2013), we correlated their ChIP-seq enrichment peaks for AcH3K9,14 with the expression of the nearest protein-coding genes in our hippocampal data. We found no significant correlation between these two measures (R = −0.02456, p = 0.6992) and as can be seen from the graph, although AcH3 enrichment was approximately 2.5-fold, mRNA expression was not significantly different from the average FPKM for this dataset
Spine turnover after chronic histone acetylation
In addition to the gene expression analysis, we attempted to characterize the effects of TSA on downstream plasticity, as it has been theorized that TSA can selectively modulate the expression of plasticity-related genes (Alarcon et al. 2004; Levenson et al. 2004; Guan et al. 2009; Stefanko et al. 2009; Barrett et al. 2011; Kavalali et al. 2011; Fass et al. 2013). We chose to perform an in vivo imaging experiment as it is a biologically relevant and non-invasive method that can accurately clarify the effects of various manipulations on plasticity in superficial cortical layers. Thy-1 EYFP transgenic mice underwent cortical thinning surgery at 6 months of age and were imaged over the course of 28 days to observe rates of dendritic spine turnover in layers 1 and 2/3 of layer 5 pyramidal neurons in the visual cortex. High-quality volume stacks of images were obtained for all time points (0, 4, 8, and 28 days post-surgery) in 12 mice, with six in each condition (control vs TSA). It was found that TSA had no effect on spine density, spine survival or spine turnover at the p = 0.05 level (Fig. 11), indicating a lack of change in spine plasticity in these dendrites with TSA treatment.
Fig. 11.

a, b TSA had no effect on spine density or survival fraction over the 28-day experimental period. c TSA has no effect on spine turnover as measured by turnover ratio
Discussion
The last decade has witnessed an ever-growing interest in epigenetics and the potential role of histone acetylation and histone deacetylases (HDACs) in regulating synaptic plasticity by differential gene expression. Significant effort has been invested into the potential use of HDAC inhibitors to ameliorate neuronal dysfunction but the underlying genetic mechanism and repercussions on specific neuronal populations in vivo remain unclear. In the present study, the use of a high-resolution mRNA-sequencing approach (Ayoub et al. 2011) revealed changes in nTARs and modest changes in isoform expression in layer 4 of the cortex but to our surprise, negligible effects on gene expression, with generally less than a dozen significantly differentially expressed genes per pairwise control-Trichostatin A (TSA) comparison, despite increased acetylation at several histone sites. Furthermore, the paucity of plasticity-related genes correlates with the significant stability of dendritic spines under the same conditions. We draw from this the conclusion that under certain circumstances there can be large and significant increases in histone acetylation in the brain with no concomitant changes in gene expression or specific types of downstream plasticity.
The only large difference between TSA and control groups in the gene expression data was in novel transcriptionally active regions (nTARs). nTARs can be associated with known genes, but have an organization and expression that is independent. nTARs are playing as yet ill-defined, but clearly important roles in the cell and we, therefore, examined their expression across treatment conditions to determine whether TSA was affecting the cell through expression outside of protein-coding regions. There were many more nTARs differentially expressed between control and TSA conditions than there were between layers or regions, which was surprising given the opposite results for protein-coding genes. Few of these nTARs overlapped with known promoters and none with known enhancer regions, but more than a third overlapped with long noncoding RNAs [lncRNAs (Fig. 9)], which are known to have various effects on transcription (Feng et al. 2006; Goodrich and Kugel 2006; Nagano and Fraser 2009), splicing (Beltran et al. 2008; Brown et al. 2008) and translation (Centonze et al. 2007; Carrieri et al. 2012). Indeed, our data indicate that while the expression of protein-coding genes with TSA is relatively stable, increases in histone acetylation may modulate transcription of lncRNAs which then may have downstream effects on the neuron in vivo.
In previous work, notable changes in gene expression were found in cells treated with an HDAC inhibitor both in cultured cell lines (Glaser et al. 2003; Daly and Shirazi-Beechey 2006), and in the tissue of TSA-treated animals (Fukuchi et al. 2009; Lopez-Atalaya et al. 2013). Until now, however, no one to our knowledge has examined HDACi-induced differential gene expression using next generation sequencing. Unlike previous studies, we used a conservative p value cut-off and more replicates, which decrease the number of false positive genes. Another element which perhaps may have caused these differences between this study and the two others that examined TSA-induced gene expression in the brain is that we used chronic exposure rather than acute dosages, which could have different effects on both the number and pattern of DEGs. However, our chronic administration led to comparable differences in histone acetylation to those in previous acute administration experiments (Fig. 3), indicating the lack of a causative relation between pharmacologically induced histone acetylation events and protein-coding gene expression under these conditions.
The question remains of why a systemic increase in histone acetylation does not translate into significant differences in gene transcription in neuronal tissues. In a series of ChIP seq experiments with various histone acetylation and methylation marks, Lopez-Atalaya et al. (2013) found that while such marks were highly correlated with gene expression in control tissue, the de novo histone acetylation at promoters that resulted from TSA administration was only modestly positively correlated with expression of their genes. Most of their DEGs were already highly expressed and with constitutively active promoters and intragenic regions that were already highly acetylated, indicating that these genes were being actively transcribed before administration of TSA. Indeed, we correlated the same AcH3K9/14 ChIP-seq peaks found by Lopez-Atalaya et al. (2013) with the expression of the nearest protein-coding genes in our study, and found that there was no concomitant increase of mRNA from these nearby genes (Fig. 10), further indicating the disconnection between pharmacologically induced histone acetylation and gene expression. Our results support their conclusion that AcH3K9/14 and H3K4Me3 were chromatin marks that were “anchorages” for TSA-induced increases in transcription and that such marks are permissive rather than causative of expression. Indeed, this agrees with other work that found a lack of effect for various histone and chromatin mutant variants that were missing or unable to modify certain histone residues and yet had very little impairment or obvious phenotype (Dai et al. 2008; Lenstra et al. 2011). Additional evidence suggests that such chromatin marks may place a gene in a “poised” state without active transcription (Cotney et al. 2012) or that such marks may be the result rather than the cause of increases in transcription. Alternatively, they may simply set-up relatively permanent and stable gene expression patterns that depend on other factors for short-term variations. It is evident then that histone acetylation becomes somewhat disconnected with gene expression when it is induced, raising the question of whether this relation is correlative rather than causative.
As mentioned previously, if the role of certain acetylated histone patterns is to prime a gene for expression before some other criterion (i.e. activation of known plasticity signaling pathways) is met, then the reason why others observe a gene expression and functional effect could be because they are performing some sort of manipulation on the animal while it is being administered an HDACi. To address this, the study by Lopez-Atalaya et al. (2013) examined changes in histone acetylation patterns and gene expression after an exposure to a novel environment with and without administration of TSA. Administration of TSA failed to affect the expression of novelty-induced genes, indicating that if these genes are indeed primed for expression, the presence of TSA is insufficient to enhance it beyond the level observed in its absence. However, neither this work nor the study by Lopez-Atalaya et al. (2013) explicitly tested animals under conditions known to strongly drive plasticity and so we cannot be entirely sure whether or not we would see the activation of plasticity-related genes or structural plasticity in spines under such conditions.
Our analysis indicated that TSA administration increased the levels of both activating (AcH3Lys9 and AcH3Lys14) and repressive (AcH4Lys12) acetylation marks (Fig. 3), which may have a balancing effect on gene expression resulting from the opposing signal from these two types of modifications. Indeed, TSA is a pan-HDAC inhibitor and therefore increases histone acetylation without regard to specific residues. Perhaps a more specific HDACi may be capable of inducing gene expression by only inhibiting removal of activating histone acetylation marks. TSA-induced histone acetylation may instead exert its effects through production of lncRNAs, which then modulate splicing and translation events. Although lncRNAs do affect both histone modifications (Nagano and Fraser 2009) and transcription (Feng et al. 2006; Goodrich and Kugel 2006; Nagano and Fraser 2009), it is unlikely that TSA is working through such lncRNAs, as we saw little difference in the transcriptional profile of protein-coding genes between conditions. More likely, if these lncRNAs are exerting functional effects, it is through differential splicing or translation, which could have a large degree of influence on the function of neurons without affecting gene expression. Therefore, the possibility still exists that HDACis are able to influence cellular processes through the differential production of lncRNAs which then exert post-transcriptional effects and indeed, this will likely be a profitable area of research in the future. In any case, as none of the differentially transcribed lncRNA had been assigned functions at the time of publication, their roles remain hypothetical for the time being. Although peripheral cells such as leukocytes may have gene expression events that are inducible by TSA administration, our data indicate that the patterns of transcription for protein-coding regions in the mature brain are relatively resilient to manipulation. This may not be so for lncRNAs however. Given the necessity for stability and constancy in the maintenance of neuronal connectivity, memory, and function across the lifespan, it is not surprising that the brain has intrinsic mechanisms to keep the patterns of its gene expression stable in the face of outside influence.
Acknowledgments
We would like to thank Steven Reilly for his assistance with the RNA-seq pipeline and data analysis and Dr. Andy Shih for his assistance with teaching the cortical thinning technique. The authors acknowledge the technical assistance of Mariamma Pappy and Shawna Rodriguez. We also thank members of the Rakic lab for critical comments on the manuscript. J.B. is supported by a Natural Sciences and Engineering Research Council of Canada Postgraduate Fellowship 403855-2011 and the Department of Psychology at Yale University. This work was supported by National Institutes of Health Grants DA02399 (to P. R and A. E. A), and the Kavli Institute for Neuroscience at Yale University. We thank Christopher Castaldi, David Harrison, and Kaya Bilguvar for assistance with RNAseq at the Yale Center for Genome Analysis. The Yale University Biomedical High Performance Computing Center is supported by NIH Grant RR19895.
Contributor Information
Jamie Benoit, Email: jamie.benoit@yale.edu, benoitj@mit.edu.
Pasko Rakic, Email: pasko.rakic@yale.edu.
References
- Akhtar MW, Raingo J, Nelson ED, Montgomery RL, Olson EN, Kavalali ET, Monteggia LM. Histone deacetylases 1 and 2 form a developmental switch that controls excitatory synapse maturation and function. J Neurosci Off J Soc Neurosci. 2009;29:8288–8297. doi: 10.1523/JNEUROSCI.0097-09.2009. [DOI] [PMC free article] [PubMed] [Google Scholar]
- Alarcon JM, Malleret G, Touzani K, Vronskaya S, Ishii S, Kandel ER, Barco A. Chromatin acetylation, memory, and LTP are impaired in CBP ± mice: a model for the cognitive deficit in Rubinstein-Taybi syndrome and its amelioration. Neuron. 2004;42:947–959. doi: 10.1016/j.neuron.2004.05.021. [DOI] [PubMed] [Google Scholar]
- Allfrey V, Faulkner R, Mirsky A. Acetylation and methylation of histones and their possible role in the regulation of RNA synthesis. Proc Natl Acad Sci USA. 1964;51:9. doi: 10.1073/pnas.51.5.786. [DOI] [PMC free article] [PubMed] [Google Scholar]
- Ayoub A, Oh S, Xie Y, Leng J, Cotney J, Dominguez M, Noonan J, Rakic P. Transcriptional programs in transient embryonic zones of the cerebral cortex defined by high-resolution mRNA sequencing. Proc Natl Acad Sci USA. 2011;108:6. doi: 10.1073/pnas.1112213108. [DOI] [PMC free article] [PubMed] [Google Scholar]
- Barrett RM, Malvaez M, Kramar E, Matheos DP, Arrizon A, Cabrera SM, Lynch G, Greene RW, Wood MA. Hippocampal focal knockout of CBP affects specific histone modifications, long-term potentiation, and long-term memory. Neuropsychopharmacol Off Publ Am Coll Neuropsychopharmacol. 2011;36:1545–1556. doi: 10.1038/npp.2011.61. [DOI] [PMC free article] [PubMed] [Google Scholar]
- Beltran M, Puig I, Pena C, Garcia JM, Alvarez AB, Pena R, Bonilla F, de Herreros AG. A natural antisense transcript regulates Zeb2/Sip1 gene expression during Snail1-induced epithelial-mesenchymal transition. Genes Dev. 2008;22:756–769. doi: 10.1101/gad.455708. [DOI] [PMC free article] [PubMed] [Google Scholar]
- Brown JW, Marshall DF, Echeverria M. Intronic noncoding RNAs and splicing. Trends Plant Sci. 2008;13:335–342. doi: 10.1016/j.tplants.2008.04.010. [DOI] [PubMed] [Google Scholar]
- Carrieri C, Cimatti L, Biagioli M, Beugnet A, Zucchelli S, Fedele S, Pesce E, Ferrer I, Collavin L, Santoro C, Forrest AR, Carninci P, Biffo S, Stupka E, Gustincich S. Long non-coding antisense RNA controls Uchl1 translation through an embedded SINEB2 repeat. Nature. 2012;491:454–457. doi: 10.1038/nature11508. [DOI] [PubMed] [Google Scholar]
- Centonze D, Rossi S, Napoli I, Mercaldo V, Lacoux C, Ferrari F, Ciotti MT, De Chiara V, Prosperetti C, Maccarrone M, Fezza F, Calabresi P, Bernardi G, Bagni C. The brain cytoplasmic RNA BC1 regulates dopamine D2 receptor-mediated transmission in the striatum. J Neurosci Off J Soc Neurosci. 2007;27:8885–8892. doi: 10.1523/JNEUROSCI.0548-07.2007. [DOI] [PMC free article] [PubMed] [Google Scholar]
- Cotney J, Leng J, Oh S, DeMare LE, Reilly SK, Gerstein MB, Noonan JP. Chromatin state signatures associated with tissue-specific gene expression and enhancer activity in the embryonic limb. Genome Res. 2012;22:1069–1080. doi: 10.1101/gr.129817.111. [DOI] [PMC free article] [PubMed] [Google Scholar]
- Crosio C, Heitz E, Allis CD, Borrelli E, Sassone-Corsi P. Chromatin remodeling and neuronal response: multiple signaling pathways induce specific histone H3 modifications and early gene expression in hippocampal neurons. J Cell Sci. 2003;116:10. doi: 10.1242/jcs.00804. [DOI] [PubMed] [Google Scholar]
- Dai J, Hyland EM, Yuan DS, Huang H, Bader JS, Boeke JD. Probing nucleosome function: a highly versatile library of synthetic histone H3 and H4 mutants. Cell. 2008;134:1066–1078. doi: 10.1016/j.cell.2008.07.019. [DOI] [PMC free article] [PubMed] [Google Scholar]
- Daly K, Shirazi-Beechey S. Microarray analysis of butyrate regulated genes in colonic epithelial cells. DNA Cell Biol. 2006;25:13. doi: 10.1089/dna.2006.25.49. [DOI] [PubMed] [Google Scholar]
- Drew PJ, Shih AY, Driscoll JD, Knutsen PM, Blinder P, Davalos D, Akassoglou K, Tsai PS, Kleinfeld D. Chronic optical access through a polished and reinforced thinned skull. Nat Methods. 2010;7:981–984. doi: 10.1038/nmeth.1530. [DOI] [PMC free article] [PubMed] [Google Scholar]
- Fass DM, Reis SA, Ghosh B, Hennig KM, Joseph NF, Zhao WN, Nieland TJ, Guan JS, Kuhnle CE, Tang W, Barker DD, Mazitschek R, Schreiber SL, Tsai LH, Haggarty SJ. Crebinostat: a novel cognitive enhancer that inhibits histone deacetylase activity and modulates chromatin-mediated neuroplasticity. Neuropharmacology. 2013;64:81–96. doi: 10.1016/j.neuropharm.2012.06.043. [DOI] [PMC free article] [PubMed] [Google Scholar]
- Feng J, Bi C, Clark BS, Mady R, Shah P, Kohtz JD. The Evf-2 noncoding RNA is transcribed from the Dlx-5/6 ultraconserved region and functions as a Dlx-2 transcriptional coactivator. Genes Dev. 2006;20:1470–1484. doi: 10.1101/gad.1416106. [DOI] [PMC free article] [PubMed] [Google Scholar]
- Foti SB, Chou A, Moll AD, Roskams AJ. HDAC inhibitors dysregulate neural stem cell activity in the postnatal mouse brain. Int J Dev Neurosci Off J Int Soc Dev Neurosci. 2013;31:434–447. doi: 10.1016/j.ijdevneu.2013.03.008. [DOI] [PubMed] [Google Scholar]
- Fukuchi M, Nii T, Ishimaru N, Minamino A, Hara D, Takasaki I, Tabuchi A, Tsuda M. Valproic acid induces up- or down-regulation of gene expression responsible for the neuronal excitation and inhibition in rat cortical neurons through its epigenetic actions. Neurosci Res. 2009;65:35–43. doi: 10.1016/j.neures.2009.05.002. [DOI] [PubMed] [Google Scholar]
- Glaser K, Staver M, Waring J, Stender J, Ulrich R, Davidsen S. Gene expression profiling of multiple histone deacetylase (HDAC) inhibitors: defining a common gene set produced by HDAC inhibition in T24 and MDA carcinoma cell lines. Mol Cancer Ther. 2003;2:13. [PubMed] [Google Scholar]
- Goodrich J, Kugel J. Non-coding-RNA regulators of RNA polymerase II transcription. Nat Rev. 2006;7:5. doi: 10.1038/nrm1946. [DOI] [PubMed] [Google Scholar]
- Guan JS, Haggarty SJ, Giacometti E, Dannenberg JH, Joseph N, Gao J, Nieland TJ, Zhou Y, Wang X, Mazitschek R, Bradner JE, DePinho RA, Jaenisch R, Tsai LH. HDAC2 negatively regulates memory formation and synaptic plasticity. Nature. 2009;459:55–60. doi: 10.1038/nature07925. [DOI] [PMC free article] [PubMed] [Google Scholar]
- Haettig J, Stefanko DP, Multani ML, Figueroa DX, McQuown SC, Wood MA. HDAC inhibition modulates hippocampus-dependent long-term memory for object location in a CBP-dependent manner. Learn Mem. 2011;18:71–79. doi: 10.1101/lm.1986911. [DOI] [PMC free article] [PubMed] [Google Scholar]
- Kavalali ET, Nelson ED, Monteggia LM. Role of MeCP2, DNA methylation, and HDACs in regulating synapse function. J Neurodev Disord. 2011;3:250–256. doi: 10.1007/s11689-011-9078-3. [DOI] [PMC free article] [PubMed] [Google Scholar]
- Lenstra TL, Benschop JJ, Kim T, Schulze JM, Brabers NA, Margaritis T, van de Pasch LA, van Heesch SA, Brok MO, Groot Koerkamp MJ, Ko CW, van Leenen D, Sameith K, van Hooff SR, Lijnzaad P, Kemmeren P, Hentrich T, Kobor MS, Buratowski S, Holstege FC. The specificity and topology of chromatin interaction pathways in yeast. Mol Cell. 2011;42:536–549. doi: 10.1016/j.molcel.2011.03.026. [DOI] [PMC free article] [PubMed] [Google Scholar]
- Levenson JM, Sweatt JD. Epigenetic mechanisms: a common theme in vertebrate and invertebrate memory formation. Cell Mol Life Sci CMLS. 2006;63:1009–1016. doi: 10.1007/s00018-006-6026-6. [DOI] [PMC free article] [PubMed] [Google Scholar]
- Levenson JM, O’Riordan KJ, Brown KD, Trinh MA, Molfese DL, Sweatt JD. Regulation of histone acetylation during memory formation in the hippocampus. J Biol Chem. 2004;279:40545–40559. doi: 10.1074/jbc.M402229200. [DOI] [PubMed] [Google Scholar]
- Lopez-Atalaya JP, Ito S, Valor LM, Benito E, Barco A. Genomic targets, and histone acetylation and gene expression profiling of neural HDAC inhibition. Nucleic Acids Res. 2013;41:8072–8084. doi: 10.1093/nar/gkt590. [DOI] [PMC free article] [PubMed] [Google Scholar]
- Nagano T, Fraser P. Emerging similarities in epigenetic gene silencing by long noncoding RNAs. Mamm Genome Off J Int Mamm Genome Soc. 2009;20:557–562. doi: 10.1007/s00335-009-9218-1. [DOI] [PubMed] [Google Scholar]
- Nott A, Nitarska J, Veenvliet JV, Schacke S, Derijck AA, Sirko P, Muchardt C, Pasterkamp RJ, Smidt MP, Riccio A. S-nitrosylation of HDAC2 regulates the expression of the chromatin-remodeling factor Brm during radial neuron migration. Proc Natl Acad Sci USA. 2013;110:3113–3118. doi: 10.1073/pnas.1218126110. [DOI] [PMC free article] [PubMed] [Google Scholar]
- Pogo B, Allfrey V, Mirsky A. RNA synthesis and histone acetylation during the course of gene activation in lymphocytes. Proc Natl Acad Sci USA. 1966;55:8. doi: 10.1073/pnas.55.4.805. [DOI] [PMC free article] [PubMed] [Google Scholar]
- Putignano E, Lonetti G, Cancedda L, Ratto G, Costa M, Maffei L, Pizzorusso T. Developmental downregulation of histone posttranslational modifications regulates visual cortical plasticity. Neuron. 2007;53(5):747–759. doi: 10.1016/j.neuron.2007.02.007. [DOI] [PubMed] [Google Scholar]
- Stefanko DP, Barrett RM, Ly AR, Reolon GK, Wood MA. Modulation of long-term memory for object recognition via HDAC inhibition. Proc Natl Acad Sci USA. 2009;106:9447–9452. doi: 10.1073/pnas.0903964106. [DOI] [PMC free article] [PubMed] [Google Scholar]
- Sweatt JD. Experience-dependent epigenetic modifications in the central nervous system. Biol Psychiatry. 2009;65:191–197. doi: 10.1016/j.biopsych.2008.09.002. [DOI] [PMC free article] [PubMed] [Google Scholar]
- Turner BT, Birley AJ, Lavender J. Histone H4 isoforms acetylated at specific lysine residues define individual chromosomes and chromatin domains in drosophila polytene nuclei. Cell. 1992;69:10. doi: 10.1016/0092-8674(92)90417-b. [DOI] [PubMed] [Google Scholar]
- Umka J, Mustafa S, ElBeltagy M, Thorpe A, Latif L, Bennett G, Wigmore PM. Valproic acid reduces spatial working memory and cell proliferation in the hippocampus. Neuroscience. 2010;166:15–22. doi: 10.1016/j.neuroscience.2009.11.073. [DOI] [PubMed] [Google Scholar]
- Yoo DY, Kim W, Nam SM, Kim DW, Chung JY, Choi SY, Yoon YS, Won MH, Hwang IK. Synergistic effects of sodium butyrate, a histone deacetylase inhibitor, on increase of neurogenesis induced by pyridoxine and increase of neural proliferation in the mouse dentate gyrus. Neurochem Res. 2011;36:1850–1857. doi: 10.1007/s11064-011-0503-5. [DOI] [PubMed] [Google Scholar]