Figure 1.
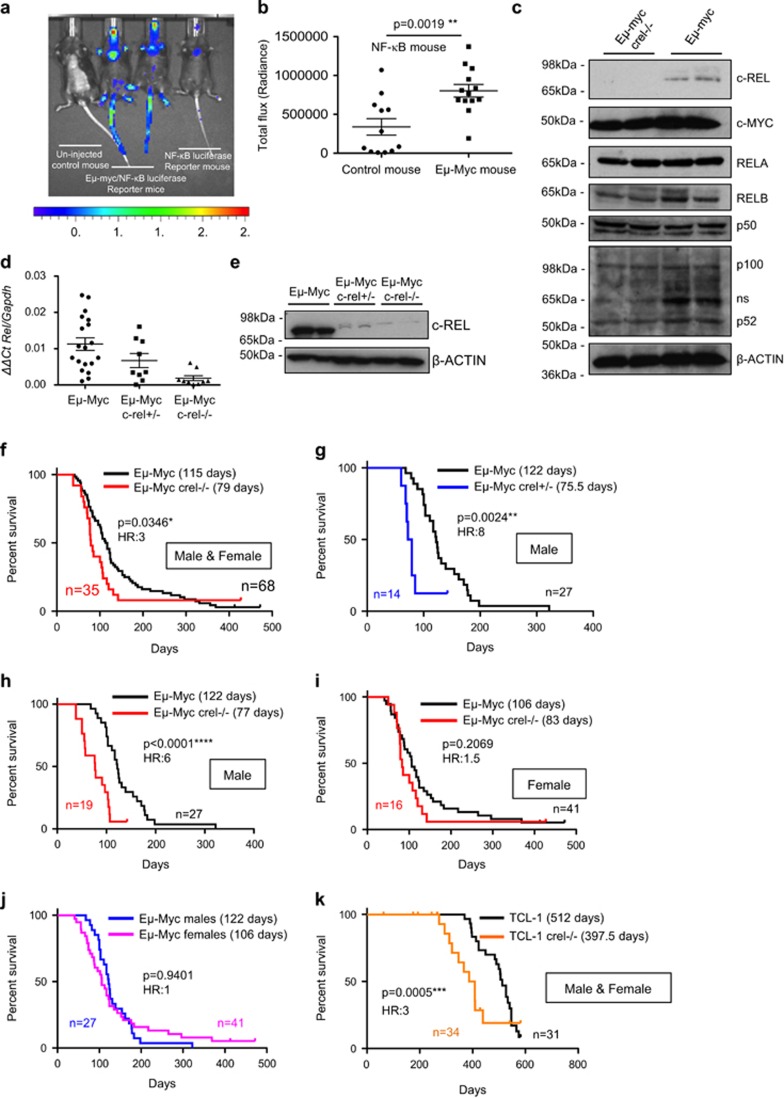
c-Rel functions as a tumour suppressor in Eμ-Myc-driven B-cell lymphoma in mice. (a) Representative image of in vivo NF-κB bioluminescence (radiance) of age-matched littermates of NF-κB-Luc and Eμ-Myc/NF-κB-Luc mice. Eight-week-old mice underwent in vivo imaging using the IVIS Spectrum system (Perkin Elmer, Beaconsfield, UK) after being intraperitoneally administration with 150 mg/kg VivoGlo d-luciferin (Promega, Southampton, UK) dissolved in sterile phosphate-buffered saline. Ten-min post-d-luciferin-administration, mice were imaged using a photon emission over 5 min, under isoflurane anaesthesia. Luminescence was seen in the thymic area and also in the tails and other exposed regions of the Eμ-Myc/NF-κB-Luc mice, the latter likely due to a higher number of circulating lymphocytes with increased NF-κB activity. (b) Quantification of NF-κB bioluminescence (radiance) of thymic regions in NF-κB-Luc (n=12) and Eμ-Myc/NF-κB-Luc (n=13) mice. Bioluminescence was quantified using the Living Image software version 4.3.1 (Perkins Elmer) and region of interest tool. Data shown as mean±s.e.m., **P<0.01, unpaired Student's t-tests. For all tests, where appropriate, analyses were undertaken to test for normal distribution. (c) Western blot analysis of the NF-κB subunits, c-REL, RELA, RELB, p100/p52 and p50 together with c-MYC in extracts prepared from Eμ-Myc and Eμ-Myc/c-rel–/– mouse tumorigenic spleens. Whole-cell extracts were prepared from Eμ-Myc or Eμ-Myc/c-rel–/– tumour cell suspensions. Cell pellets were washed with ice-cold phosphate-buffered saline and lysed using PhosphoSafe Extraction Reagent (Merck Millipore, Watford, UK). Antibodies used were c-Rel (sc-71 Santa Cruz, Insight Biotechnology, Wembley, UK), c-Myc (sc-42 Santa Cruz), RelA (sc-372 Santa Cruz), RelB (4954 Cell Signaling, Hitchin, UK), p50 (06-886 Merck Millipore), p100/p52 (sc-848 Santa Cruz) and β-Actin (A5441 Sigma-Aldrich, Gillingham, UK). (d) Quantitative-PCR analysis showing relative Rel expression in end-stage tumorigenic spleens from Eμ-Myc (n=20), Eμ-Myc/c-rel+/– (n=12) and Eμ-Myc/c-rel–/– (n=11) mice. Data shown as mean±s.e.m., each point is an individual mouse. (e) Western blot analysis of c-REL levels in tumorigenic spleens from Eμ-Myc, Eμ-Myc/c-rel+/– and Eμ-Myc/c-rel–/– mice. (f–j) Reduced survival of Eμ-Myc/c-rel+/– and Eμ-Myc/c-rel–/– mice. Kaplan–Meier plots showing survival curves for Eμ-Myc and (f) Eμ-Myc/c-rel–/– mice, (g) Eμ-Myc/c-rel+/– male mice, (h) Eμ-Myc/c-rel–/– male mice, (i) Eμ-Myc/c-rel–/– female mice and relative survival of male versus female Eμ-Myc mice is shown in (j). P-values (Mantel–Cox test) and hazard ratios are shown. (k) Kaplan–Meier plot showing reduced survival of TCL1/c-rel–/– mice. Animal handling, husbandry and experimentation were undertaken in compliance with UK Home Office regulations under project licences and approved by the local ethical review committee. All mice used in these experiments were on C57BL/6 background and bred at the Comparative Biology Centre, Newcastle University. c-rel–/– mice were provided by Dr Fiona Oakley (Newcastle University). NF-κB-luc (NF-κB-Luc–/+) reporter mice were a gift from Professor Matthew Wright (Newcastle) and originated in the laboratory of Professor Harald Carlsen (Norwegian University of Life Sciences). Eμ-Myc and TCL1-Tg mice were purchased from The Jackson Laboratory (Bar Harbor, ME, USA). Eμ-Myc/c-rel+/– offspring were generated by mating c-rel–/– female mice with Eμ-Myc male mice. Eμ-Myc/c-rel–/– mice were then generated by crossing Eμ-Myc/c-rel+/– males with c-rel–/– female mice. In TCL1-Tg mice, a human TCL1 coding sequence is expressed from a B29 minimal promoter, coupled with the IgH intronic enhancer resulting in B- and T-cell expression. TCL1/c-rel–/– offspring were generated as for Eμ-Myc by mating c-rel–/– female mice with TCL1-Tg male mice. All mice were designated to an experimental group-dependent on their strain and no blinding was undertaken during analysis. For survival analysis, mice were monitored daily and were killed at predetermined end points, defined as the animal becoming moribund, losing bodyweight/condition and/or having palpable tumour burden at any lymphoid organ site, at which point animals underwent necropsy. Kaplan–Meier survival curves were drawn using GraphPad Prism (Version 5.0, GraphPad Software, La Joll, CA, USA).

