Abstract
Objective
To evaluate effects of fibroglandular tissue (FGT) composition and background parenchymal enhancement (BPE) on diffusion tensor imaging (DTI) parameters in normal breast tissue.
Methods
DTI analysis was performed on 35 breasts with regions of interest drawn to include only normal tissue. Breasts were dichotomized by FGT composition and by BPE; DTI parameters were compared.
Results
The λ1 principal diffusion coefficient was lower in breasts with moderate/marked BPE versus those with minimal/mild BPE (p=0.039). All other parameters were unaffected.
Conclusion
λ1 is sensitive to differences in BPE within normal breast tissue which should be taken into account in DTI evaluation.
Keywords: diffusion, tensor, breast, normal, MRI, DTI
Introduction
Conventional breast magnetic resonance (MR) imaging is an extremely valuable tool owing to its high sensitivity for breast cancer detection and is widely used in screening high risk populations and preoperatively [1, 2]. It is limited by a specificity of 72 % [1]; however there is ongoing research evaluating ways to improve the specificity of breast MR. Initially, diffusion weighted imaging (DWI) was investigated to assess its utility in differentiating benign versus malignant lesions and has been shown to improve the accuracy of conventional MR [3,4]. The utility of DWI is based on the higher more concentrated cellular environment of a neoplasm resulting in increased restricted diffusion compared to benign lesions or normal breast tissue. Now interest has turned to diffusion tensor imaging (DTI), a more robust form of diffusion imaging, which is based on applying diffusion in multiple directions, which is sensitive to microstructural elements in addition to cellular density.
Theoretically, the diffusion of water molecules in the mammary tissue is directional and well defined by the microarchitecture composed of ductal/glandular trees [5]. Malignant lesions would alter this architecture by blocking and/or disrupting the ductal system. DTI derived measurements in the breast have been shown to be reproducible [6] and there is evidence supporting its ability to help discriminate between malignant and benign lesions [7-9].
In order for DTI to become clinically useful and gain favor as an adjunct to convention breast MR, DTI in the normal breast must first be fully understood. This requires the standardization of DTI parameters and assessing the normative range as well as improved understanding of factors that influence these values. Few publications have specifically focused on characterizing normal breast tissue [10, 11] and to our knowledge no group has evaluated the effects of fibroglandular tissue composition (FGT) and background parenchymal enhancement (BPE) on DTI measurements. Our goal was to measure DTI parameters at 3T in normal breast tissue and assess the influences of FGT composition and BPE.
Materials and methods
Subjects
This HIPAA compliant study involved 27 randomly chosen patients undergoing screening or preoperative breast MR during the period of October to December 2013. Informed consent was waived and IRB waiver was obtained due to the retrospective nature of the study.
DTI was performed in addition to the standard clinical protocol prior to the contrast injection. Of the 27 patients, 21 patients were included in the cohort and a total of 35 breasts were included in the final analysis. A patient was excluded if she was on neoadjuvant chemotherapy (n=2), if the technical quality of the study was poor (n=2), or due to prior mammoplasty or augmentation (n=2). Of the 21 individuals included in the study, a breast was excluded (n = 7 of 42 breasts) if it had undergone prior lumpectomy or mastectomy or contained an ipsilateral breast carcinoma. If a breast had a previous benign excision or biopsy, it was included with the region of interest (ROI) drawn at least 2 cm away from the site of surgery/biopsy. The mean age ± standard deviation (SD) of the subjects was 50 ± 10 years.
MR Image Acquisition
DTI was performed on a 3.0 T system (Discovery MR750; GE Healthcare, Waukesha, WI) using the body coil as a transmitter and a dedicated 16-channel phased-array receiver breast coil (Sentinelle Vanguard; Sentinelle Medical, Toronto, ON, Canada). The standard breast MRI protocol included a T2-weighted fast spin-echo sequence, a T1-weighted non-fat-suppressed sequence, and a T1-weighted fat-suppressed dynamic contrast enhanced sequence. Importantly, the DTI sequence was performed prior to the standard protocol as it has been shown that contrast administration alters ADC values [4].
DTI was performed using a diffusion weighted dual spin-echo echo-planar imaging sequence and with the following parameters: 4 mm slice thickness, gap 0, TR/TE=9000s/80-120ms with 3 averages; matrix 128 × 128, field of view 28-34cm. Total acquisition time was 3.2 minutes. Fat suppression was achieved by spectral-spatial radiofrequency pulses and dual shims were placed on breasts for optimal B0 sensitivity. Diffusion gradients were applied in 6 directions; the b factor was 0 and 600 s/mm2.
Image Analysis
The MRI examinations were interpreted prospectively by a fellowship trained radiologist specialized in breast imaging. Each case was reviewed for suspicious features and assigned a qualitative measurement of FGT composition and BPE using the American College of Radiology BI-RADS breast MRI lexicon [12]. The interpretation from the final radiology report was used to dichotomize breasts by FGT composition and BPE. Breasts that were almost entirely fat or composed of scattered fibroglandular tissue were grouped together; and heterogeneous and extremely fibroglandular breasts were grouped together. For BPE, breasts with minimal or mild BPE were grouped together; and moderate or marked BPE were grouped together.
The diffusion tensor MR images were retrospectively analyzed independently by a fellowship trained radiologist specialized in breast imaging with 6 years experience and by a medical physicist with 8 years of experience in breast MR research. Each reviewer was blinded to the patient's age, FGT composition, and BPE. Image analysis was performed using READY View software (GE Healthcare, Waukesha, WI) which is a semi-automated software tool allowing creation of color maps for all the DTI parameters of interest. ROI's were drawn within the visually most homogeneous breast parenchyma in the central depth at the level of the nipple on the T2-weighted fat-suppressed images obtained with a null b value with care to exclude adipose tissue or cysts using T1-weighted non-fat-suppressed, T1 post-contrast fat-suppressed, and T2-weighted sequences as anatomical references. The DTI parameters were calculated as a mean of the voxels within each ROI and recorded, including fractional anisotropy (FA), apparent diffusion coefficient (ADC), the principal diffusion coefficients (λ1, λ2, λ3), and maximal anisotropy (λ1-3). Selected ROI's had to be at least 30 mm2 in size (range 33-64 mm2)
Statistical Analyses
Interobserver agreement was assessed by measuring the Pearson correlation coefficient for each DTI parameter. The interobserver agreement was considered to be poor (0.00–0.20), weak (0.21–0.39), fair to good (0.40–0.75), or excellent (> 0.75) based on the calculated r value [13]. Box-and-whisker plots were generated to compare different groups. Box represents middle 50% of patients and the line across the box represents median value for the group of patients. A two-tailed student's t test for independent samples was used to assess for differences in the DTI parameters based on FGT composition (fatty/scattered versus heterogenous/extreme) and BPE (minimal/mild versus moderate/marked). A p value less than 0.05 was considered statistically significant. All analyses and graphing were performed using Origin 9.1 software (OriginLab Corporation, USA).
Results
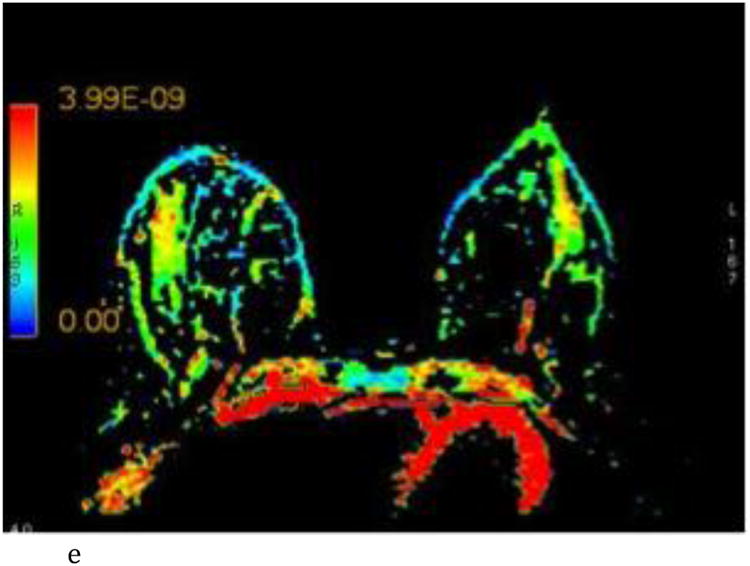
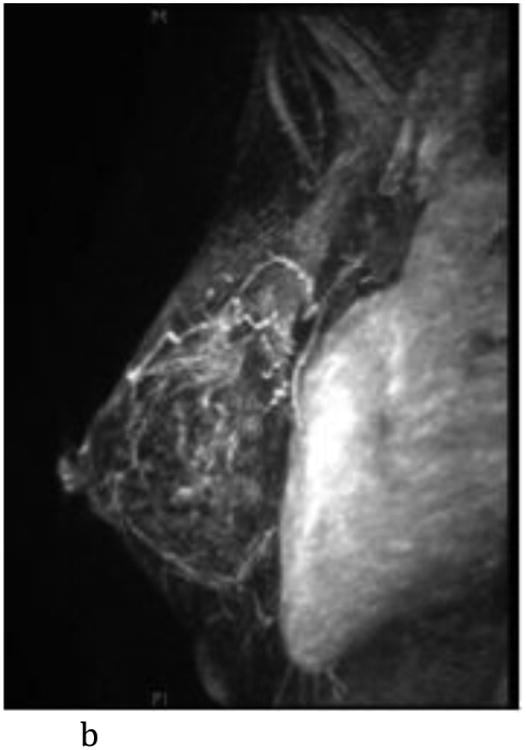
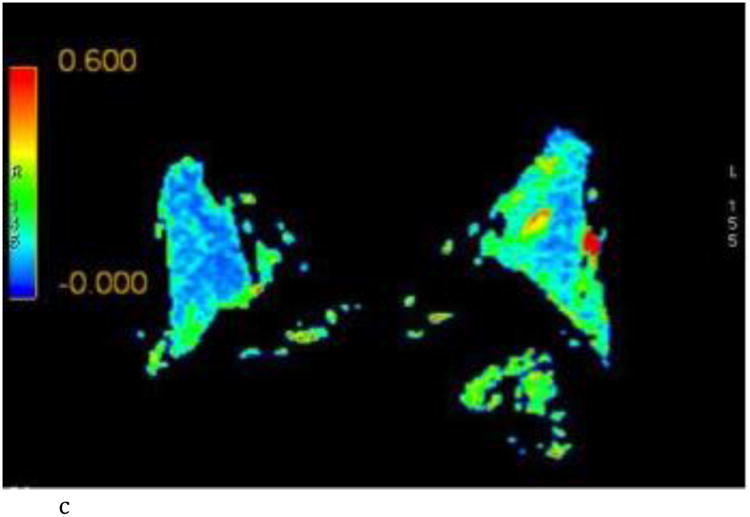
DTI analysis was performed on a total of 35 breasts. 15 breasts were classified as fatty or scattered and 20 were classified as heterogeneous or extreme FGT composition. 25 breasts were classified as having minimal or mild BPE and 10 were classified as having moderate or marked BPE. Imaging examples of a woman with scattered FGT and minimal BPE and a different woman with extreme FGT and marked BPE are provided in Figures 1 and 2, respectively.
Figure 1.
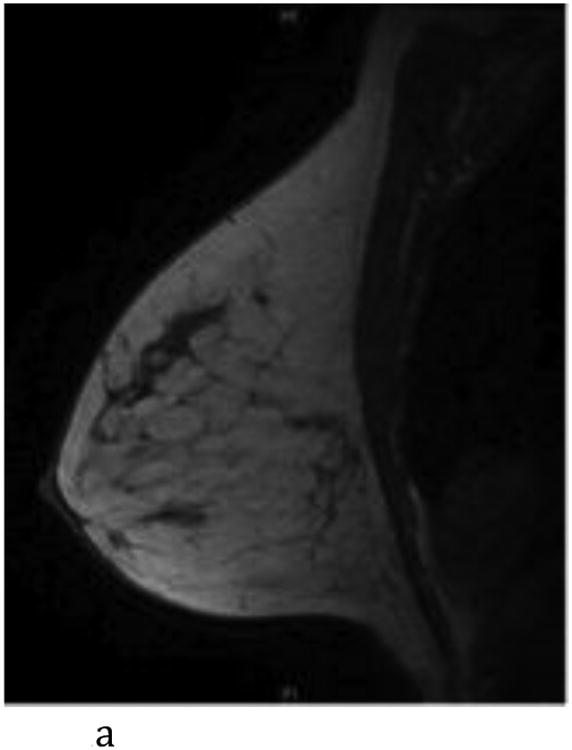
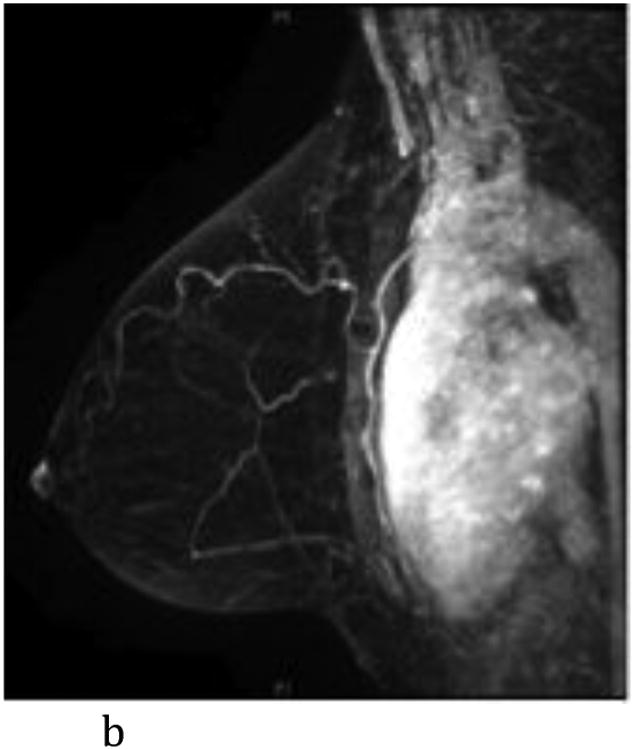
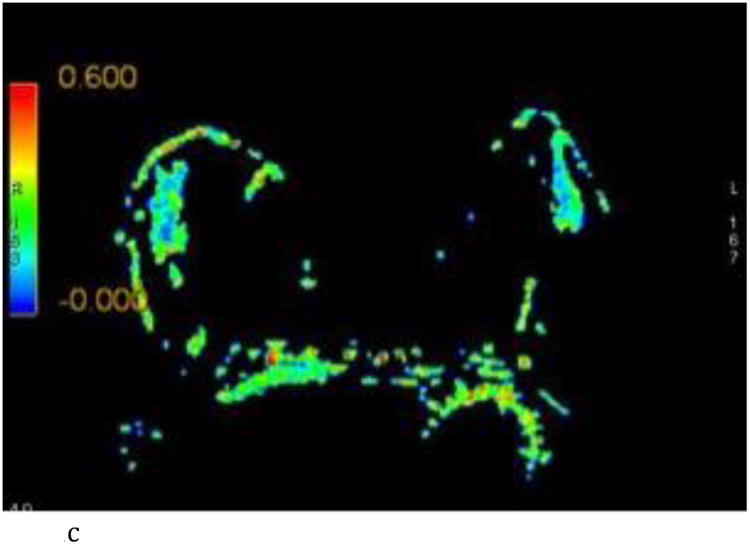
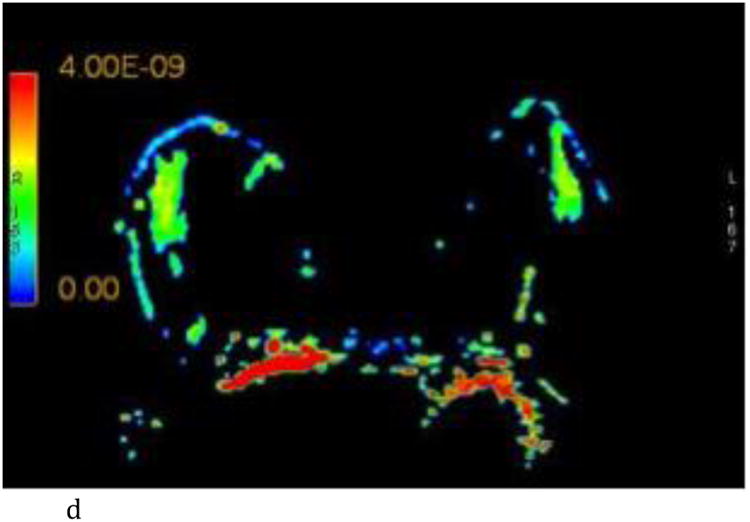
- Sagittal T1-weighted non-fat-suppressed MR image shows a normal left breast with scattered fibroglandular tissue.
- Sagittal T1-weighted fat-suppressed post contrast maximum intensity projection MR imaging shows a normal left breast with minimal background parenchymal enhancement.
- Axial FA color map.
- Axial ADC color map, color scale in m2/s.
- Axial λ1 color map, color scale in m2/s.
Figure 2.
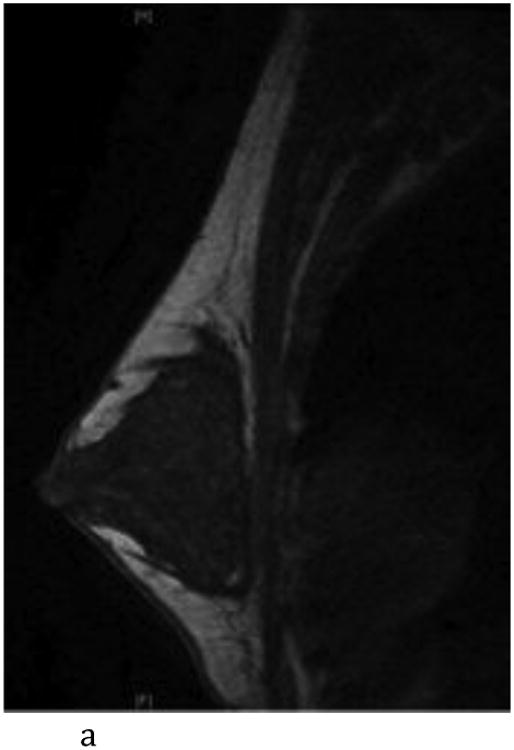
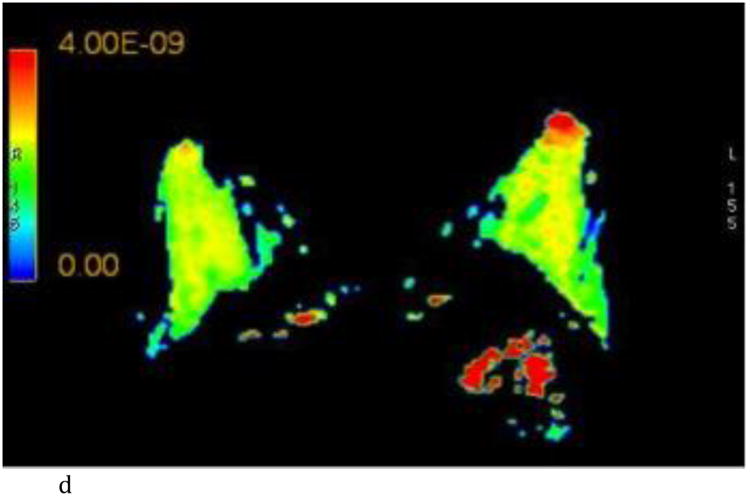
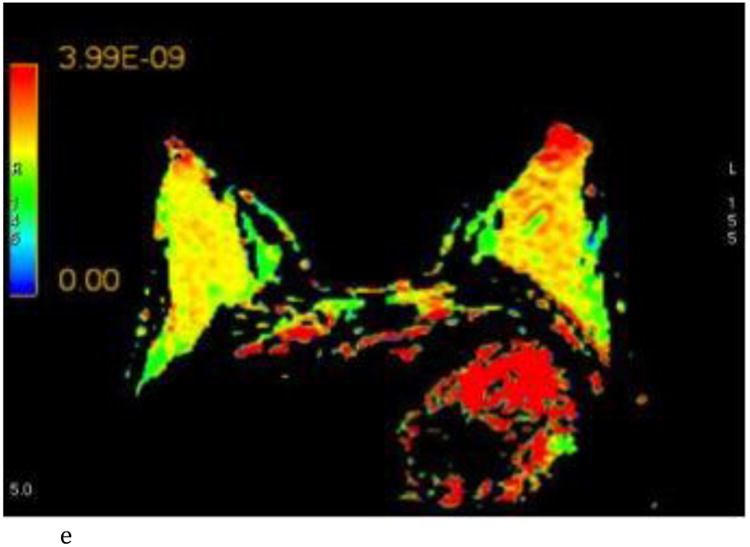
- Sagittal T1-weighted non-fat-suppressed MR image shows an extremely glandular normal left breast.
- Sagittal T1-weighted fat-suppressed post contrast maximum intensity projection MR imaging shows a normal left breast with marked background parenchymal enhancement.
- Axial FA color map.
- Axial ADC color map, color scale in m2/s.
- Axial λ1 color map, color scale in m2/s.
Interobserver agreement ranged from good to excellent for all the DTI parameters (r = 0.68 – 0.86) and is summarized in Table 1 and graphically represented in Figure 3. FGT composition did not yield any differences in the DTI values (p = 0.739 - 0.951). BPE influenced the λ1 principal diffusion coefficient and was associated with lower values in breasts with moderate/marked BPE compared to those with minimal/mild BPE (mean λ1, 2.15 ± 0.278 vs 2.40 ± 0.250; p= 0.039). Other DTI parameters showed no difference based on degree of BPE. All mean DTI values and associated p values are summarized in Table 1.
Table 1.
Summary of mean ± SD of the measured DTI parameters for each observer and each respective p value comparing groups based on FGT composition and BPE. Pearson's r correlation coefficient measuring interobserver agreement between observer 1 and 2 for each DTI parameter. (Units for ADC and the principal diffusion coefficients are ×10-3 mm2
| Fatty/Scattered FGT (n=15) | Heterogeneous/Extreme FGT (n=20) | p | Minimal/Mild BPE (n = 25) | Moderate/Marked BPE (n=10) | p | ||||||
|---|---|---|---|---|---|---|---|---|---|---|---|
| Observer 1 | |||||||||||
| FA | 0.19 ± 0.077 | 0.18 ± 0.068 | 0.831 | 0.18 ± 0.069 | 0.20 ± 0.079 | 0.421 | |||||
| ADC | 1.97 ± 0.240 | 1.99 ± 0.300 | 0.886 | 2.03 ± 0.234 | 1.83 ± 0.322 | 0.162 | |||||
| λ1 | 2.33 ± 0.180 | 2.33 ± 0.339 | 0.951 | 2.40 ± 0.250 | 2.15 ± 0.278 | 0.039 | |||||
| λ2 | 1.94 ± 0.237 | 1.97 ± 0.311 | 0.739 | 2.01 ± 0.240 | 1.81 ± 0.329 | 0.107 | |||||
| λ3 | 1.63 ± 0.337 | 1.66 ± 0.335 | 0.799 | 1.70 ± 0.301 | 1.51 ± 0.378 | 0.172 | |||||
| λ1-3 | 0.695 ± 0.231 | 0.672 ± 0.263 | 0.778 | 0.698 ± 0.272 | 0.641 ± 0.173 | 0.466 | |||||
| Observer 2 | |||||||||||
| FA | 0.19 ± 0.073 | 0.19 ±0.084 | 0.920 | 0.19 ± 0.078 | 0.18 ± 0.081 | 0.567 | |||||
| ADC | 2.05 ± 0.240 | 1.94 ± 0.366 | 0.586 | 2.05 ± 0.273 | 1.84 ± 0.387 | 0.151 | |||||
| λ1 | 2.43 ± 0.192 | 2.33 ± 0.415 | 0.550 | 2.46 ± 0.299 | 2.16 ± 0.350 | 0.048 | |||||
| λ2 | 2.03 ± 0.252 | 1.94 ± 0.361 | 0.600 | 2.04 ± 0.276 | 1.83 ± 0.181 | 0.185 | |||||
| λ3 | 1.66 ± 0.378 | 1.60 ± 0.389 | 0.830 | 1.67 ± 0.363 | 1.50 ± 0.414 | 0.356 | |||||
| λ1-3 | 0.765 ± 0.298 | 0.734 ± 0.302 | 0.720 | 0.783 ± 0.316 | 0.657 ± 0.229 | 0.169 | |||||
| Pearson's r coefficient | FA | ADC | λ1 | λ2 | λ2 | λ1-3 | |||||
| 0.70 | 0.82 | 0.86 | 0.84 | 0.80 | 0.68 | ||||||
Figure 3.
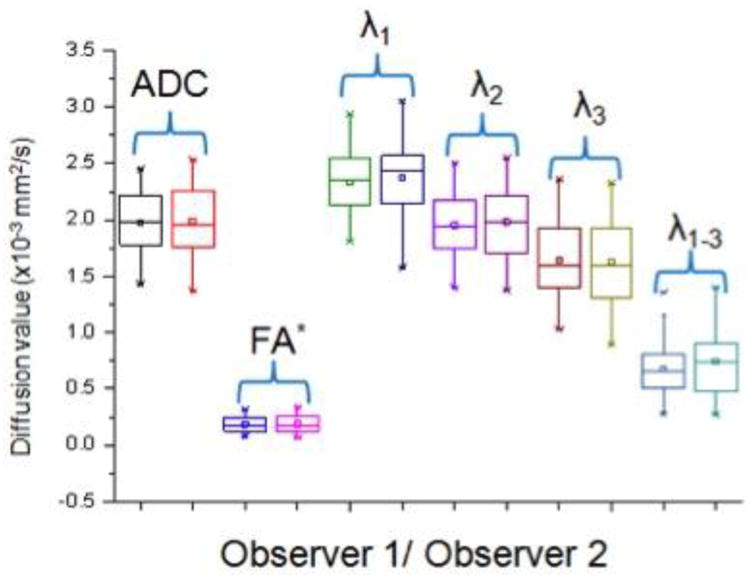
Side by side box plot representation of each DTI parameter for observer 1 and 2 reflecting good to excellent interobserver agreement. * - Note that FA is unit less.
Discussion
Our study dichotomized patients by FGT composition and found DTI parameters to be no different based on breast composition. Previous work with DWI found ADC to have a weak positive correlation with breast density in BRCA mutation carriers but not in post mantle radiotherapy patients [14]. This previous study was limited by small sample size and evaluated diffusion weighted imaging rather than diffusion tensor imaging. McDonald and colleagues also evaluated ADC in normal tissue using diffusion weighted imaging rather than DTI and found ADC values to increase with increased breast density [15]. Another major difference from our analysis is that previous evaluation of DWI in normal breasts grouped patients by density which is a mammographic assessment rather than by FGT as seen on MRI. It has been shown that while mammography and MR have high correlation for the assessment of density amongst nondense and nonglandular breasts, the correlation is low in dense and highly glandular breasts [16]. Additionally, correlation is not the same as equivalence; as the MRI dense volume tends to lower than mammographic dense area [17]. Previous analysis of normal breasts using specifically diffusion tensor imaging did not stratify patients by breast density or composition making our study the first of its kind [6,10, 11, 18]. Perhaps the differences in our results are further explained by the fact that ADC is calculated differently in each technique. ADC in the setting of DWI misses the local effects of cell membranes and microtubules which interfere with free diffusion and treats movement of water molecules all the same as if solely due to Brownian motion. On the other hand, ADC in the setting of DTI which is also termed mean diffusivity (MD), recognizes that normal breast tissue is anisotropic with the ductal system in place and that ADC will be different depending on the direction it is measured. MD provides an average of ADC taking into account differences in ADC along each of the three main x, y, and z axes. Moreover, FGT composition and density are assessments of the entire breast as a whole, but when an ROI is placed, one is specifically choosing individual voxels that are predominantly fibroglandular rather than fatty explaining why they do not suppress on the T2 weighted fat-suppressed sequences in which ROI's are chosen. As a result, it would be expected that DTI values would be the same across different FGT compositions because even in a predominantly fatty breast we are creating ROI's in the visually most fibroglandular region which stands to reason that it should be no different than a sample of a fibroglandular region in an overall extremely glandular breast. Our findings are additionally supported by histologic examinations that show that the number of ducts in a breast is constant and independent of overall mammographic density and that mammographic density is more a reflection of the amount of fibrous stroma [19].
BPE had no influence on DTI parameters except on the prime λ1 diffusion coefficient (p = 0.039). Previous works have shown that both BPE and DTI are influenced by hormones supporting the association we found between degree of BPE and λ1 values [11, 20, 21]. It is postulated that it is the effect of estrogen amongst other things that results in increased vascular dilatation and permeability that is responsible for increased BPE [21]. Other effects of estrogen include epithelial proliferation, differentiation of acini, thickening of basal lamina, and stimulating collagenous tissue that alters the breast microarchitecture and likely explains the effects on the λ1 value [21]. In examining DTI's ability to discriminate benign from malignant lesions, λ1 is the DTI parameter that has shown the most diagnostic accuracy and is considered the most efficient diffusion parameter showing the most lesion conspicuity, as in the example shown in Figure 4[8]. This supports our hypothesis that the reason other DTI parameters do not show differences in our study among the BPE groups is that they are not as sensitive to subtle differences in tissue architecture. Previous work using DWI showed no differences in ADC based on BPE consistent with what we found with our DTI-derived ADC [15].
Figure 4.
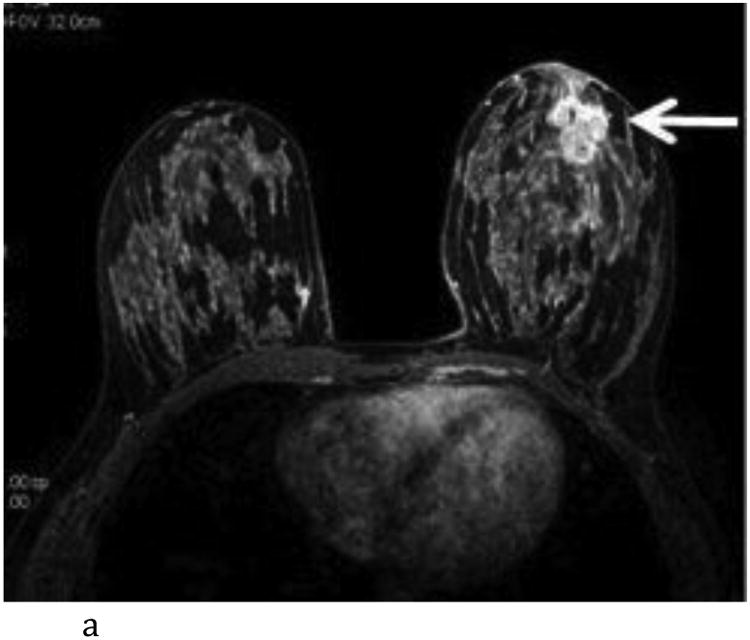
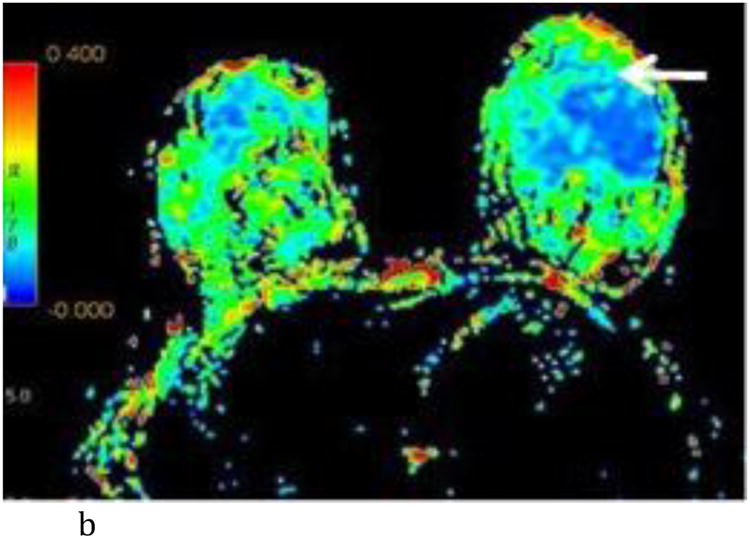
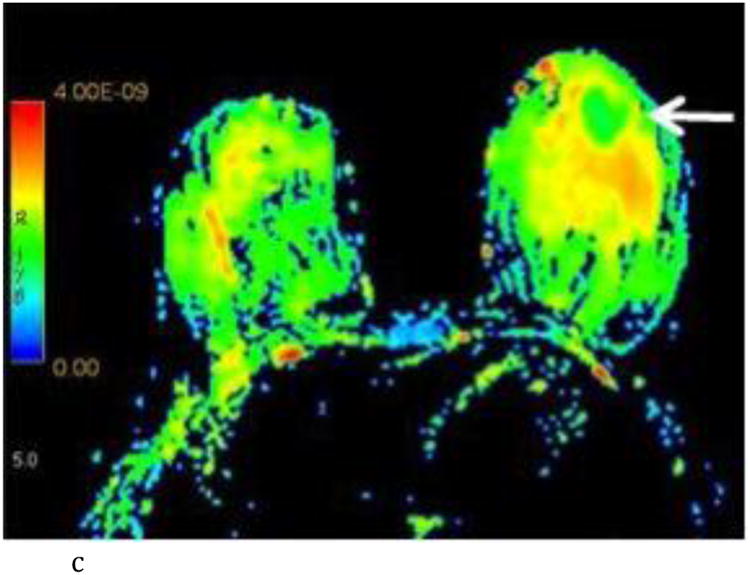
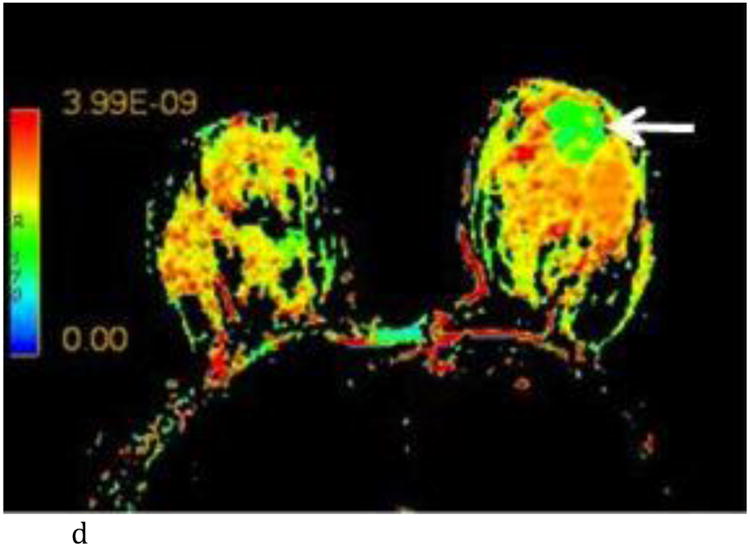
- Axial T1-weighted post contrast image with irregular shaped heterogeneously enhancing mass (white arrow) at the 6:00 axis anterior depth corresponding to biopsy proven carcinoma.
- Axial FA color map. The white arrow points to the site of the known tumor which is not conspicuous using FA.
- Axial ADC color map with visually low ADC of the known carcinoma (white arrow) compared to adjacent normal breast tissue. (color scale in m2/s)
- Axial λ1 color map with visually low λ1 value of the known carcinoma (white arrow) compared to adjacent normal breast tissue. (color scale in m2/s)
There are limitations to our study. First it is a retrospective study, so that we cannot establish a causal relationship between λ1 and BPE and instead can only speak to their association. We were limited by a small sample size but despite the small size a statistically significant difference was found for λ1 and interestingly it was in this variable that had the best interobserver agreement (Figure 5) suggesting that further prospective studies with a larger cohort would support our initial findings. Additionally, it is hypothesized that within a larger cohort if minimal BPE was compared to marked BPE, the difference in λ1 would be even more dramatic. Another possible limitation is that the ROI's were selected to involve only a region of the breast rather than the entire breast itself. Data in the literature is conflicting with some reports suggesting there are regional differences in DTI parameters whereas others say there are not [6,18]. Our method of selecting the ROI is validated by the excellent interobserver agreement we found and was done purposely in an attempt to mirror how an ROI would be selected in clinical practice. For example, similar to MR spectroscopy in the brain in which an ROI is hand drawn in normal white matter as an internal reference standard, future use of DTI in the breast may require drawing an ROI in normal FGT as an internal reference standard when characterizing an indeterminate lesion.
Figure 5.
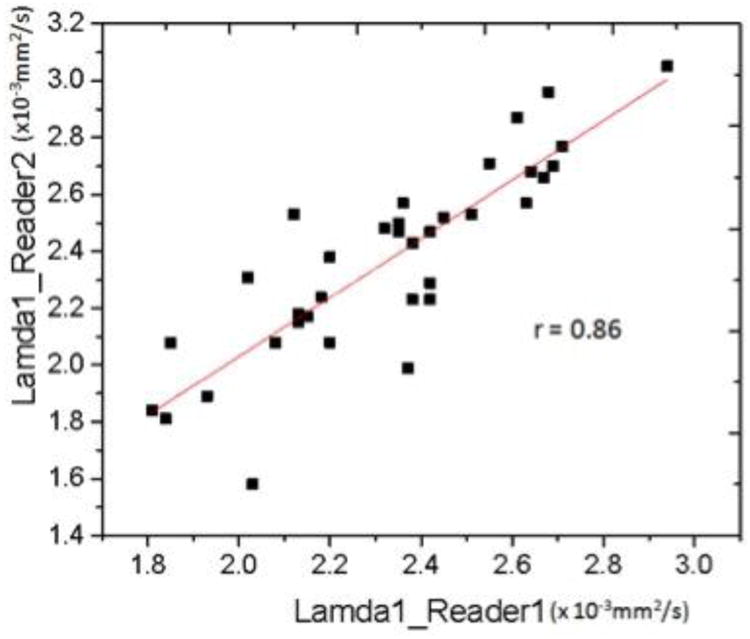
Pearson's r correlation coefficient scatter plot for λ1 values recorded by observer 1 and observer 2.
Future directions in DTI will focus on standardizing the DTI sequence and establishing normal baseline values for DTI parameters which would facilitate multicenter trials. Additionally, the end goal of DTI would be as a tool to improve the specificity of breast MRI and decrease the number of unnecessary MR biopsies performed in women. Our results speak to the ability of DTI and specifically λ1 to detect subtle differences in breast architecture suggesting future work should focus on λ1 and its potential for helping differentiate between benign and malignant lesions.
In summary, breast DTI parameters are not sensitive to FGT composition, whereas the principal diffusion coefficient λ1 is influenced by the degree of BPE in normal breast tissue. The clinical implication is that BPE should be taken into account with DTI evaluation. Further prospective studies with larger cohorts would be needed to validate these findings.
Footnotes
Disclosures: No conflicts of interest.
Publisher's Disclaimer: This is a PDF file of an unedited manuscript that has been accepted for publication. As a service to our customers we are providing this early version of the manuscript. The manuscript will undergo copyediting, typesetting, and review of the resulting proof before it is published in its final citable form. Please note that during the production process errors may be discovered which could affect the content, and all legal disclaimers that apply to the journal pertain.
Contributor Information
Michael Jonathan Plaza, Email: Michael.j.plaza@gmail.com, Department of Radiology, Memorial Sloan Kettering Cancer Center, 300 E 66th St, New York, NY 10065.
Elizabeth A. Morris, Email: morrise@mskcc.org, Department of Radiology, Memorial Sloan Kettering Cancer Center, 300 E 66th St, New York, NY 10065, Phone: 646-888-4510.
Sunitha B. Thakur, Email: thakurs@mskcc.org, Department of Radiology, Memorial Sloan Kettering Cancer Center, 300 E 66th St, New York, NY 10065, Phone: 646-888-4816.
References
- 1.Peters NH, Borel Rinkes IH, Zuithoff NP, Mali WP, Moons KG, Peters PH. Meta-Analysis of MR Imaging in the Diagnosis of Breast Lesions. Radiology. 2008 Jan;246(1):116–24. doi: 10.1148/radiol.2461061298. [DOI] [PubMed] [Google Scholar]
- 2.Plana MN, Carreira C, Muriel A, et al. Magnetic resonance imaging in the preoperative assessment of patients with primary breast cancer: systematic review of diagnostic accuracy and meta-analysis. Eur Radiol. 2012 Jan;22(1):26–38. doi: 10.1007/s00330-011-2238-8. [DOI] [PubMed] [Google Scholar]
- 3.Partridge SC, DeMartini WB, Kurland BF, Eby PR, White SW, Lehman CD. Quantitative diffusion-weighted imaging as an adjunct to conventional breast MRI for improved positive predictive value. AJR Am J Roentgenol. 2009 Dec;193(6):1716–22. doi: 10.2214/AJR.08.2139. [DOI] [PubMed] [Google Scholar]
- 4.Thomassin-Naggara I, De Bazelaire C, Chopier J, Bazot M, Marsault C, Trop I. Diffusion-weighted MR imaging of the breast: Advantages and pitfalls. Eur J Radiol. 2013 Mar;82(3):435–43. doi: 10.1016/j.ejrad.2012.03.002. [DOI] [PubMed] [Google Scholar]
- 5.Furman-Haran E, Eyal E, Shapiro-Feinberg, et al. Advantages and drawbacks of breast DTI. Eur J Radiol. 2012 Sep;81 Suppl 1:S45–7. doi: 10.1016/S0720-048X(12)70017-7. [DOI] [PubMed] [Google Scholar]
- 6.Tagliafico A, Rescinito G, Monetti F, et al. Diffusion tensor magnetic resonance imaging of the normal breast: reproducibility of DTI-derived fractional anisotropy and apparent diffusion coefficient at 3.0 T. Radiol Med. 2012 Sep;117(6):992–1003. doi: 10.1007/s11547-012-0831-9. [DOI] [PubMed] [Google Scholar]
- 7.Baltzer PA, Schäfer A, Dietzel M, et al. Diffusion Tensor MRI of the breast: a pilot study. Eur Radiol. 2011 Jan;21(1):1–10. doi: 10.1007/s00330-010-1901-9. [DOI] [PubMed] [Google Scholar]
- 8.Eyal E, Shapiro-Feinberg M, Furman-Haran E, et al. Parametric diffusion tensor imaging of the breast. Invest Radiol. 2012 May;47(5):284–91. doi: 10.1097/RLI.0b013e3182438e5d. [DOI] [PubMed] [Google Scholar]
- 9.Cakir O, Arslan A, Inan N, et al. Comparison of the diagnostic performance of diffusion parameters in diffusion weighted imaging and diffusion tensor imaging of breast lesions. Eur J Radiol. 2013 Dec;82(12):e801–6. doi: 10.1016/j.ejrad.2013.09.001. [DOI] [PubMed] [Google Scholar]
- 10.Partridge SC, Murthy RS, Ziadloo A, White SW, Allison KH, Lehman CD. Diffusion tensor magnetic resonance imaging of normal breast. Magn Reson Imaging. 2010 Apr;28(3):320–8. doi: 10.1016/j.mri.2009.10.003. [DOI] [PubMed] [Google Scholar]
- 11.Nissan N, Furman-Haran E, Shapiro-Feinberg M, Grobgeld D, Degani H. Diffusion-Tensor MR Imaging of the Breast: Hormonal Regulation. Radiology. 2014 Jun;271(3):672–80. doi: 10.1148/radiol.14132084. [DOI] [PubMed] [Google Scholar]
- 12.Morris EA, Comstock CE, Lee CH, et al. ACR BI-RADS® Atlas, Breast Imaging Reporting and Data System. Reston, VA: American College of Radiology; 2013. ACR BI-RADS® Magnetic Resonance Imaging. [Google Scholar]
- 13.Fleiss JL. The design and analysis of clinical experiments. New York, NY: Wiley; 1986. pp. 1–32. [Google Scholar]
- 14.O'Flynn EA, Wilson RM, Allen SD, Locke I, Scurr E, deSouza NM. Diffusion-Weighted Imaging of the High-Risk Breast: Apparent diffusion Coefficient Values and Their Relationship to Breast Density. J Magn Reson Imaging. 2014 Apr;39(4):805–11. doi: 10.1002/jmri.24243. [DOI] [PubMed] [Google Scholar]
- 15.McDonald ES, Schopp JG, Peacock S, et al. Diffusion-weighted MRI: association between patient characteristics and apparent diffusion coefficients of normal breast fibroglandular tissue at 3 T. AJR Am J Roentgenol. 2014 May;202(5):W496–502. doi: 10.2214/AJR.13.11159. [DOI] [PMC free article] [PubMed] [Google Scholar]
- 16.Klifa C, Carbadillo-Gamio J, Wilmes L, et al. Magnetic resonance imaging for secondary assessment of breast density in a high risk cohort. Magn Reson Imaging. 2010 Jan;28(1):8–15. doi: 10.1016/j.mri.2009.05.040. [DOI] [PMC free article] [PubMed] [Google Scholar]
- 17.Thompson DJ, Leach MO, Kwan-Lim G, et al. Assessing the usefulness of a novel MRI-based breast density estimation algorithm in a cohort of women at high genetic risk of breast cancer: the UK MARIBS study. Breast Cancer Res. 2009;11(6):R80. doi: 10.1186/bcr2447. [DOI] [PMC free article] [PubMed] [Google Scholar]
- 18.Wiederer J, Pazahr S, Leo C, Nanz D, Boss A. Quantitative breast MRI: 2D histogram analysis of diffusion tensor parameters in normal tissue. Magn Reson Mater Phy. 2014;27:185–193. doi: 10.1007/s10334-013-0400-9. [DOI] [PubMed] [Google Scholar]
- 19.Harvey JA, Santen RJ, Petroni GR, et al. Histologic changes in the breast with menopausal hormone therapy use: correlation with breast density, estrogen receptor, progesterone receptor, and proliferation indices. Menopause. 2008 Jan-Feb;15(1):67–73. doi: 10.1097/gme.0b013e318054e29a. [DOI] [PMC free article] [PubMed] [Google Scholar]
- 20.Hegenscheid K, Schmidt CO, Seipel R, et al. Normal Breast Parenchyma: Contrast Enhancement Kinetics at Dynamic MR Mammography—Influence of Anthropometric Measures and Menopausal Status. Radiology. 2013 Jan;266(1):72–80. doi: 10.1148/radiol.12112590. [DOI] [PubMed] [Google Scholar]
- 21.Kang SS, Ko EY, Han BK, Shin JH, Hahn SY, Ko ES. Background parenchymal enhancement on breast MRI: influence of menstrual cycle and breast composition. J Magn Reson Imaging. 2014 Mar;39(3):526–34. doi: 10.1002/jmri.24185. [DOI] [PubMed] [Google Scholar]


