

Abstract
Background:
The effectiveness of anterior cruciate ligament (ACL) reconstruction in preventing early osteoarthritis is debated. Restoring the original biomechanics may potentially prevent degeneration, but apparent pathomechanisms have yet to be described. Newer quantitative magnetic resonance (qMR) imaging techniques, specifically T1ρ and T2, offer novel, noninvasive methods of visualizing and quantifying early cartilage degeneration.
Purpose:
To determine the tibiofemoral biomechanical alterations before and after ACL reconstruction using magnetic resonance imaging (MRI) and to evaluate the association between biomechanics and cartilage degeneration using T1ρ and T2.
Study Design:
Cohort study; Level of evidence, 2.
Methods:
Knee MRIs of 51 individuals (mean age, 29.5 ± 8.4 years) with unilateral ACL injuries were obtained prior to surgery; 19 control subjects (mean age, 30.7 ± 5.3 years) were also scanned. Follow-up MRIs were obtained at 6 months and 1 year. Tibial position (TP), internal tibial rotation (ITR), and T1ρ and T2 were calculated using an in-house Matlab program. Student t tests, repeated measures, and regression models were used to compare differences between injured and uninjured sides, observe longitudinal changes, and evaluate correlations between TP, ITR, and T1ρ and T2.
Results:
TP was significantly more anterior on the injured side at all time points (P < .001). ITR was significantly increased on the injured side prior to surgery (P = .033). At 1 year, a more anterior TP was associated with elevated T1ρ (P = .002) and T2 (P = .026) in the posterolateral tibia and with decreased T2 in the central lateral femur (P = .048); ITR was associated with increased T1ρ in the posteromedial femur (P = .009). ITR at 6 months was associated with increased T1ρ at 1 year in the posteromedial tibia (P = .029).
Conclusion:
Persistent biomechanical alterations after ACL reconstruction are related to significant changes in cartilage T1ρ and T2 at 1 year postreconstruction. Longitudinal correlations between ITR and T1ρ suggest that these alterations may be indicative of future cartilage injury, leading to degeneration and osteoarthritis.
Clinical Relevance:
Newer surgical techniques should be developed to eliminate the persistent anterior tibial translation commonly seen after ACL reconstruction. qMR will be a useful tool to evaluate the ability of these newer techniques to prevent cartilage changes.
Keywords: ACL, MRI, T1rho, osteoarthritis
One of the most common sports injuries in the United States is an anterior cruciate ligament (ACL) injury. Many of these injuries are treated surgically with ACL reconstruction (ACLR), and the number of cases is increasing.34 While ACLR has been successful at restoring functional stability in the majority of patients38,52 and reducing meniscal and chondral injuries,10,53 there is currently no consensus regarding its ability to prevent posttraumatic osteoarthritis (PTOA).41,45 ACL injuries typically occur in patients younger than 40 years, and studies have shown the development of osteoarthritis (OA) 10 years after ACLR in as many as 56% of patients,32 indicating how ACL injuries are contributing to the rising prevalence of OA in younger patients.12,47 Unfortunately, current treatment options for early onset OA are limited.11
There is great interest in understanding the pathomechanism behind ACL injury and PTOA. One of the major purposes of ACLR is to restore the biomechanics of the knee. In addition, restoring normal kinematics may reduce aberrant loading and stress on cartilage—key factors in early cartilage degeneration that lead to PTOA.4,5,16 However, the exact pathomechanism from biomechanical changes to cartilage degeneration is still unclear. ACLR aims to reduce anterior tibial translation and internal rotation seen in ACL-deficient knees,9,19,26,44,46 but results after surgery have varied. Some studies report partial restoration while others have reported continued abnormalities, including both increased laxity and overconstraints.18,23,37,50 Different methods, such as static versus dynamic measurements or 3-dimensional (3D) motion analyses versus radiological image analyses, have varying limitations that may contribute to these different results. Therefore, to observe subtle alterations in bony alignment too small to be detected by physical examination, methods of calculating tibial translation and rotation using magnetic resonance imaging (MRI) have been developed.15
MRIs, in addition to providing a comprehensive 3D representation of the knee, can detect early cartilage degeneration before symptom manifestation and radiographic changes. Specifically, quantitative magnetic resonance (qMR), such as T1ρ and T2 mapping, has been suggested as a powerful tool in detecting and following early signs of cartilage degeneration. These sequences are correlated with the biochemical composition of cartilage matrix by detecting the amount of proteoglycans, water, and collagen in the matrix.3,27,35,36 Elevated T1ρ and T2 relaxation times have been observed in cartilage found in OA knees,30 after ACL injuries,33,48 and after ACLR.29,48,51,54 Following disease progression after trauma offers a unique opportunity to observe early cartilage changes in a young but high-risk population. We hypothesize that joint biomechanics after ACLR are related to subsequent changes in cartilage matrix composition measured by T1ρ and T2, demonstrating a great potential in the identification and characterization of early cartilage degeneration after reconstruction.
The aims of our study were (1) to determine the tibiofemoral biomechanical alterations present before ACLR and the restoration of these alterations after ACLR and (2) to evaluate the association between joint biomechanics and cartilage degeneration measured with T1ρ and T2 relaxation times 1 year after surgery.
Methods
Subjects
As part of an ongoing longitudinal cohort study, 51 patients with acute, unilateral ACL injuries from low-energy mechanisms had bilateral knees scanned at a mean 11 ± 7 weeks (range, 1-33 weeks) after injury. At 1 year, 42 ACL subjects had returned for their follow-up scans. Exclusion criteria included previous injury or surgery to either knee, history of rheumatoid arthritis or other inflammatory joint diseases, diagnosis of osteoarthritis, and multiligamentous injury requiring surgical treatment in addition to ACLR. These patients were scanned at baseline prior to surgery and at 6 months and at 1 year after surgery. Nineteen healthy control subjects with no history of knee injury or surgery were also evaluated at the time of recruitment, and 17 of them returned at 1 year after the initial scan. Subject characteristics at the time of recruitment are listed in Table 1. This study was approved by the institutional review board at the University of California, San Francisco, and informed consent was obtained from all subjects.
TABLE 1.
Demographic Information for the ACL and Control Cohortsa
| n | Age, y, Mean ± SD | BMI, kg/m2, Mean ± SD | Mean Time From Injury,b wk, to: | ||
|---|---|---|---|---|---|
| Baseline MRI | Surgery | ||||
| ACL cohort | |||||
| Total | 51 | 29.4 ± 8.5 | 24.3 ± 3.2 | 8.8 | 10.8 |
| Male | 29 | 29.1 ± 8.5 | 25.3 ± 3.3 | 10.8 | 12.4 |
| Female | 22 | 29.7 ± 8.6 | 23.0 ± 2.5 | 6.1 | 8.9 |
| Control cohort | |||||
| Total | 19 | 30.7 ± 5.3 | 24.3 ± 2.8 | NA | NA |
| Male | 13 | 30.2 ± 5.4 | 24.8 ± 2.8 | NA | NA |
| Female | 6 | 31.7 ± 5.5 | 23.4 ± 2.8 | NA | NA |
aACL, anterior cruciate ligament; BMI, body mass index; MRI, magnetic resonance imaging; NA, not applicable.
bThe exact date of injury for 3 patients could not be determined.
Surgery
All patients underwent single-bundle ACLR by 1 of 4 sports fellowship–trained orthopaedic surgeons at a single institution. Only soft tissue grafts were used: hamstrings, either allograft or autograft, or posterior tibialis allograft. Anatomic single-bundle ACLR was performed. The femoral tunnels were drilled using anteromedial portal drilling. All patients underwent standard postoperative rehabilitation programs at our sports medicine clinic.
Surveys
Patients were asked to complete a series of surveys, including Knee injury and Osteoarthritis Outcome Score (KOOS) and the Marx Activity Rating Scale (Marx). All surveys were collected at baseline, 6 months, and 1 year.
MRI Protocol
Bilateral knees were scanned using a 3-T MRI scanner (GE Healthcare) with an 8-channel phased array knee coil (Invivo) at all 3 time points. Protocols included (1) high-resolution 3D FSE (CUBE) (repetition time/echo time [TR/TE], 1500/26.69 ms; field of view, 16 cm; matrix size, 384 × 384; slice thickness, 0.5 mm; echo train length, 32), (2) quantitative combined T1ρ/T2 (T1ρ TSL [spin-lock time], 0/10/40/80 ms; spin-lock frequency, 500 Hz; field of view, 14 cm; matrix size, 256 × 128; slice thickness, 4 mm; T2 preparation TE, 0/12.87/25.69/51.39 ms), and (3) sagittal T2 fast spin echo (FSE) images (TR/TE, 4000/49.3 ms; slice thickness, 1.5 mm; spacing, 1.5 mm; field of view, 16 cm; matrix size, 512 × 512; echo train length, 9). The first 2 sequences were acquired with the knee unloaded; the third sequence was acquired with the knee extended and flexed (approximately 30°) with 25% body weight applied axially.15
Image Postprocessing
All postprocessing of images was performed with an in-house Matlab program (Mathworks).7 Tibiofemoral biomechanics was calculated using kinematics quantification methods previously described and demonstrated to have good reproducibility (Figure 1).8,15,25,54 Tibia and femur segmentations of the baseline contralateral (uninjured) knee were used to establish the coordinate systems for the respective bones. Iterative closest point registration technique was then used to fit the 3D cloud points obtained from segmentations of the injured side and follow-up scans.39 The 3D nature of this registration method, which aligns the same coordinate system onto all the images from a single subject, makes the process less sensitive to local segmentation errors that could potentially introduce inaccuracies. Tibial position (TP) in the anteroposterior direction was defined as the distance between the tibial and femoral coordinate system origins (yellow circles on Figure 1), with the more positive number indicating an anteriorly translated tibia. These established coordinates allow the evaluation of tibial and femoral positions with respect to each other in both the translational and rotational planes, and thus, the internal tibial rotation (ITR) is the rotation of the tibia with respect to the femur with a more positive number in the internal direction. Flexion angle (FA) was defined as the angle between the midlines drawn through the tibial and femoral shafts. Side-to-side difference (SSD) was calculated by subtracting the contralateral side measurements from the injured side.
Figure 1.
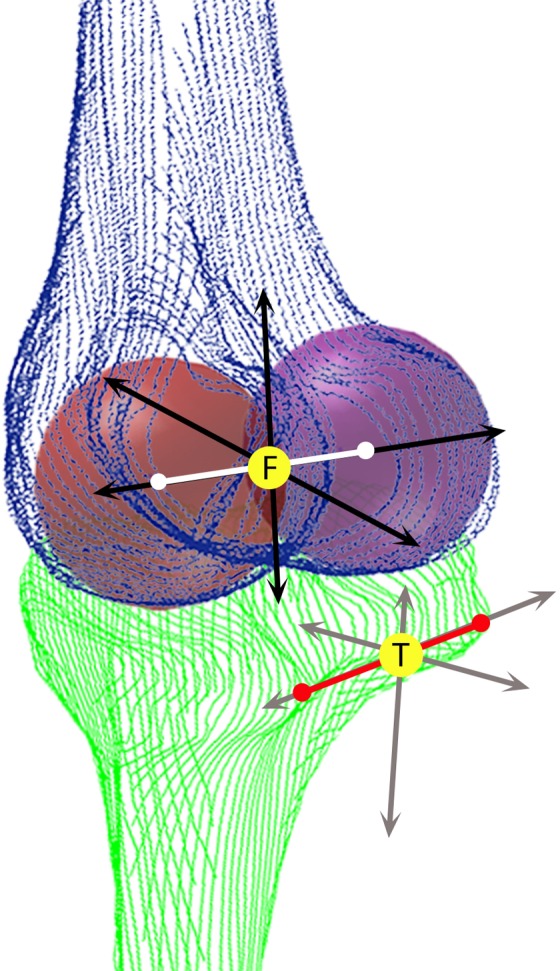
Cloud points from the segmented tibia (T) and femur (F). Two spheres represent the femoral condyles. The red line connects the 2 most posterior ends of the tibia. Arrows indicate coordinate systems; yellow circles indicate tibial and femoral coordinate system origins.
The T1ρ and T2 relaxation times were calculated using methods shown previously.28,31 High-resolution sagittal CUBE images were first rigidly registered onto the first T1ρ-weighted image (TSL = 0) and used for cartilage segmentation. Using a semiautomatic edge-based strategy, 6 compartments were identified (Figure 2): medial femoral condyle (MF), medial tibia (MT), lateral femoral condyle (LF), lateral tibia (LT), patella (P), and trochlea (TrF). These compartments were further divided into 14 subcompartments that were defined by the edges of the menisci, with each subcompartment demonstrating different load-bearing conditions. Cartilage regions of interest (ROIs) were used to constrain piecewise rigid registration along the different T1ρ-weighted and T2-weighted images. Additionally, all T1ρ and T2 echoes of the contralateral and follow-up images were nonrigidly registered to the first T1ρ echo sequence of the injured knee using an intensity-based method that was implemented using an elastix ITK library (Open Source Initiative).22,42 This process was performed to ensure that the same anatomical regions of cartilage were compared during analysis. T1ρ and T2 relaxation times were determined with a pixel-by-pixel, 2-parameter monoexponential fitting curve. The T1ρ and T2 values of each compartment were computed as the mean of all pixels belonging to the ROI.
Figure 2.

(A) Lateral side compartments (lateral femoral condyle [LF], lateral tibia [LT]) and subcompartments, patella (P), and trochlea (TrF). (B) Medial side compartments (medial femoral condyle [MF], medial tibia [MT]) and subcompartments. a, anterior; c, central; p, posterior.
Statistical Analysis
Statistical analysis was performed using SPSS v22 (IBM). Independent t tests were used to compare demographics between ACL subjects and controls. For biomechanics, only extended knees were analyzed. Paired t tests were performed between the biomechanics (ie, TP or ITR) of the injured and contralateral sides at each time point. Individual t tests were used to determine any differences in TP and ITR between allografts and autografts. Associations between TP, ITR, and FA SSD were determined with bivariate correlations using the Pearson coefficient. To compare the biomechanics between the ACL cohort and the control group, SSD in TP and ITR were compared using analysis of covariance (ANCOVA), with FA SSD as a covariate. A linear mixed model with Bonferroni correction was used for repeated measures analysis to compare SSD in biomechanics at each time point while controlling for FA. General estimating equation (GEE) was used to determine the associations between biomechanical measures and age, body mass index (BMI), sex, sides, and time points. Hierarchical linear regression was used to determine the correlation between biomechanics and T1ρ and T2 relaxation times, controlling for age, sex, and BMI at each time point. To account for the effects of activity level on cartilage relaxation times,24 the Marx Activity Rating Scale was chosen to be included in this model at 1 year since this corresponds to a time when patients are likely returning to their normal activity and sports. Hierarchical regression was also used to determine if 6-month biomechanics could predict T1ρ and T2 relaxation times at 1 year. Seven regions (global [g] MF, posterior [p] MF, central [c] LF-c, cLF-p, gMT, pMT, and pLT) were chosen for regression analysis based on their potential roles in demonstrating injury severity or initiating early cartilage degeneration.
Results
Patient Demographics
There was no significant difference between the ACL cohort and the controls in age, sex ratio, or BMI.
Surveys
Table 2 depicts the average KOOS scores at each follow-up.
TABLE 2.
KOOS Scores at Each Time Pointa
| KOOS Score | |||||
|---|---|---|---|---|---|
| Pain | Symptoms | ADL | Sports | QoL | |
| Baseline | 74.66 ± 18.0 | 69.10 ± 19.1 | 81.59 ± 18.3 | 56.22 ± 28.5 | 42.00 ± 25.4 |
| 6 mo | 84.22 ± 12.3 | 74.68 ± 14.8 | 92.41 ± 9.3 | 69.09 ± 20.7 | 52.00 ± 20.1 |
| 1 y | 87.2 ± 10.8 | 80.40 ± 13.0 | 94.73 ± 6.8 | 77.93 ± 18.1 | 62.35 ± 19.8 |
aData are reported as mean ± SD. ADL, activities of daily living; KOOS, Knee injury and Osteoarthritis Outcome Score; QoL, quality of life.
Tibiofemoral Alignment (Anteroposterior Direction)
For the control cohort, 17 of the initial 19 returned for their 1-year follow-up. The controls demonstrated no significant differences in tibia position (TP), internal tibial rotation (ITR), and flexion angle (FA) between the 2 sides at baseline and 1 year. There were significant correlations between TP SSD and ITR SSD (R = 0.530, P = .029), between TP SSD and FA SSD (R = 0.569, P = .017), and between ITR SSD and FA SSD (R = 0.819, P < .001) at 1 year only. For longitudinal analysis, the average biomechanical measures between right and left knees for each subject were calculated first, then comparisons were made between baseline and 1-year values after controlling for FA. No significance was noted in either TP or ITR between baseline and 1 year.
In the injured cohort, TP was significantly more anterior on the injured side compared with the contralateral side at all time points (P < .001) (Figure 3A). The injured side had significantly more internal tibial rotation (ITR) than the contralateral side at baseline (P = .033), but no significance was observed at 6 months and 1 year (Figure 3B). There were no significant differences between the FAs of the injured and contralateral sides at all time points. There were significant correlations between TP SSD and ITR SSD (R = 0.409, P = .007) and between ITR SSD and FA SSD (R = 0.32, P = .039) at 1 year only. There were no differences in TP and ITR between allografts and autografts. Comparing to the control cohort, the ACL cohort showed significantly higher SSD in TP at baseline only (P = .001). There was no significant difference between the ACL and control cohorts for ITR SSD (Table 3).
Figure 3.

Mean (A) tibial position and (B) internal tibial rotation for the injured and contralateral sides at each time point. Mean side-to-side difference (SSD) for (C) tibial position and (D) internal tibial rotation at each time point are estimated with flexion angle SSD held at 0.39° and 0.45°, respectively. Error bars = standard error. *P < .05, **P < .001.
TABLE 3.
Tibial Position and Internal Tibial Rotation Side-to-Side Difference Between the ACL and Control Cohortsa
| ACL Cohort | Control Cohort | P | |
|---|---|---|---|
| Baseline | |||
| TP SSD, mm | 1.76 ± 2.0 | 0.05 ± 1.4 | .001* |
| ITR SSD, deg | 0.83 ± 2.7 | 0.11 ± 2.8 | .327 |
| 1 y | |||
| TP SSD, mm | 1.07 ± 1.9 | 0.4 ± 1.5 | .19 |
| ITR SSD, deg | 0.28 ± 3.3 | 0.18 ± 4.1 | .516 |
aData are reported as mean ± SD. Tibial position (TP) side-to-side difference (SSD) was significantly different between the anterior cruciate ligament (ACL) cohort and the controls at baseline. There was no difference in internal tibial rotation (ITR) SSD between the cohorts at either baseline or 1 year. *P < .05.
Of the 42 patients who completed their 1-year visit, a patient who had missing images at 6 months and another who demonstrated large differences in FAs between time points were excluded; thus, a total of 40 patients were evaluated for longitudinal analysis. These patients were confirmed to have intact ACL grafts on their follow-up MRIs and were clinically stable on routine physical examinations. The subluxations were small on MRI examination despite them being persistent under load. A GEE model over the course of all time points showed overall significant difference in TP between the 2 sides (overall 1.5 mm more anterior on injured side, P < .001) and between sexes (overall 2.3 mm more anterior in females, P = .002). The GEE model also showed significant changes in ITR with BMI (overall 0.401 degrees internal rotation with each unit increase in BMI, P = .019). Repeated-measures comparisons for TP SSD, controlled for FA SSD, revealed significant differences between baseline and 6 months (P = .043) and between baseline and 1 year (P = .028) (Figure 3C). The same analysis for ITR revealed a significant difference between baseline and 6 months only (P = .033) (Figure 3D).
Quantitative Magnetic Resonance
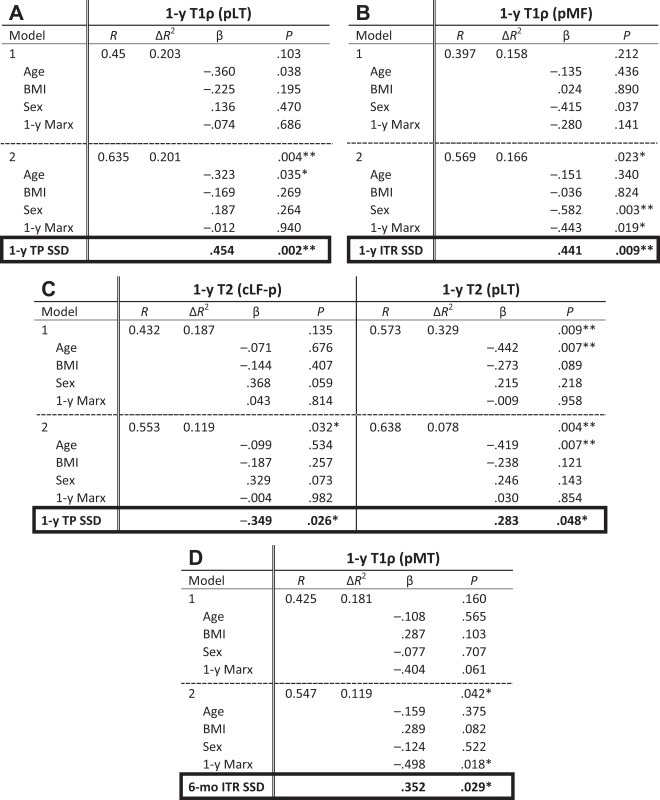
Of the 40 patients who were analyzed longitudinally for biomechanics, 3 patients had qMR sequences that could not be analyzed due to image artifacts, so a total of 37 patients were analyzed using the hierarchical regression model correlating TP SSD and ITR SSD as predictors of T1ρ and T2. The first regression model controlled for age, BMI, sex, and Marx activity scale at 1 year (mean score, 9.4 ± 4.9). TP SSD or ITR SSD was added to the second regression model to measure their effects. Correlation between the biomechanical measures and qMR was present at 1 year only. A more anteriorly translated tibia on the injured side was positively correlated with T1ρ (P = .002) and T2 (P = .048) relaxation times in the pLT and negatively correlated with T2 in the cLF-c (P = .026) (Table 4, A and C; cartilage subcompartment locations referred in Figure 2). A more internally rotated tibia on the injured side was positively correlated with T1ρ in the pMF (P = .009) (Table 4B). In addition, a longitudinal predictive model demonstrated that a more anteriorly translated tibia at 6 months is associated with greater T1ρ in pMT at 1 year (P = .029) (Table 4D). The regression model also showed that age significantly contributed to both T1ρ and T2 changes in the pLT (P = .035 and .007, respectively), while sex contributed significantly to T1ρ changes in the pMF (P = .003), and activity level contributed significantly to T1ρ changes in pMF and pMT (P = .019 and .018, respectively).
TABLE 4.
Hierarchical Regression Controlled for (A) Age, (B) Body Mass Index, (C) Sex, and (D) Marx Activity Scalea
|
aβ = standardized regression coefficient. *P < .05, **P < .01. BMI, body mass index; cLF-p, centrolateral femur, posterior portion; ITR, internal tibial rotation; pLT, posterolateral tibia; pMT, posteromedial tibia; SSD, side-to-side difference; TP, tibia position.
Discussion
Our study demonstrates how altered tibiofemoral biomechanics persist even after ACLR, despite its success indicated by follow-up patient reports and routine physical examinations, and is associated with changes in cartilage matrix composition. This is one of the first studies in which a longitudinal relationship was found between postsurgical biomechanics at 6 months and later cartilage matrix composition at 1 year. This supports the hypothesis that abnormal biomechanics that continue to persist after ACLR begin to accelerate cartilage degeneration immediately afterward and are detected using qMR at 1 year.
The tibia remains more anteriorly translated after ACLR compared with the contralateral side, in contrast to the control cohort, which showed no difference between the 2 sides at either time point. The persistent anterior position observed at 1 year is in contrast with what we reported previously54; however, our present study includes a larger cohort. In addition, high variations in the results were noted in the previous study, likely due to the smaller sized cohort. Our study also showed that there was significant change in TP SSD before and after surgery at both 6 months and 1 year, indicating how surgery is still partially effective in restoring the tibia to its original position. In our GEE model, females were noted to have greater anterior translation, but this is likely due to their bone size and the method of measuring TP. The distance between the femur and the tibia in the anteroposterior direction would be much shorter in a smaller sized knee (see Figure 1).
ITR between injured and contralateral sides differed significantly at baseline only; therefore, ACLR seems to have restored the rotational component of tibial position. But this effect may be diminishing at 1 year, as ITR SSD approaches a value closer to that at baseline. It is important to note that ITR seems to be affected by FA much more than TP, as shown by the strong correlation in the controls (up to R = 0.835) and moderate correlation in the injured cohort at 1 year. Many of the baseline images, which were some of the first scans acquired in this study, excluded most of the tibial shaft, making FA measurements difficult; this is a likely explanation for why such strong correlations were seen at 1 year only. Nevertheless, such notable correlations seen in both controls and reconstructed knees suggest that small differences in FA, despite being in the “extended” position, influence ITR. Our repeated-measures analysis, which statistically controlled for FA SSD, still showed significant differences between baseline and 6-month ITR SSD, again suggesting the effectiveness of surgery, at least in the short-term postoperative period. Despite these biomechanical alterations, patients generally report better stability after surgery.52 It is possible that these alterations are subclinical. KOOS scores recorded for this study were comparable to studies that use patient reports as outcome measures (see Table 2),13 and according to a recent study by Ingelsrud et al,20 73% to 98% of our patients would fall in the “acceptable” or “undecided” ranges at 1 year, indicating that the majority of these surgeries had satisfactory outcomes. In addition, TP SSD measurements found in this study were usually less than 5 mm, which may give a normal Lachman test. However, our results show that these measurements are still large enough to contribute to cartilage degeneration.
The correlations between biomechanical measures and qMR at 1 year support this hypothesis that small biomechanical alterations affect cartilage health after ACLR. These correlations were only at observed at 1 year, suggesting that these associations are likely related to future long-term outcomes and less likely to be related to acute changes that may be present due to the insult from the injury and surgery themselves. Correlation between TP SSD and T1ρ SSD in the pMF compartment has been reported previously.54 In this study, we used a hierarchical regression model to control for factors that have been shown to affect T1ρ and T2, where T1ρ is indicative of proteoglycan content and more sensitive to cartilage integrity, as opposed to T2, which is more susceptible to water content and may not be able to differentiate between edema and matrix degradation. Age, BMI, sex, and activity level have been shown to increase T1ρ and T2,14,17,21,24 and this is reflected in our model. Interestingly, activity level seemed to only affect the medial compartments in the injured knee, providing potential insight into the relationship between activity and abnormal medial-sided loading after ACLR.
Changes in cartilage matrix composition due to changes in biomechanics were reflected in several compartments. Greater T1ρ and T2 relaxation times in the pLT with more anteriorly translated tibias are likely due to impact of the initial injury followed by the continued stress on the posterior aspect of the tibia as its contact with the femur is shifted posteriorly (Figure 4, left). Elevated T1ρ in the pMF with increased ITR may be reflective of the alterations that occur during flexion, since this region is nonweightbearing in extension. In addition to these cross-sectional correlations at 1 year, increased ITR at 6 months is also associated with greater T1ρ in the pMT. This at first seems counterintuitive since increased ITR alone would offload the pMT, but we found ITR and TP to be significantly correlated at 1 year; therefore, the accompanying anterior TP may still be shifting the load posteriorly, causing increase in that region (Figure 4). These elevations in the medial side may be a factor in the high rate of medial compartment OA seen after ACL injuries.1,6
Figure 4.

Schematic illustrating the possible change in loading pattern with an anteriorly translated tibia (left) and internally rotated tibia (right). The orange areas, which did not bear load in the normal knee, bear load when biomechanics are altered. L, lateral; M, medial.
Conversely, T2 in the cLF-p showed negative correlation with an anteriorly translated tibia. We speculate a few possible reasons for this unexpected observation. First, increased loading in the medial compartments may off-load parts of the lateral compartments, which is similar to what is seen in varus knees and associated with medial compartment OA.43 Another explanation may be the chondrocyte response to loading by increasing matrix protein synthesis.2,40,49 Our data may only be a snapshot of some of the earliest responses to abnormal loading. The 2- and 3-year data from the same cohort are currently being collected and will provide a more comprehensive narrative on the early changes in cartilage matrix that occur before PTOA.
There are a number of limitations to this study. First, in our biomechanics calculations, the use of 2 spheres to estimate condyle positions may result in errors in femoral position. However, the impact of this error is limited by fitting the same spheres onto the subsequent knees from the same patient, enabling direct comparison between time points and sides. The calculations may also not account for differing bone sizes between patients, but we found no difference in our results when the TP measurements were adjusted for size, sex, or BMI. Second, to acquire images of high quality, weightbearing status was created artificially in the supine position with the knee extended and may not be completely reflective of functional tasks. Analyzing the knee in flexion may provide more information on its biomechanics; however, when attempting to acquire images in the flexed position, we found difficulty in maintaining the same flexion angle for all subjects across all time points. Since flexion angle can affect TP and ITR, this was thought to introduce too much variation for our analysis, and therefore, only the extended knees were used for this study. For qMR calculations, the division of subcompartments was based on meniscus location, which can be flexible. To address this, only larger subcompartments unaffected by small shifts in meniscal position were selected for analysis. Our analyses also only include results up to 1 year postreconstruction, while PTOA may take years to develop. But because diagnosis of OA occurs much later into the disease, observing changes before disease manifestation is more appropriate for our purpose of detecting subtle matrix changes in cartilage. Lastly, to improve comparisons with the control cohort, collecting data on preinjury activity levels would allow improved analyses that consider the effects of activity on cartilage composition. Furthermore, our sample size is modest, and future studies with larger sample sizes are warranted to confirm the findings.
Our current study focuses on tibiofemoral biomechanics after ACLR, a potential factor in the development of PTOA in the setting of ACL injury. Our methodology allows detection of small changes that are undetectable by physical examination and the naked eye and provides great insight into the early changes in cartilage degeneration in vivo. Our findings suggest that surgery only partially restores tibiofemoral biomechanics, and the remaining alterations are related to cartilage matrix changes seen as early as 1 year postreconstruction. This information, along with 2- and 3-year follow-up data, could point to specific biomechanical factors that lead to cartilage degeneration, which could present opportunities to enhance surgical techniques and modify rehabilitation protocols to prevent PTOA.
Acknowledgment
The authors acknowledge the following individuals for their help in the study: Daniel Wu (MRI acquisition); Jonathan Ochoa and Faustine Dufka (MRI segmentations); Drew Lansdown, MD, and Musa Zaid, MD (background information from their previous studies, MRI segmentations); Sharon Teng, PhD; and Charles McCulloch, PhD (statistics topics).
Footnotes
One or more of the authors has declared the following potential conflict of interest or source of funding: This research was supported by the NIH (P50 AR060752) and the AOSSM Cartilage Initiative.
References
- 1. Ahn JH, Kim JG, Wang JH, Jung CH, Lim HC. Long-term results of anterior cruciate ligament reconstruction using bone-patellar tendon-bone: an analysis of the factors affecting the development of osteoarthritis. Arthroscopy. 2012;28:1114–1123. [DOI] [PubMed] [Google Scholar]
- 2. Aigner T, Zien A, Gehrsitz A, Gebhard PM, McKenna L. Anabolic and catabolic gene expression pattern analysis in normal versus osteoarthritic cartilage using complementary DNA-array technology. Arthritis Rheum. 2001;44:2777–2789. [DOI] [PubMed] [Google Scholar]
- 3. Akella SV, Regatte RR, Gougoutas AJ, et al. Proteoglycan-induced changes in T1rho-relaxation of articular cartilage at 4T. Magn Reson Med. 2001;46:419–423. [DOI] [PubMed] [Google Scholar]
- 4. Andriacchi TP, Mündermann A. The role of ambulatory mechanics in the initiation and progression of knee osteoarthritis. Curr Opin Rheumatol. 2006;18:514–518. [DOI] [PubMed] [Google Scholar]
- 5. Andriacchi TP, Mündermann A, Smith RL, Alexander EJ, Dyrby CO, Koo S. A framework for the in vivo pathomechanics of osteoarthritis at the knee. Ann Biomed Eng. 2004;32:447–457. [DOI] [PubMed] [Google Scholar]
- 6. Barenius B, Ponzer S, Shalabi A, Bujak R, Norlén L, Eriksson K. Increased risk of osteoarthritis after anterior cruciate ligament reconstruction: a 14-year follow-up study of a randomized controlled trial. Am J Sports Med. 2014;42:1049–1057. [DOI] [PubMed] [Google Scholar]
- 7. Carballido-Gamio J, Bauer J, Lee K-Y, Krause S, Majumdar S. Combined image processing techniques for characterization of MRI cartilage of the knee. Conf Proc Annu Int Conf IEEE Eng Med Biol Soc. 2005;3:3043–3046. [DOI] [PubMed] [Google Scholar]
- 8. Carballido-Gamio J, Bauer JS, Stahl R, et al. Inter-subject comparison of MRI knee cartilage thickness. Med Image Anal. 2008;12:120–135. [DOI] [PMC free article] [PubMed] [Google Scholar]
- 9. Carpenter RD, Majumdar S, Ma CB. Magnetic resonance imaging of 3-dimensional in vivo tibiofemoral kinematics in anterior cruciate ligament-reconstructed knees. Arthroscopy. 2009;25:760–766. [DOI] [PubMed] [Google Scholar]
- 10. Chalmers PN, Mall NA, Moric M, et al. Does ACL reconstruction alter natural history? A systematic literature review of long-term outcomes. J Bone Joint Surg. 2014;96:292–300. [DOI] [PubMed] [Google Scholar]
- 11. Chu C, Millis M, Olson S. Osteoarthritis: from palliation to prevention: an AOA critical issues. J Bone Joint Surg Am. 2014;96:e130. [DOI] [PMC free article] [PubMed] [Google Scholar]
- 12. Dare D, Rodeo S. Mechanisms of post-traumatic osteoarthritis after ACL injury. Curr Rheumatol Rep. 2014;16:448. [DOI] [PubMed] [Google Scholar]
- 13. Filbay SR, Ackerman IN, Russell TG, Macri EM, Crossley KM. Health-related quality of life after anterior cruciate ligament reconstruction: a systematic review. Am J Sports Med. 2014;42:1247–1255. [DOI] [PubMed] [Google Scholar]
- 14. Goto H, Iwama Y, Fujii M, et al. A preliminary study of the T1rho values of normal knee cartilage using 3T-MRI. Eur J Radiol. 2012;81:e796–e803. [DOI] [PubMed] [Google Scholar]
- 15. Haughom B, Schairer W, Souza RB, Carpenter D, Ma CB, Li X. Abnormal tibiofemoral kinematics following ACL reconstruction are associated with early cartilage matrix degeneration measured by MRI T1rho. Knee. 2012;19:482–487. [DOI] [PMC free article] [PubMed] [Google Scholar]
- 16. Heijink A, Gomoll AH, Madry H, et al. Biomechanical considerations in the pathogenesis of osteoarthritis of the knee. Knee Surg Sport Traumatol Arthrosc. 2012;20:423–435. [DOI] [PMC free article] [PubMed] [Google Scholar]
- 17. Holmberg S, Thelin A, Thelin N. Knee osteoarthritis and body mass index: a population-based case-control study. Scand J Rheumatol. 2005;34:59–64. [DOI] [PubMed] [Google Scholar]
- 18. Hoshino Y, Fu FH, Irrgang JJ, Tashman S. Can joint contact dynamics be restored by anterior cruciate ligament reconstruction? Clin Orthop Relat Res. 2013;471:2924–2931. [DOI] [PMC free article] [PubMed] [Google Scholar]
- 19. Imbert P, Belvedere C, Leardini A. Human knee laxity in ACL-deficient and physiological contralateral joints: intra-operative measurements using a navigation system. Biomed Eng Online. 2014;13:86. [DOI] [PMC free article] [PubMed] [Google Scholar]
- 20. Ingelsrud LH, Granan L-P, Terwee CB, Engebretsen L, Roos EM. Proportion of patients reporting acceptable symptoms or treatment failure and their associated KOOS values at 6 to 24 months after anterior cruciate ligament reconstruction: a study from the Norwegian Knee Ligament Registry. Am J Sports Med. 2015;43:1902–1907. [DOI] [PubMed] [Google Scholar]
- 21. Jiang L, Tian W, Wang Y, et al. Body mass index and susceptibility to knee osteoarthritis: a systematic review and meta-analysis. Joint Bone Spine. 2012;79:291–297. [DOI] [PubMed] [Google Scholar]
- 22. Klein S, Staring M, Murphy K, Viergever MA, Pluim JP. Elastix: a toolbox for intensity-based medical image registration. IEEE Trans Med Imaging. 2010;29:196–205. [DOI] [PubMed] [Google Scholar]
- 23. Kothari A, Haughom B, Subburaj K, Feeley B, Li X, Ma CB. Evaluating rotational kinematics of the knee in ACL reconstructed patients using 3.0 tesla magnetic resonance imaging. Knee. 2012;19:648–651. [DOI] [PMC free article] [PubMed] [Google Scholar]
- 24. Kumar D, Souza RB, Singh J, et al. Physical activity and spatial differences in medial knee T1rho and t2 relaxation times in knee osteoarthritis. J Orthop Sports Phys Ther. 2014;44:964–972. [DOI] [PMC free article] [PubMed] [Google Scholar]
- 25. Lansdown DA, Zaid M, Pedoia V, et al. Reproducibility measurements of three methods for calculating in vivo MR-based knee kinematics. J Magn Reson Imaging. 2015;42:533–538. [DOI] [PMC free article] [PubMed] [Google Scholar]
- 26. Li G, DeFrate L. In vivo kinematics of the ACL during weight bearing knee flexion. J Orthop Res. 2005;23:340–344. [DOI] [PubMed] [Google Scholar]
- 27. Li X, Cheng J, Lin K, et al. Quantitative MRI using T1ρ and T2 in human osteoarthritic cartilage specimens: correlation with biochemical measurements and histology. Magn Reson Imaging. 2011;29:324–334. [DOI] [PMC free article] [PubMed] [Google Scholar]
- 28. Li X, Han ET, Busse RF, Majumdar S. In vivo T(1rho) mapping in cartilage using 3D magnetization-prepared angle-modulated partitioned k-space spoiled gradient echo snapshots (3D MAPSS). Magn Reson Med. 2008;59:298–307. [DOI] [PMC free article] [PubMed] [Google Scholar]
- 29. Li X, Kuo D, Theologis A, et al. Cartilage in anterior cruciate ligament-reconstructed knees: MR imaging T1ρ and T2—initial experience with 1-year follow-up. Radiology. 2011;258:505–514. [DOI] [PMC free article] [PubMed] [Google Scholar]
- 30. Li X, Ma CB, Link TM, et al. In vivo T1rho and T2 mapping of articular cartilage in osteoarthritis of the knee using 3 T MRI. Osteoarthritis Cartilage. 2007;15:789–797. [DOI] [PMC free article] [PubMed] [Google Scholar]
- 31. Li X, Pedoia V, Kumar D, et al. Cartilage T1ρ and T2 relaxation times: longitudinal reproducibility and variations using different coils, MR systems and sites. Osteoarthritis Cartilage. 2015;23:2214–2223. [DOI] [PMC free article] [PubMed] [Google Scholar]
- 32. Lohmander LS, Ostenberg A, Englund M, Roos H. High prevalence of knee osteoarthritis, pain, and functional limitations in female soccer players twelve years after anterior cruciate ligament injury. Arthritis Rheum. 2004;50:3145–3152. [DOI] [PubMed] [Google Scholar]
- 33. Lozano J, Li X, Link TM, Safran MR, Majumdar S, Ma CB. Detection of posttraumatic cartilage injury using magnetic resonance imaging. J Bone Joint Surg. 2006;88-A:1349–1352. [DOI] [PubMed] [Google Scholar]
- 34. Mall NA, Chalmers PN, Moric M, et al. Incidence and trends of anterior cruciate ligament reconstruction in the United States. Am J Sports Med. 2014;42:2363–2370. [DOI] [PubMed] [Google Scholar]
- 35. Nieminen MT, Töyräs J, Rieppo J, et al. Quantitative MR microscopy of enzymatically degraded articular cartilage. Magn Reson Med. 2000;43:676–681. [DOI] [PubMed] [Google Scholar]
- 36. Nishioka H, Hirose J, Nakamura E, et al. T1ρ and T2 mapping reveal the in vivo extracellular matrix of articular cartilage. J Magn Reson Imaging. 2012;35:147–155. [DOI] [PubMed] [Google Scholar]
- 37. Oberländer KD, Brüggemann GP, Höher J, Karamanidis K. Knee mechanics during landing in anterior cruciate ligament patients: a longitudinal study from pre- to 12 months post-reconstruction. Clin Biomech (Bristol, Avon). 2014;29:512–517. [DOI] [PubMed] [Google Scholar]
- 38. Ramski DE, Kanj WW, Franklin CC, Baldwin KD, Ganley TJ. Anterior cruciate ligament tears in children and adolescents: a meta-analysis of nonoperative versus operative treatment. Am J Sports Med. 2014;42:2769–2776. [DOI] [PubMed] [Google Scholar]
- 39. Rusinkiewicz S, Levoy M. Efficient variants of the ICP algorithm In: International Conference on 3-D Digital Imaging and Modeling. 2001;2001:145–152. http://docs.happycoders.org/orgadoc/graphics/imaging/fasticp_paper.pdf. Accessed August 11, 2015. [Google Scholar]
- 40. Saadat E, Lan H, Majumdar S, Rempel DM, King KB. Long-term cyclical in vivo loading increases cartilage proteoglycan content in a spatially specific manner: an infrared microspectroscopic imaging and polarized light microscopy study. Arthritis Res Ther. 2006;8:R147. [DOI] [PMC free article] [PubMed] [Google Scholar]
- 41. Seon JK, Song EK, Park SJ. Osteoarthritis after anterior cruciate ligament reconstruction using a patellar tendon autograft. Int Orthop. 2006;30:94–98. [DOI] [PMC free article] [PubMed] [Google Scholar]
- 42. Shamonin DP, Bron EE, Lelieveldt BPF, Smits M, Klein S, Staring M. Fast parallel image registration on CPU and GPU for diagnostic classification of Alzheimer’s disease. Front Neuroinform. 2013;7:50. [DOI] [PMC free article] [PubMed] [Google Scholar]
- 43. Sharma L. The role of varus and valgus alignment in knee osteoarthritis. Arthritis Rheum. 2007;56:1044–1047. [DOI] [PubMed] [Google Scholar]
- 44. Shefelbine SJ, Ma CB, Lee K-Y, et al. MRI analysis of in vivo meniscal and tibiofemoral kinematics in ACL-deficient and normal knees. J Orthop Res. 2006;24:1208–1217. [DOI] [PubMed] [Google Scholar]
- 45. Smith TO, Postle K, Penny F, McNamara I, Mann CJV. Is reconstruction the best management strategy for anterior cruciate ligament rupture? A systematic review and meta-analysis comparing anterior cruciate ligament reconstruction versus non-operative treatment. Knee. 2014;21:462–470. [DOI] [PubMed] [Google Scholar]
- 46. Stergiou N, Ristanis S, Moraiti C, Georgoulis AD. Tibial rotation in anterior cruciate ligament (ACL)-deficient and ACL-reconstructed knees: a theoretical proposition for the development of osteoarthritis. Sport Med. 2007;37:601–613. [DOI] [PubMed] [Google Scholar]
- 47. Stiebel M, Miller LE, Block JE. Post-traumatic knee osteoarthritis in the young patient: therapeutic dilemmas and emerging technologies. Open Access J Sports Med. 2014;5:73–79. [DOI] [PMC free article] [PubMed] [Google Scholar]
- 48. Su F, Hilton JF, Nardo L, et al. Cartilage morphology and T1ρ and T2 quantification in ACL-reconstructed knees: a 2-year follow-up. Osteoarthritis Cartilage. 2013;21:1058–1067. [DOI] [PMC free article] [PubMed] [Google Scholar]
- 49. Swoboda B, Pullig O, Kirsch T, Kladny B, Steinhäuser B, Weseloh G. Increased content of type-VI collagen epitopes in human osteoarthritic cartilage: quantitation by inhibition ELISA. J Orthop Res. 1998;16:96–99. [DOI] [PubMed] [Google Scholar]
- 50. Tashman S, Kolowich P, Collon D, Anderson K, Anderst W. Dynamic function of the ACL-reconstructed knee during running. Clin Orthop Relat Res. 2007;454:66–73. [DOI] [PubMed] [Google Scholar]
- 51. Theologis AA, Kuo D, Cheng J, et al. Evaluation of bone bruises and associated cartilage in anterior cruciate ligament-injured and -reconstructed knees using quantitative T1? magnetic resonance imaging: 1-year cohort study. Arthroscopy. 2011;27:65–76. [DOI] [PMC free article] [PubMed] [Google Scholar]
- 52. Tsoukas D, Fotopoulos V, Basdekis G, Makridis KG. No difference in osteoarthritis after surgical and non-surgical treatment of ACL-injured knees after 10 years [published online April 9, 2015]. Knee Surg Sports Traumatol Arthrosc. doi:10.1007/s00167-015-3593-9. [DOI] [PubMed] [Google Scholar]
- 53. Yoo JC, Ahn JH, Lee SH, Yoon YC. Increasing incidence of medial meniscal tears in nonoperatively treated anterior cruciate ligament insufficiency patients documented by serial magnetic resonance imaging studies. Am J Sports Med. 2009;37:1478–1483. [DOI] [PubMed] [Google Scholar]
- 54. Zaid M, Lansdown D, Su F, et al. Abnormal tibial position is correlated to early degenerative changes one year following ACL reconstruction. J Orthop Res. 2015;33:1079–1086. [DOI] [PMC free article] [PubMed] [Google Scholar]