Abstract
Repetitive traumatic brain injury (rTBI) is one of the major risk factors for the abnormal deposition of phosphorylated tau (PT) in the brain and chronic traumatic encephalopathy (CTE). CTE and temporal lobe epilepsy (TLE) affect the limbic system, but no comparative studies on PT distribution in TLE and CTE are available. It is also unclear whether PT pathology results from repeated head hits (rTBI). These gaps prevent a thorough understanding of the pathogenesis and clinical significance of PT, limiting our ability to develop preventative and therapeutic interventions. We quantified PT in TLE and CTE to unveil whether a history of rTBI is a prerequisite for PT accumulation in the brain. Six post mortem CTE (mean 73.3 years) and age matched control samples were compared to 19 surgically resected TLE brain specimens (4 months-58 years; mean 27.6 years). No history of TBI was present in TLE or control; all CTE patients had a history of rTBI. TLE and CTE brain displayed increased levels of PT as revealed by immunohistochemistry. No age-dependent changes were noted, as PT was present as early as 4 months after birth. In TLE and CTE, cortical neurons, perivascular regions around penetrating pial vessels and meninges were immunopositive for PT; white matter tracts also displayed robust expression of extracellular PT organized in bundles parallel to venules. Microscopically, there were extensive tau-immunoreactive neuronal, astrocytic and degenerating neurites throughout the brain. In CTE perivascular tangles were most prominent. Overall, significant differences in staining intensities were found between CTE and control (P<0.01) but not between CTE and TLE (P=0.08). pS199 tau analysis showed that CTE had the most high molecular weight tangle-associated tau, whereas epileptic brain contained low molecular weight tau. Tau deposition may not be specific to rTBI since TLE recapitulated most of the pathological features of CTE.
Keywords: American football, cognitive decline, traumatic brain injury, blood-brain barrier, serum markers
INTRODUCTION
The controversy surrounding the significance of PT in neurological diseases is one of the hottest topics in current neuroscience research. The growing interest in tau can be ascribed to a variety of reasons, not all of them necessarily related to the pathological significance of tau itself. For example, the possibility of an etiologic link between PT and CTE has been popularized by the discovery of phosphorylated tau protein in brain specimens of deceased NFL players as well as in victims of other forms of blast-induced or closed head injury (1;2). The conclusions from many of these studies is that a history of repetitive head impacts is necessary for the deposition of PT and of subsequent neurodegeneration (3;4).
Tau protein is one of the first microtubule associated proteins to be characterized (for review, see (5)). In Homo sapiens, tau is encoded by a single gene, MAPT but six splice variants have been described (6). In the brain, tau stabilizes axonal microtubules but tau’s affinity for microtubules is decreased when tau is phosphorylated. Tau phosphorylation targets three amino acids serine, threonine, and tyrosine; the extent of phosphorylation can have small or major inhibitory effects on the binding of tau to microtubules depending on the number of repeats and the region of the protein. The normal phosphorylation of tau regulates microtubule assembly while its hyperphosphorylation destabilizes microtubules and alters axonal transport. However, tau-deficient mice have no significant phenotypic alterations suggesting that loss of function is not the main trigger of tauopathies (6).
The term “chronic traumatic encephalopathy” describes the neurodegenerative disease in athletes with histories of repeated head injuries and their sequelae (7). CTE is considered a tauopathy with phosphorylated tau-positive deposits in characteristic locations. Although a connection between repetitive head trauma and CTE has been proposed, a causal role of pathological tau deposition has not yet been shown. Many athletes with rTBI never develop CTE while on the other hand pathologies other than CTE, especially seizures, have been shown to be characterized by PT in neurons of affected individuals (7–10). These observations call into question the etiologic role of rTBI in the genesis of PT deposition. An important caveat of all these studies is the fact that most if not all specimens derived from post mortem brain. This was true for samples from football players, blast TBI patients or epileptic subjects (3;9;10). Since a post mortem analysis is required for the evaluation of brain phosphorylated tau in CTE, a positive correlation with a given pathology has been difficult. Finally, limited evidence suggests that poorly controlled or multiple drug resistant seizures may result in PT deposition (8;9). A direct comparison between brain samples from athletes with rTBI and patients with refractory epilepsy is lacking.
The objective of the current study was to determine the specificity of rTBI for PT deposition by comparing the immunohistochemical profile of phosphorylated tau deposits in brain samples from athletes with a history of rTBI and diagnosed with CTE to patients with TLE. We also investigated the presence of specific tau phosphorylation sites in post-traumatic vs. aged or epileptic human brain.
RESULTS
We examined the most typical macro- and microscopic features of temporal lobe epilepsy and CTE in sections of temporal lobes from 6 CTE and 19 epileptic subjects, as summarized in Table 1. We also used temporal lobes from six post mortem control brain specimens. From each brain sample, we used at least 7 sections for a total of 195 stained slices. Of these, most were stained with AT8 or with CP-13; other samples were stained for total tau, IgGs or albumin. In addition, 6 CTE, 2 epileptic and 6 control brain samples were analyzed by Western blotting of frozen brain samples. These were tested with CP13, AT8 and total tau (Tau 5) antibodies. Details on antibodies used are described in the Methods and Supplemental Table 1.
Table 1.
Patients’ demographic properties.
| Patient ID | Reference Number | Age | Gender | Pathology | Comments |
|---|---|---|---|---|---|
| 1 | 127 | 48 | M | TLE | |
| 2 | 139 | 51 | F | TLE | |
| 3 | 141 | 58 | F | TLE | |
| 4 | 142 | 24 | M | TLE | |
| 5 | 144 | 11 | F | TLE | |
| 6 | 146 | 14 | F | TLE | |
| 7 | 153 | 25 | M | TLE | |
| 8 | 170 | 1 | M | Occipital lobe/TLE | |
| 9 | 172 | 28 | F | TLE | |
| 10 | 175 | 4m | F | TLE | |
| 11 | 195 | 39 | M | TLE | |
| 12 | 227 | 45 | F | Frontal/TLE | |
| 13 | 234 | 15 | M | Frontal/TLE | |
| 14 | 240 | 2 | M | TLE | |
| 15 | 189 | 27 | F | TLE | |
| 16 | 213 | 36 | F | TLE | |
| 17 | 252 | 13 | M | TLE | |
| 18 | 254 | 1 | M | TLE | |
| 19 | 261 | 24 | F | TLE | |
| 20 | 6605 | 60–69 | M | Temp ctx. CTE Stage III | Prostrate Cancer |
| 21 | 7748 | 80–89 | M | Temp ctx. CTE Stage IV | Parkinson’s Disease |
| 22 | 8926 | 60–69 | M | Temp ctx. CTE Stage IV | MVA |
| 23 | 9326 | 70–79 | M | Temp ctx. CTE Stage IV | Dementia |
| 24 | 9482 | 90–99 | M | Temp ctx. CTE Stage IV | Dementia |
| 25 | 9990 | 50–59 | M | Temp ctx. CTE Stage IV | Vascular Disease? |
| 26 | 1–0154 | 83 | M | Temp ctx. Control | N/A |
| 27 | 1–0798 | 87 | F | Temp ctx. Control | N/A |
| 28 | 1–1154 | 63 | N/A | Temp ctx. Control | N/A |
| 29 | 1–2127 | 81 | F | Temp ctx. Control | N/A |
| 30 | 1–2656 | 57 | N/A | Temp ctx. Control | N/A |
| 31 | 21047 | 96 | F | Temp ctx. Control | N/A |
The overall appearance of CTE brain samples, when examined en bloc, was otherwise unremarkable and undistinguishable from epileptic brain or controls. CTE and epileptic brain samples were easily identified at the macroscopic level for their intense staining for PT (Figure 1). Most control brain samples, after staining and when observed at low magnification, lacked any readily visible regions suggestive of phosphorylated tau expression. At the microscopic level, several different cellular and histological features were noted in epileptic and CTE brain sections. For clarity, these are presented individually, albeit virtually every section contained many if not all of these pathological signs related to phosphorylated tau expression (see also Figure 7).
Figure 1. Macroscopic and microscopic distribution of phosphorylated tau in CTE, epileptic, and control brain.
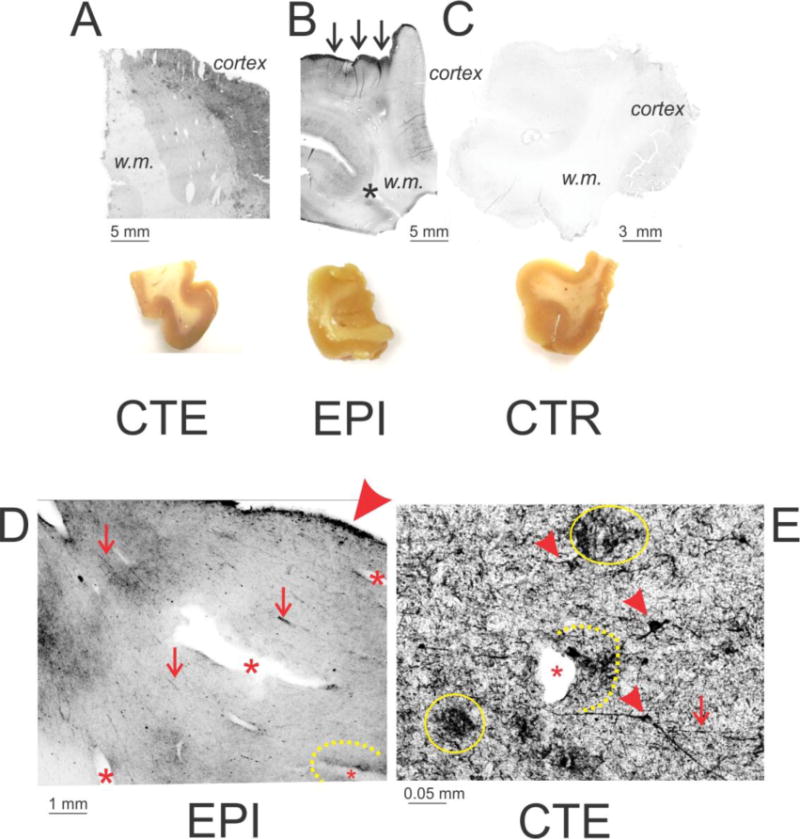
CTE (A; Patient #21; CP-13) and Epileptic (B; Patient #5; AT8 antibody) brain were characterized by widespread presence of PT compared to a control brain sample (C; Patient #31; CP-13). Also note that tau was primarily present in gray matter (cortex). In epileptic brain (but not in CTE, a sharp edge of pial staining was also visible (indicated by arrows). The asterisk in B highlights phosphorylated tau-positive staining at a temporal lobe sulcus (indicated by an asterisk). The brain section images show the morphological appearance of temporal lobe samples used for these experiments. D and E illustrate the most prominent features of pathological tau distribution in epileptic (Patient #8; Pan tau antibody) and CTE (Patient #21; CP-13) brain. The arrowhead in D points to the intense staining of the pial surface, whereas the asterisks in both micrographs highlight blood vessels to emphasize the presence of phosphorylated tau in the perivascular space. The latter is also highlighted by a dotted line. The small arrowheads in E highlight degenerating neurons, whereas the continuous line points to clusters of PT debris. Finally, the arrows in D and E indicate the presence of pathologically appearing axons or axon bundles. w.m. indicates white matter.
Figure 7. Variability of PT expression in pathologic and control temporal lobe samples.
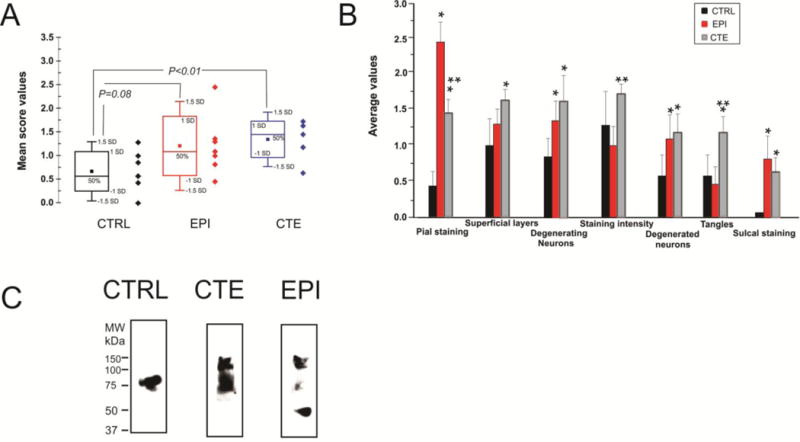
The graphs in A, B refer to a summary and quantification of immunocytochemical analysis. The data in C refer to Western blot analysis of PT phosphorylated at S199 (pS199). Note that CTE and EPI brain samples did not display remarkable differences in PT regardless of whether immunocytochemistry or Western blots were used. See text and discussion. * relates to P<0.05 compared to Control, while ** refers to statistical difference at P<0.05 vs. EPI.
A disease-specific feature seen in epileptic but not in CTE or control brain was sharp and localized staining for PT of the pia mater (arrows in Figures 1 B and D). Note that the overall staining was higher in CTE and epileptic brain and that the staining for PT was preferentially located in gray compared to white matter. Staining for phosphorylated tau was more intense around the sulci of epileptic (or CTE) brains compared to control as indicated by the asterisk in B. Figures D and E summarize the main findings which were common in epileptic (e.g., D) or CTE (e.g., E). Note robust pial staining (as indicated by the large arrowhead in D), perivascular staining (as indicated by asterisks in D and E), axonal varicosities (small arrows in D and E), aberrant neuronal morphology (small arrowheads in E), as well as asymmetric PT deposition around blood vessels (as indicated by the dotted lines in D and E). Also note degenerated neuronal structures (as indicated by yellow circles in E).
Figure 2 shows the microscopic appearance of human epileptic brain samples to highlight common features and differences with comparable sections from CTE brain. Note that the pial surface, as well as the superficial layers of the cortex, were markedly positive for PT (A, B). However, the presence of pial staining occurred even in absence of staining of the superficial cortical layers (B). Also note that the sulcus in this section was heavily stained for phosphorylated tau as indicated by the asterisk in B. The fluorescent microscopy image (C) emphasizes the presence of heavily stained superficial cortical neurons bordering the pial in epileptic brain samples. Figure 2D shows a comparable section from a CTE patient. Note that the density of neurons positively stained for PT was highest in superficial cortical layers. Epilepsy-derived or CTE brain samples were characterized by aggregates of degenerated neurons (as indicated by the black arrowheads in D and I) as well as giant neuronal cells with high levels of PT expression (red arrowheads in G, H, J). In addition, numerous fragments of degenerating neurites were scattered throughout the brain (e.g., yellow arrows in G). The epileptic brain section (E) displayed a remarkable level of PT positive neuronal cell organization in spite of the dysplastic nature of this cortical sample. The micrograph in F shows another example of temporal lobe sulcus positive for PT (as indicated by the asterisk); also note the sharp delineation between grey and white matter (as indicated by the dotted line). Figure 2 (G–J) summarizes the appearance of neurons in epileptic (G, H, I) and CTE (J) brains. Note that neurons in CTE or epileptic brains appeared to have a fusiform/pyramidal shape, spider-like branching and elongated neurites with numerous varicosities.
Figure 2. Neuronal pathology in CTE and epilepsy are highlighted by immuno detection of phosphorylated tau.
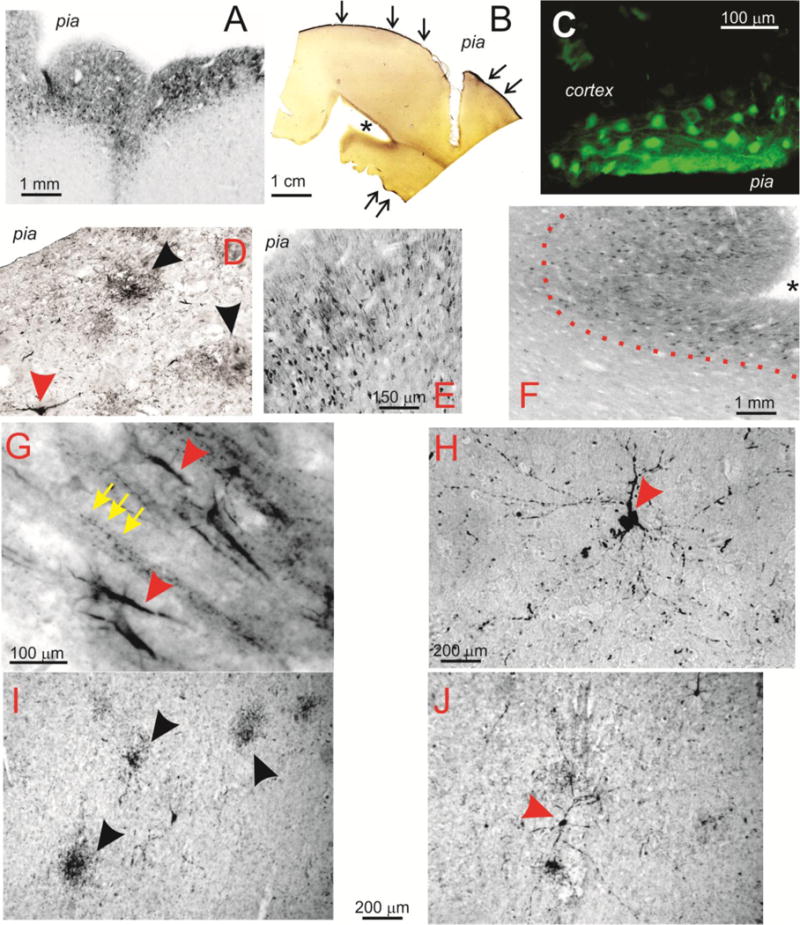
A–C show the distribution of phospho-tau in superficial cortical layers in epileptic brain (A= Patient #5; AT8. B= Patient #9; AT8. C= Patient #3; AT8). The arrows in B show the sharp edge of pial staining typical of epileptic brain samples. The asterisk indicates the abnormal sulcal of phospho-tau. Immunofluorescence revealed heavy staining for PT in epileptic brain. Also note the fine network of neurites and the nuclear staining for tau in some, but not all neurons. The data in D–F show a virtually identical pattern of staining in CTE brain samples (Patient #23; CP-13). The arrows point to degenerating neuronal structures, while the dotted line in F highlights heavy staining for tau in the sulcal region. At higher magnification, additional features of tau-positive neurons become apparent (G–J). Note that, (I, J; Patients 12 and 23; CP-13 and AT8 respectively) and epilepsy (G, H; Patients 5 and 11, AT8) show heavily stained cortical neurons often surrounded by beaded axons (indicated by arrows in G).
Another important feature of CTE brain is the presence of degenerating axons characterized by beading and varicosities due to interrupted or defective axonal transport (11). Analogous features were found in human epileptic brain as shown in Figure 3A–D. Note the filamentous appearance of axonal bundles (indicated by black arrows in A) as well as web-like structures in B. The fluorescent micrograph in C shows these parallel fibers organized over a network of PT -positive neuronal cell bodies. Note that the axonal appearance in CTE was not remarkably different from what was observed in epileptic brain. Also note a solitary axon (E) surrounded by many punctuated PT -positive Figures in the background. “Comparison tissue” from a 99 years old control is shown in F.
Figure 3. Phospho-tau positive axons and neurites in human brain.
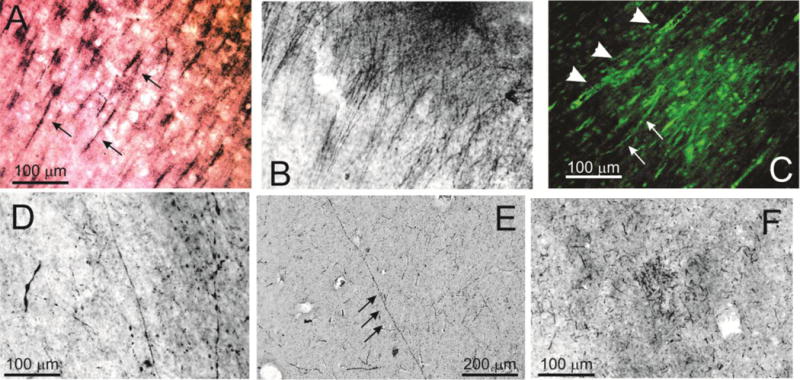
A–D refer to epileptic (Patient 5, A, B; Patient 10, C; Patient 8, D; all stained with AT8), E Control (Patient 31, CP13), and F, CTE (Patient 23, CP-13) brain specimens. Note the widespread filamentous, beaded neurites and axons indicated by arrows and arrowheads in both epileptic and CTE brain. F shows the uncommon appearance of cellular debris in a control brain from a 96 year old post mortem sample.
Figure 4 shows comparable PT -positive perivascular staining in CTE (A–C, CP-13 antibody) and epileptic (D–F, AT8 antibody) brains. Note that there was no discernible difference in PT expression around blood vessels in either pathology. In D, note that in addition to the usual pial and sub-pial staining for PT, a large penetrating pial vessel displayed marked PT staining in the perivascular region which was also characterized by numerous degenerating axons (indicated by black arrows). The micrograph in E shows a small caliber vessel (indicated by the arrowhead) surrounded by PT -positive neurons and bundles of axons (indicated by the yellow arrows). Figure 4F shows comparable perivascular staining also characterized by the presence of normal-appearing, yet PT -positive neurons. Note that the neurons appear to all be organized in a layered formation. Note the increased tau staining (indicated by a yellow arrow) in proximity of the vessel when compared to neurons distal to perivascular region (indicated by an arrow). Also note capillaries (indicated by +), which did not stain for PT, as well as the sharp delineation between grey and white matter (indicated by the dotted line). In order to evaluate the contribution of vascular leakage to the observed staining for phosphorylated tau observed in epileptic and CTE brain, we explored the patterns of serum albumin leakage in analogous brain samples (G). Note that, unlike in the case of PT, serum albumin extravasation was evident primarily around small diameter, most likely capillary, vessels. In addition, and again in contrast to what is seen for PT, albumin extravasation appeared to extend radially from the vascular structure. Figure H shows higher power samples from G, D and F, as indicated by the yellow boxes (see discussion).
Figure 4. Perivascular accumulation of PT is a predominant feature of pathological brain samples.
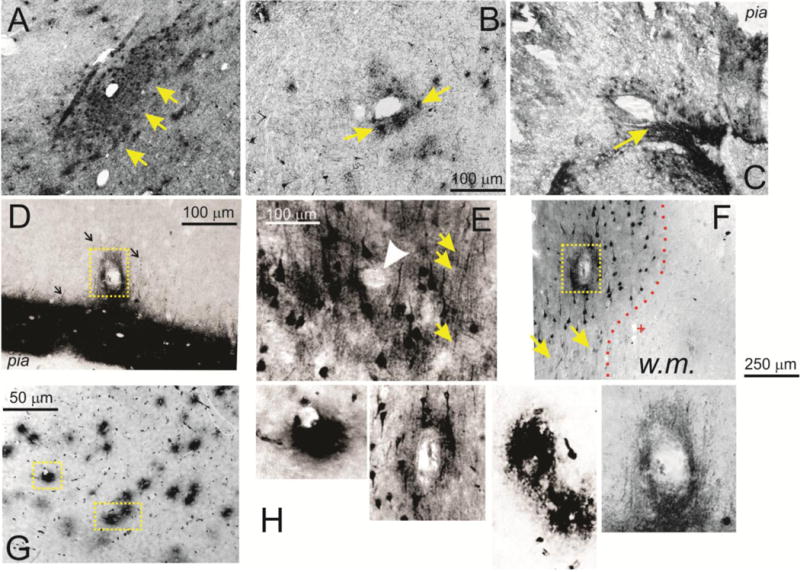
A–C refer to CTE brain (A, B=Patient 21; C= Patient 23; CP-13), while samples from D–F were obtained from epileptic brain (Patients 1, 5, 2 respectively; AT8). Both pathologies revealed pronounced accumulation of PT in the perivascular space, as indicated by the large arrows. Also note that these perivascular regions were also characterized by diffused staining of neurons and axons (e.g., arrows in D and E). The arrowhead in E as well as the dotted squares in D and F highlight the lumen while the (+) in F indicates a capillary vessel negative for PT. The dotted line in F shows the sharp separation between tau-positive gray matter and the underlying white matter which was devoid of tau staining. The micrograph in G shows the distribution of perivascular albumin in epileptic brain (Patient 4). Note that, unlike in the case of phosphorylated tau, extravasated albumin was only present around small caliber, presumably capillary vessels. In contrast, PT was primarily present around large vessels with thin or absent vascular wall. Based on these anatomical properties, these vessels were categorized as venules. H shows magnified portions of the regions indicated by yellow boxes in D, F, G. w.m indicates white matter.
Figure 5 shows yet another example of patterns of perivascular PT accumulation in epileptic brain to emphasize differences in pattern of extravasation with albumin (Figure 4G). Note the longitudinal pattern of phosphorylated tau surrounding a large penetrating vessel (A), as well as the parallel tracks of PT -positive signal around white matter vessels (B and C). Vessels are indicated by arrowheads, whereas the tracks are indicated by arrows. Note that the sample taken from epileptic brain (B) is virtually indistinguishable from the sample obtained from CTE brain (C). The (+) refers to neighboring, yet PT -negative, blood vessels.
Figure 5. Evidence for peri-and para vascular accumulation of PT in epileptic brain.
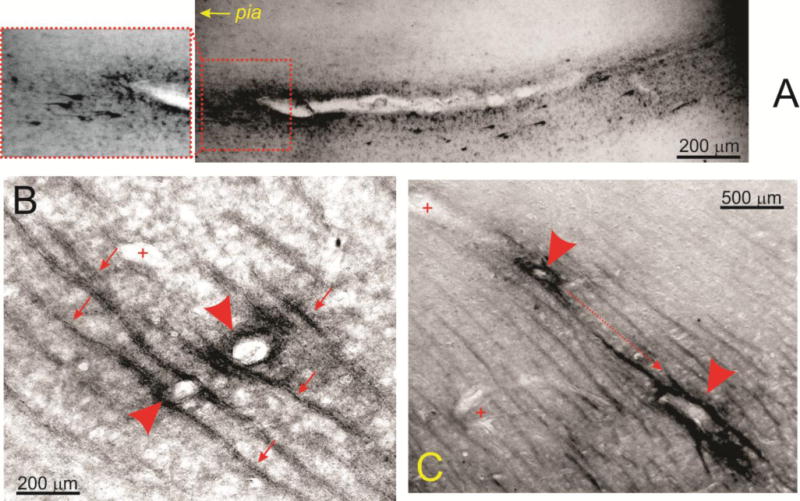
The micrograph in A (Patient 2, AT8) shows the asymmetric distribution of PT around a penetrating venule which was defined as such by the lack of a distinct vascular smooth muscle layer. Note that both extracellular and neuronal tau was detected and the apparent gradient of tau accumulation from the parenchyma to the pial surface. The data in B and C (Patient 7, AT8) further highlight the unusual pattern of phospho-tau distribution in white matter. Note that, the signal was organized in parallel tracks indicated by small arrows, while arrowheads point to tau-positive vessels. (+) indicates tau-negative small caliber capillaries. The dotted line in C shows the apparent direction of tau accumulation from deeper white matter tracks towards the surface of the brain.
Another common feature in CTE and epileptic brain was the presence of degenerating neurons (Figure 6). These were seen in virtually every section analyzed, including a 96 years old control. Note the widespread display of neuronal degeneration in a CTE brain (A) as well as a degenerating neuron in a temporal lobe epilepsy sample (E). In addition to regions of numerous degenerating cells, we also noted isolated complexes consisting of dying neurons in the proximity of blood vessels (as indicated by an asterisk in B); the perivascular space was remarkably loaded with PT -positive debris. Also note the presence of degenerating axons and dendrites (as indicated by arrows in B). The relationship between degenerating neurons and vasculature is further seen in C, where a penetrating pial vessel (as indicated by an asterisk and highlighted by a dotted line) is shown. Note several PT-positive neurons at different levels of degeneration (as indicted by arrows in C) juxtaposed to a vascular profile. However, the presence of degenerating neurons was not an exclusive property of epileptic and CTE brain, since several dying neurons were observed in one control brain (D). These neurons had many of the properties of their epileptic or CTE counterparts, including abnormal dendritic debris (as indicated by the arrows), as well as beaded axons (as indicated by the arrowheads). This abnormal behavior was detected in only 1 out of the 6 control brain samples. Figures 7 A and B show a quantitative summary of the immunohistochemical results. In addition, the levels of tau phosphorylated at pS199 measured by Western blotting are shown (C).
Figure 6. Pathological accumulation of tau in CTE and epilepsy.
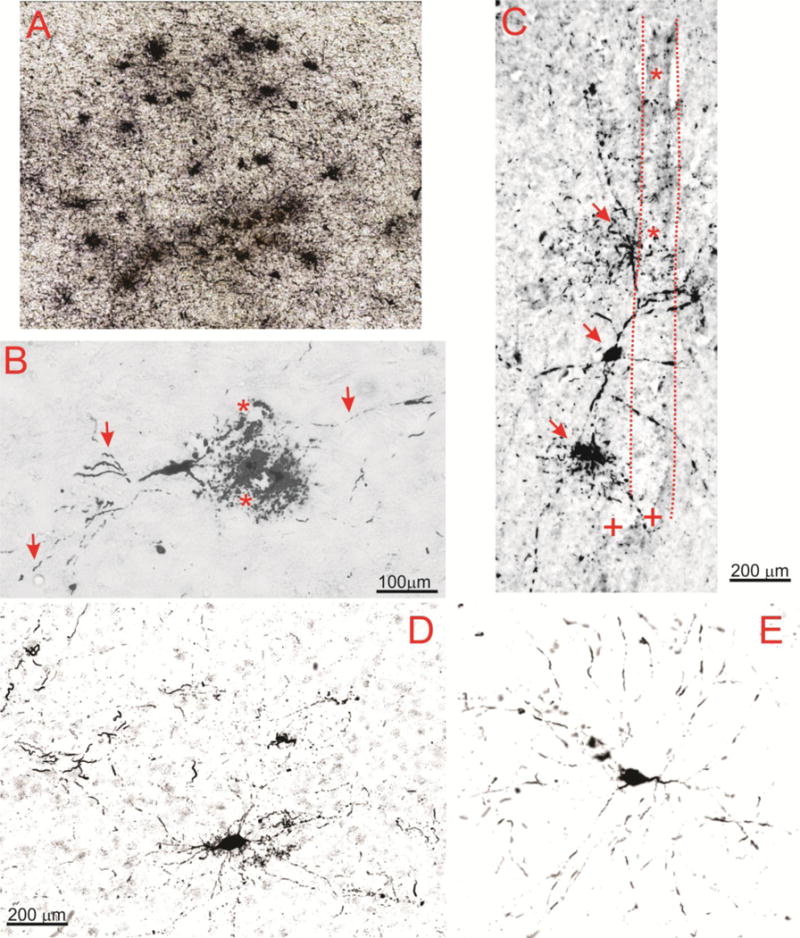
Note the widespread accumulation of tau in neurons in CTE (A; Patient 21, AT8) as well as the perivascular presence of a degenerating neuron in B (Patient 23, CP-13). Highlighted are the lumen of two neighboring vessels (*) as well as axons and degenerating dendrites indicated by arrows. The micrograph in C (Patient 23, AT8) shows another example of the relationship between a vascular structure highlighted by dotted lines and asterisks, and degenerating neurons indicated by arrows. (+) refers to tau negative capillary structures. D and E show a side by side comparison of CTE and epileptic brain to emphasize similar patterns of neuronal phosphorylated tau accumulation in these pathologies (Patients 25 and 11, respectively). Also note that the antibodies used (CP-13 and AT8) did not yield to appreciable differences.
Given the variability in PT expression across samples (large standard errors in Figure 7B) and the unexpected findings related to PT in epileptic and control brain, we measured PT and total tau by an additional technique, namely ELISA to detect specific forms of PT with higher specificity and improved quantitative detection.
Figure 8 shows ELISA outputs reported as tau levels adjusted per mg of total brain protein. Total Tau levels (8A) were lowest in EPI brain and significantly different from levels in CTRL and CTE brain (P<0.01). PT at Thr 231 (8B) and PT at Ser 199 (8D) levels were not statistically different among the three groups while PT at Ser 396 levels (8C) were lowest in CTRL and EPI compared to CTE brain (P<0.05; CTRL vs. CTE). However, no statistical differences in PT at Ser 396 levels were observed between CTE and EPI brains. An additional quantification strategy was used to compare tau levels in these samples. Instead of normalizing the data by total brain protein, we measured levels of various PT forms in concert with ELISA measurements of total tau in the same sample. This procedure allowed to report brain levels of PT as % of total tau. EPI brains displayed the highest percentage of PT per total tau at the three sites measured (Figures 9A–C). The percentage of PT per total tau did not differ between CTE and CTRL brains at any of the three sites. In summary, when analyzing total protein extracts from brain samples, the levels of total tau were lowest in EPI samples, but no differences in PT were found between control, CTE and EPI with the exception of pS396 which was elevated in CTE. When PT levels were analyzed as percent of total tau, however, EPI samples invariably displayed the highest levels (see Methods). We wished to analyze the contribution of Sarkosyl- soluble vs. insoluble tau to the differences reported above. This was achieved by two complementary approaches. We first analyzed the different behaviors of soluble vs. insoluble tau in an ELISA platform. The results in Figure 10 and Supplemental Figure 1D show that epileptic brain samples were characterized by the highest proportion of insoluble tau. However, when these tau forms were analyzed by Western blotting to reveal molecular weights of tau, we discovered that only CTE brain had a significant contribution of high molecular weight tau in insoluble form.
Figure 8. ELISA measurements of Total Tau and PT in CTE, epilepsy, and control samples.
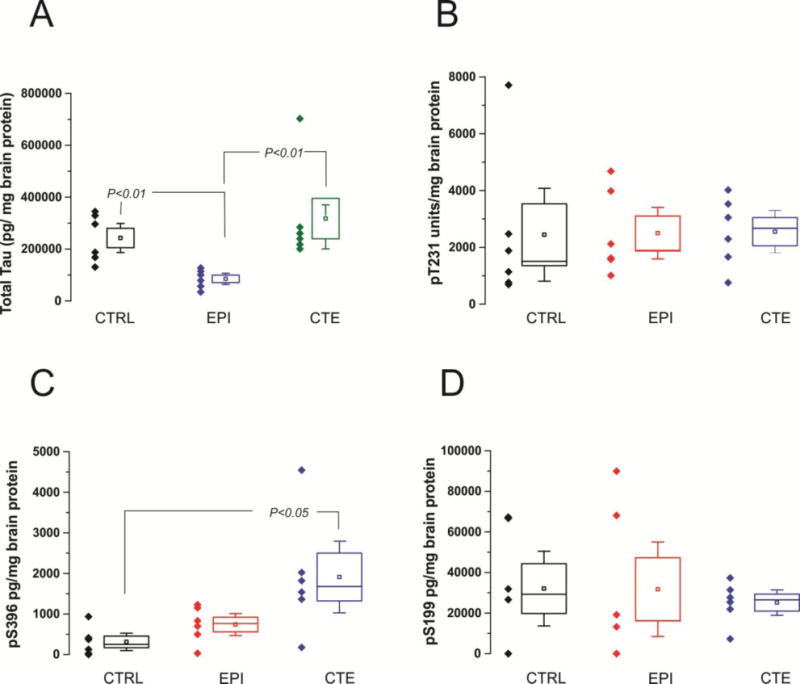
Brain levels of total tau and PT measured by ELISA reported as percent of brain protein. Total Tau levels (8A) in EPI brain were significantly lower compared to control or CTE brain (p<0.01). Total tau levels were not statistically different in CTE CTRL brains. PT at Thr 231 (8B) and PT at Ser 199 (8D) expression was not statistically different among the three groups. PT at Ser 396 levels (8C) in CTRL are significantly lower compared to CTE brain (p<0.05). No differences in PT at Ser 396 levels were observed between CTRL and EPI brains nor between CTE and EPI brains. Statistical significance defined as p<0.05 by ANOVA.
Figure 9. PT levels reported as percent of total Tau in CTE, epilepsy, and control samples.

Brain levels of PT at three different sites measured by ELISA reported as % total tau. EPI brains displayed the highest percentage of PT per total tau at the three sites measured (Figures 9A–C). The percentage of PT per total tau did not differ between CTE and CTRL brains at any of the three sites measured. Statistical significance defined as p<0.05 by ANOVA.
Figure 10. Fractionation of soluble and insoluble tau in control, CTE, and EPI samples.
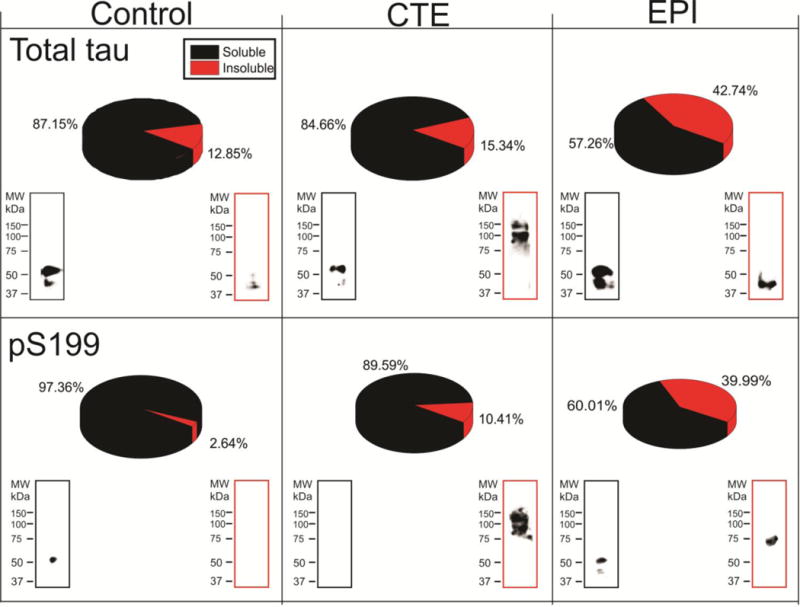
Brain levels of Sarkosyl-soluble and -insoluble total and phospho-tau (pS199) were measured by ELISA (pie chart) and western blots. EPI brains displayed the highest percentage of insoluble tau compared to CTE and control, however total (soluble + insoluble) tau is highest in CTE brains (Figures 7, 8). Western blotting of insoluble tau showed that CTE brain had higher molecular weight tau isoform.
DISCUSSION
The main and perhaps unexpected finding from our study is that brain samples from epileptic brain resections displayed levels and expression patterns of phosphorylated tau comparable to those observed in samples from patients diagnosed post mortem with CTE. Thus, pathological presence of PT is not unique to CTE. In addition, we found that the salient histological as well as phosphorylation site-specific PT features of CTE are also present in patients with temporal lobe epilepsy and in a few “control subjects”. In summary, the overall pattern of phosphorylated tau detected in these tissues did not lend credence to the hypothesis that CTE has a unique PT signature. This conclusion was reached by a convergence of results obtained with a different techniques including PT-specific detection, protein fractionation, ELISA and Western blotting.
CTE and traumatic brain injury
CTE is the modern definition of what used to be referred to as “dementia pugilistica” or “punch drunk syndrome” (7). Not surprisingly, the recent awareness of CTE in American football and other sports as well as the burden of TBI after the return of veterans of two wars has triggered intense media attention and a flurry of clinical and experimental studies. However, the actual number of reports and the overall number of CTE cases described in the literature is remarkably small. This may depend on the fact that a truly operational definition of CTE is currently not available. Tau has been implicated in CTE based on the observations of high levels of phosphorylated tau in post mortem samples of post-TBI patients as well as in an animal model of brain injury (11). From these findings and accompanying clinical series, it appears that other mechanisms apart from repetitive head trauma can lead to phosphorylated tau deposits in a similar pattern.
The post mortem diagnosis of CTE based on positive findings for phosphorylated tau is defined as a “progressive degenerative disease” of the brain found in athletes (and others) with a history of repetitive brain trauma, including symptomatic concussions as well as asymptomatic sub-concussive hits to the head (12). This definition is somewhat inconsistent with findings showing phosphorylated tau in a cohort of epileptic patients (9), or lack of PT in patients with a clinical profile suggestive of CTE (7;10). Our results shed further doubt on the uniqueness of rTBI for the deposition of phosphorylated tau, since comparable profiles of expression were found in non-CTE, epileptic brain samples taken from patients with no history of TBI, including a neonate with refractory seizures. A major question that our study only indirectly address that remains elusive is whether the presence of phosphorylated tau in any brain sample is to be considered a sign of “tauopathy” or simply as a pathological phenomenon underscored by the presence of PT. The issue is not purely semantic, since tauopathy implies an etiologic mechanism for PT, while the converse (tau pathology) suggests an epiphenomenon. Since levels of PT were found in non CTE brain, we may conclude that abnormal levels of PT are not predictors of CTE but rather a finding in brain affected by chronic neurological dysfunction. History of seizures in specimens from epileptic subjects did not correlate with tau expression, as also shown in a previous study (9). However, in contrast to (8), even newborn patients with seizure disorders displayed elevated tau levels.
Molecular fingerprinting of tau and PT in CTE and epilepsy
In normal brain, tau is ubiquitously distributed throughout the CNS, and its phosphorylated form is tightly bound to microtubules. It is therefore possible that upon cell death by mechanisms that cause loss of membrane integrity releasing tau/PT to the extracellular milieu. This may shift the levels of soluble tau-microtubules complexes to the insoluble PT form made of aggregates of axonal debris. Our results suggest that this is the case in epileptic brain. Conversely, in CTE or other neurodegenerative disorders it was shown that insoluble PT is a prototypical component of tangles (for review see (13)). Our results support the following: 1) In epileptic brain, the pathological tau detected in insoluble fractions is mostly of low molecular weight, suggesting that this is not due to tangle formation but rather spillage from dying cells. This is supported by the data in Figure 2I showing neuronal debris stained with tau antibodies, as well as ELISA and Western blot data (Figure 10); 2) In CTE, the insoluble form of tau is of high molecular weight, as predicted by the presence of tangles detected in CTE brain by us and others (11). These results also highlight the only difference we found between CTE and epileptic brain, namely the presence of insoluble tangles in the former and elevated low molecular weight insoluble tau in the latter.
Insoluble and soluble tau were measured by detection of three commonly hyperphosphorylated isoforms (Ser 199, Thr 231 and Ser 396) seen in tauopathies and Alzheimer’s disease (AD). In addition, our immunocytochemical results covered both Ser202 and Ser199 (14). In AD, hyperphosphorylation of Tau results from higher activities of protein kinases, lower activity of protein phosphatases, or a combination of both. In AD a specific phosphoseryl/phosphothreonyl protein phosphatase (PSP), subclass PP-2B, dephosphorylates PT specifically at the three sites we measured by ELISA. It has been suggested that a possible reason for hyperphosphorylation of PT in AD at these sites is due to a deficiency in enzymatic activity. Abnormal tau phosphorylation at Ser396 and Thr 231 contributes to reduced microtubule binding (15;16). Additionally, PT at Thr 231 has been shown to be associated with AD and CTE (17). However, while there is overwhelming support for these abnormal tau phosphorylation events in CTE and AD, our results have shown no major difference in expression of PT isoforms can be found between CTE or EPI samples. This was studied by analyzing: 1) Total expression of pS396, pS199, pS231; 2) Total expression of PT isoforms in soluble or insoluble fractions, by Western blotting and ELISA; 3) The expression of these normalized by levels of total tau.
Are there unique features in CTE brain?
As predicted by the conclusions from McKee’s work (11;18;19), we found in CTE preferential involvement of the superficial cortical layers, irregular, patchy distribution in temporal cortex, propensity for sulcal depths, and prominent perivascular and sub-pial distribution. However, we found a virtually identical pattern in EPI brain. Given that both rTBI and refractory seizures are associated with PT deposition what pathophysiological events do they have in common that might reasonably be expected to result in an abnormal deposition of PT? A “blood-brain barrier hypothesis” whereby tau accumulates in brain due to leakage is not supported by our results (Figure 4G). The axonal injury hypothesis is also not supported by our results since rTBI or head injury were not prerequisites of PT accumulation. We postulate that an abnormal clearance of tau may potentially be the mechanism of PT accumulation in diseased CNS. According to this working hypothesis, regardless of the reasons that initiate the phosphorylation of tau and its release from microtubules, extracellular levels of tau are cleared by the “glymphatic” system as shown for β-amyloid (20;21). According to this mechanism, the presence of elevated levels of tau reflects poor clearance of waste from the brain. This is supported by several observations: 1) There was no co-localization between the extravasation markers albumin or IgGs and perivascular phosphorylated tau; 2) The perivascular accumulation of phosphorylated tau was found around larger (diameter greater than 100 μm) vessels with a poorly delineated vascular wall, or venules, which is what predicted by the glymphatic hypothesis; 3) Perivascular tau did not extend radially from the vessel, as predicted by extravasation, but rather followed extracellular, longitudinal, paravascular tracks; and, 4) Unlike IgGs and albumin (22), phosphorylated tau brain concentrations exceed serum levels, which makes a vascular origin of brain phosphorylated tau highly unlikely.
Limitations and unanswered questions
We report low levels of tau in EPI brain samples (Figure 8A). This can be explained by the widespread cell loss that occurs in the brain when epileptic seizures are poorly controlled, as it is the case with patients who underwent surgery to relieve intractable seizures. However, it has to be underscored that these low tau levels in EPI skewed the results where PT levels are expressed as a percent of total tau (Figure 9). The pathological significance of this finding is yet unknown.
Two final considerations provide additional testable hypotheses on why CTE and EPI appear to share comparable tau levels. First, while we documented the lack of history of head injury in EPI patients, given the intrinsic design of the procurement of CTE samples (post mortem and as gift from Dr. McKee) we cannot rule out that CTE patients were indeed epileptic or suffering from occasional seizures during their life span. This is not implausible given the risk of seizures after traumatic brain injury. In addition, if animal data provide any translational significance, it must be noted that lack of tau in knockout mice decreases seizure propensity while tau overexpression decreased seizure threshold (23). It is conceivable that the data provided herein not only address the epiphenomenal significance of phosphorylated tau in TBI and CTE but actually provide a therapeutic target for multiple drug resistant epileptic seizures. In fact, if tau is seizure-promoting strategies that have been proposed to decrease tau burden in CTE may be beneficial also in seizure disorders.
In conclusion, we have shown that phosphorylated tau is not an exclusive biomarker of neuropathological changes in post-traumatic brain but also a finding in epileptics without a history of rTBI. The possibility that accumulation of tau is a sign of poor CSF dynamics or impaired clearance of protein from diseased limbic cortices may be a fruitful avenue for future research.
METHODS
Patient population-Human subjects
All patients signed an informed consent according to approved institutional review protocols at The Cleveland Clinic Foundation, University of Rochester Medical Center and the Declaration of Helsinki. We compared the immunohistochemical profile of phosphorylated tau deposits in brain samples from athletes with a history of rTBI and CTE to patients with TLE and to healthy controls.
Epilepsy subjects
We analyzed samples of temporal and frontal lobe brain tissue from nineteen patients with epilepsy, age ranges 4 months to 58 years (mean = 27.6 years, 60 % females), with no known history of traumatic brain injuries, and 6 patients with CTE, age ranges 50–99 years (mean 73.3 years, 25 % females) with a documented history of rTBI.
In the case of patients with epilepsy, we only included cases where there was a documented history of drug-refractory epilepsy warranting a neurosurgical resection, which was performed at the Cleveland Clinic. Epilepsy was the primary neurological diagnosis in this cohort and patients where seizures had developed during the course of a neurodegenerative illness, such as Alzheimer’s disease, are not included. As in the study by Thom et al. (9), we studied only severe cases of epilepsy, but in contrast to the same study we by design did not include victims of sudden death from epilepsy (SUDEP). CTE subjects: Six post mortem CTE brains from American football players or blast exposed victims with a known history of sub-concussive and concussive diagnoses; these were provided by Dr. Ann McKee at Boston University. Postmortem human brain were received as fresh tissue and as fixed tissue in formalin after processing by medical examiners. Healthy controls subjects: Six normal post mortem brain samples, also provided by Dr. Ann McKee at Boston University.
Immunohistochemistry
Immunostaining for identification of PT, total tau (Pan-tau) and IgG was conducted using diaminobenzidine (DAB) or fluorescence. Sections were washed in phosphate buffer saline (PBS, 1×), then permeabilized with 0.3% Tween/PBS for 1 h and rinsed once for 5 min in PBS. Blocking for endogenous peroxide was done with 0.3% hydrogen peroxide in methanol for 20 min. Sections were washed with PBS and then incubated for 1 h in 5% goat serum. Overnight incubation was done either in mouse monoclonal anti-human Phospho-PHF-tau pSer202+Thr205 antibody, biotin conjugate (AT8) from Thermo Scientific, Rockford, IL (catalog number MN1020-B) or CP13 (generous gift by Dr. Peter Davies, Albert Einstein College of Medicine) to detect phospho-tau, mouse monoclonal TAU-5 antibody from Life Technologies, Grand Island, NY (catalog number AHB0042) on a shaker at 4 °C, followed by three 5 minute rinses with PBS and a 1 hour incubation with a biotinylated anti-mouse IgG (1:600. Vector laboratories, Burlingame, CA) prepared in 0.4% Triton-X. IgG staining was also performed on consecutive brain sections using human IgG (1:2000; Jackson ImmunoResearch Laboratories Inc., West Grove, PA). This was followed again by rinses with PBS. Because biotin amplification with avidin enhances visualization of reaction products, sections were incubated for 1 hour with an avidin/biotin complex (Elite Vectastain ABC Kit; Vector Labs, Burlingame, CA). After 3 more rinses with PBS sections were incubated with DAB (Peroxidase Substrate Kit, Vector Labs Burlingame, CA) to visualize antibody binding sites. Slides were then dehydrated and mounted using Permount solution.
Immunofluorescence
Staining for phospho-tau, IgG, GFAP and albumin in the human brain sections was performed as follows. The adjacent free floating sections were processed by blocking in 5% goat serum followed by primary antibody incubation, mouse monoclonal anti-human Albumin (1:1000, Sigma, St. Louis, MO), mouse anti-human phospho Tau (mouse monoclonal anti-human Phospho-PHF-tau pSer202+Thr205 antibody, biotin conjugate (AT8) from Thermo Scientific, Rockford, IL (catalog number MN1020-B), and secondary antibodies fluorescein isothiocyanate (FITC)-conjugated affinipure donkey anti-mouse IgG (1:100, Jackson ImmunoResearch Laboratories Inc., West Grove, PA), donkey anti-mouse AF 594 (1:100, Jackson ImmunoResearch Laboratories Inc., West Grove, PA). Auto-fluorescence was blocked with Sudan black B and finally the sections were coverslipped on glass slides using Vectashield mounting medium with DAPI (Vector Labs, Burlingame, CA) and analyzed by fluorescent microscopy.
Preparation of Sarkosyl- soluble and insoluble protein fraction
Human brain samples (from CTE, TLE and control subjects) were homogenised and lysates extracted in 1× radioimmunoprecipitation assay (RIPA) lysis buffer (Sigma-Aldrich, USA) containing protease inhibitor cocktail set (Aprotinin 2 μg/ml, Leupeptin 5 μg/ml, Pepstatin 1μg/ml and PMSF 1 mM). 270 μl of lysates were incubated for 2 hr at 37°C on an orbital shaker with 1% (w/v) Sarkosyl and 1% (v/v) β-mercaptoethanol. For the insoluble preparation, samples were ultracentrifuged at 150,000 g for 35 min at room temperature. The supernatants were collected in a new tube (Sarkosyl Soluble Protein). The pellets were washed three times with 1% (w/v) Sarkosyl in buffer H (10 mM Tris-HCl, 1 mM EDTA, 800 mM NaCl, 10% Sucrose, pH 7.4 with protease inhibitors). After the final wash, pellets were resuspended in 20–50 μl of 1× Laemmli sample buffer (Sarkosyl Insoluble Protein). Protein concentration of both Sarkosyl- soluble and insoluble protein samples were estimated prior to perform Western blotting or enzyme-linked immunosorbent assay (ELISA).
Western Blotting
Tissue lysates from human brain samples were extracted in RIPA lysis buffer containing protease inhibitors. Protein concentration was analyzed using Coomassie Plus (Bradford) Assay reagent according to manufacturer’s protocol (Thermo Scientific, USA). Protein samples were then separated by 10 % SDS-PAGE and Western blots were performed. For immunodetection, the following antibodies were used: mouse monoclonal anti-human Phospho-PHF-tau pSer202+Thr205 antibody, biotin conjugate (AT8) from Thermo Scientific, Rockford, IL (1:500 dilution, catalog number MN1020-B) or CP13 (1:500 dilution, generous gift by Dr. Peter Davies, Albert Einstein College of Medicine) to detect phospho-tau, and mouse monoclonal TAU-5 antibody from Life Technologies, Grand Island, NY (1 μg/ml, catalog number AHB0042) to detect Pan-Tau. Blots were incubated overnight at 4°C with primary antibodies followed by 2 hour incubation at room temperature with HRP-conjugated secondary antibodies. To validate the presence of phospho-tau the PVDF membranes were first incubated for 30 min at 50 °C in stripping buffer (100 mM 2-mercaptoethanol, 2 % sodium dodecyl sulfate, 62.5 mM Tris-HCl, pH 6.7) and then reprobed with phospho-tau antibody. The following secondary antibodies were used: polyclonal goat anti-mouse immunoglobulins/HRP from DAKO Laboratories, Carpinteria, CA (1:1000 dilution, catalog number P0447). The HRP enzyme activity was detected with Pierce enhanced chemiluminescence (ECL) Western Blotting Substrate (Thermo Fisher Scientific, Rockford, Illinois). Equal volumes of Detection Reagents 1 and 2 were mixed and added to the membrane for a 2-minute incubation. Automated Kodak X-ray film developers were used to develop the X-ray films in the dark room. Pixelation or density analyses of bands were performed using ImageJ software according to the standard protocol published at http://rsb.info.nih.gov/ij. The data presented herein were obtained with two different anti- P tau antibodies, namely CP13 and AT8. While these antibodies were expected to perform similarly based on previous literature (11), subtle differences were noted and quantified. Supplementary Figure 1C shows the differences in staining across all samples seen when using AT8 or CP13. Note that these values were averaged across pathologies, since no disease-specific differences were seen.
Quantification of immunocytochemistry
The grading system used to quantify phosphorylated tau immunocytochemical signals was derived and modified and simplified from previous work(9). Since no hippocampal tissue was present in the available CTE and control samples, we did not analyze comparison tissue in hippocampal regions from human epileptic brain. Each section was observed at low (5×) and high (20×–40×) magnifications by at least two blinded investigators. The principal investigator (DJ) reviewed again the measurements and reanalyzed the specimens. A score from 0 (no visible staining with phosphorylated tau) to 3 (intense staining) was implemented. The following were noted and quantified (see Figure 7). Pial staining was quantified at low power (5–10×) and defined as intense immunostaining that was not due to edge effects due to DAB staining. The latter is not confined to pial layers but affects equally the deeper regions where the cut from the whole brain was performed. Staining of superficial layers was also quantified to account for the robust signal that was often seen in CTE and epilepsy-derived samples even when pial phospho tau was absent. An example of modest (score of 1) to intense (score of 2) pial staining is shown in Figures 1A and B, while an extreme example is shown in Figure 2B. Sulcal staining was described in (11), and was also noted and quantified in our study. An example of a score of 2 for sulcal staining is indicated by an asterisk in Figures 1 and 2B. Neuritic plaques or tangles were defined as agglomerates of neurofibrillary or astrocytic tangles, or dot-like and spindle-shaped deposits (e.g., Figure 6A). Staining intensity was graded by low power inspection of the overall staining patterns. Since DAB is not a quantitative assays per se, this parameter was only measured across slices that were processed at the same time. Degenerated and degenerating neurons values were derived by estimating the number of neurons that appeared fragmented and those where only fragments of neuritic extensions were seen. Figure 6 shows several examples of these. Finally, punctuated axons was a parameter used to described the typical appearance of phosphorylated tau stained axons which were almost exclusively found in CTE and epilepsy.
ELISA analysis for total and specific phosphorylated forms of tau
Brain levels of total tau and phosphorylated tau (unseparated, Sarkosyl- soluble and insoluble) were measured by commercially available ELISAs. Total Tau measurements were performed using an ELISA kit (96 wells, total tau human, Life Technologies) and absorbance readings obtain using a multi-plate fluorescent reader. Signals were then converted into pg/mL as per standard curve concentrations. Phosphorylated Tau Ser 199 measurements were performed using an ELISA kit (96 wells, tau [pS199] human, Life Technologies) and absorbance readings obtain using a multi-plate fluorescent reader. Signals were then converted into pg/mL as per standard curve concentrations. Phosphorylated Tau Ser 396 measurements were performed using an ELISA kit (96 wells, tau [pS396] human, Life Technologies) and absorbance readings obtain using a multi-plate fluorescent reader. Signals were then converted into pg/mL as per standard curve concentrations. Phosphorylated Tau Thr 231 measurements were performed using an ELISA kit (96 wells, tau [pT231] human, Life Technologies) and absorbance readings obtain using a multi-plate fluorescent reader. Signals were then converted into U/mL as per standard curve concentrations. The quantified total tau or phospho-tau were normalized by total protein estimated.
|
| |
| Tau Protein Target | Catalog Number |
| Total tau | KHB0041 |
| pT231 | KHB8051 |
| pS199 | KHB7041 |
| pS396 | KHB7031 |
|
| |
Statistical Analysis
Differences in staining between different samples as well as differences in brain levels of Tau measured by ELISA were carried out using JMP (v. 10) by ANOVA or paired t-tests as appropriate. The Dunnett’s multiple comparisons tests are used only as follow up tests to ANOVA. P<0.05 was considered statistically significant.
Supplementary Material
Figure 11. Summary and interpretation of results.
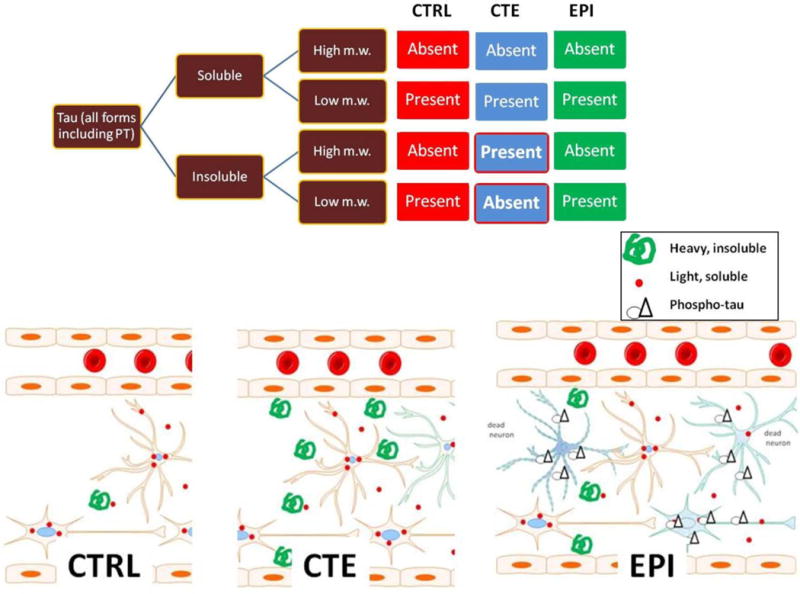
The diagram refers to quantitative results while the drawings relate to immunocytochemical correlates of ELISA and Western. The main quantitative difference between CTRL, EPI and CTE was presence of high m.w. insoluble forms in CTE. These are interpreted as consequence of tangles as seen in tissue sections (e.g., Fig. 6B). CTRL virtually lacked insoluble or high m.w. tau, while EPI was characterized by the highest ratio of insoluble/soluble tau (Fig. 10). This is interpreted as a result of excitotoxic neuronal death which is typical of drug resistant epileptic brain, and as consequence of spillage of microtubule-bound tau/PT present in proximity or around necrotic/apoptotic neurons (Figure 2I).
HIGHLIGHTS.
Phospho tau (PT) deposits in brain are found in absence of chronic traumatic encephalopathy (CTE) 2. PT accumulation as seen in CTE is not an exclusive consequence of repeated traumatic brain injury as previously reported
Pathological tau is often found surrounding blood vessels, suggesting a cerebrovascular pathology
Specific forms of PT with different phosphorylation sites do not reveal specificity for CTE vs. epileptic brain
Epileptic brain has elevated levels of cellular debris containing low molecular weight, soluble and insoluble tau
Acknowledgments
We would like to thank Dr. Peter Davies, Albert Einstein College of Medicine, Bronx, NY10461, USA for providing the CP13 antibody and Dr. Ann McKee from Boston University Center for the Study of Traumatic Encephalopathy with the grant number (P30-AG13846), Boston University School of Medicine, Boston, MA 02118, USA for providing post-mortem brain tissue samples.
FUNDING
This work was supported by: National Institutes of Health [R01NS078307, R01NS43284, R41MH093302, R21NS077236, R42MH093302, UH3TR000491 and R21HD057256] to DJ and a Scientist Development Grant from the American Heart Association [13SDG13950015] and a Brain Behavior Research Foundation grant to CG.
Abbreviations
- CNS
(central nervous system)
- CTE
(chronic traumatic encephalopathy)
- CTX
(cortex)
- MVA
(motor vehicle accident)
- NFL
(national football league)
- PT
(phosphorylated tau protein)
- rTBI
(repetitive traumatic brain injury)
- TLE
(temporal lobe epilepsy)
Footnotes
Publisher's Disclaimer: This is a PDF file of an unedited manuscript that has been accepted for publication. As a service to our customers we are providing this early version of the manuscript. The manuscript will undergo copyediting, typesetting, and review of the resulting proof before it is published in its final citable form. Please note that during the production process errors may be discovered which could affect the content, and all legal disclaimers that apply to the journal pertain.
Reference List
- 1.Daneshvar DH, Nowinski CJ, McKee AC, Cantu RC. The Epidemiology of Sport-Related Concussion. Clinics in Sports Medicine. 2011 Jan;30(1):1–+. doi: 10.1016/j.csm.2010.08.006. [DOI] [PMC free article] [PubMed] [Google Scholar]
- 2.Peskind ER, Brody D, Cernak I, Mckee A, Ruff RL. Military- and Sports-Related Mild Traumatic Brain Injury: Clinical Presentation, Management, and Long-Term Consequences. Journal of Clinical Psychiatry. 2013 Feb;74(2):180–8. doi: 10.4088/JCP.12011co1c. [DOI] [PMC free article] [PubMed] [Google Scholar]
- 3.McKee AC, Cantu RC, Nowinski CJ, Hedley-Whyte ET, Gavett BE, Budson AE, Santini VE, Lee HS, Kubilus CA, Stern RA. Chronic Traumatic Encephalopathy in Athletes: Progressive Tauopathy After Repetitive Head Injury. J Neuropathol Exp Neurol. 2009 Jul;68(7):709–35. doi: 10.1097/NEN.0b013e3181a9d503. [DOI] [PMC free article] [PubMed] [Google Scholar]
- 4.Goldstein LE, Fisher AM, Tagge CA, Zhang XL, Velisek L, Sullivan JA, Upreti C, Kracht JM, Ericsson M, Wojnarowicz MW, et al. Chronic Traumatic Encephalopathy in Blast-Exposed Military Veterans and a Blast Neurotrauma Mouse Model. Science Translational Medicine. 2012 May 16;4(134) doi: 10.1126/scitranslmed.3003716. [DOI] [PMC free article] [PubMed] [Google Scholar]
- 5.Mandelkow EM, Mandelkow E. Biochemistry and Cell Biology of Tau Protein in Neurofibrillary Degeneration. Cold Spring Harbor Perspectives in Medicine. 2012 Jul;2(7) doi: 10.1101/cshperspect.a006247. [DOI] [PMC free article] [PubMed] [Google Scholar]
- 6.Morris M, Maeda S, Vossel K, Mucke L. The Many Faces of Tau. Neuron. 2011 May 12;70(3):410–26. doi: 10.1016/j.neuron.2011.04.009. [DOI] [PMC free article] [PubMed] [Google Scholar]
- 7.Smith DH, Johnson VE, Stewart W. Chronic neuropathologies of single and repetitive TBI: substrates of dementia? Nature Reviews Neurology. 2013 Apr;9(4):211–21. doi: 10.1038/nrneurol.2013.29. [DOI] [PMC free article] [PubMed] [Google Scholar]
- 8.Sen A, Thom M, Martinian L, Harding B, Cross JH, Nikolic M, Sisodiya SM. Pathological tau tangles localize to focal cortical dysplasia in older patients. Epilepsia. 2007 Aug;48(8):1447–54. doi: 10.1111/j.1528-1167.2007.01107.x. [DOI] [PubMed] [Google Scholar]
- 9.Thom M, Liu JY, Thompson P, Phadke R, Narkiewicz M, Martinian L, Marsdon D, Koepp M, Caboclo L, Catarino CB, et al. Neurofibrillary tangle pathology and Braak staging in chronic epilepsy in relation to traumatic brain injury and hippocampal sclerosis: a post-mortem study. Brain. 2011 Oct;134:2969–81. doi: 10.1093/brain/awr209. [DOI] [PMC free article] [PubMed] [Google Scholar]
- 10.Hazrati LN, Tartaglia MC, Diamandis P, Davis KD, Green RE, Wennberg R, Wong JC, Ezerins L, Tator CH. Absence of chronic traumatic encephalopathy in retired football players with multiple concussions and neurological symptomatology. Frontiers in Human Neuroscience. 2013 May;24:7. doi: 10.3389/fnhum.2013.00222. [DOI] [PMC free article] [PubMed] [Google Scholar]
- 11.Goldstein LE, Fisher AM, Tagge CA, Zhang XL, Velisek L, Sullivan JA, Upreti C, Kracht JM, Ericsson M, Wojnarowicz MW, et al. Chronic traumatic encephalopathy in blast-exposed military veterans and a blast neurotrauma mouse model. Sci Transl Med. 2012 May 16;4(134):134ra60. doi: 10.1126/scitranslmed.3003716. [DOI] [PMC free article] [PubMed] [Google Scholar]
- 12.McKee AC, Cantu RC, Nowinski CJ, Hedley-Whyte ET, Gavett BE, Budson AE, Santini VE, Lee HS, Kubilus CA, Stern RA. Chronic traumatic encephalopathy in athletes: progressive tauopathy after repetitive head injury. J Neuropathol Exp Neurol. 2009 Jul;68(7):709–35. doi: 10.1097/NEN.0b013e3181a9d503. [DOI] [PMC free article] [PubMed] [Google Scholar]
- 13.Blennow K, Hardy J, Zetterberg H. The Neuropathology and Neurobiology of Traumatic Brain Injury. Neuron. 2012 Dec 6;76(5):886–99. doi: 10.1016/j.neuron.2012.11.021. [DOI] [PubMed] [Google Scholar]
- 14.Porzig R, Singer D, Hoffmann R. Epitope mapping of mAbs AT8 and Tau5 directed against hyperphosphorylated regions of the human tau protein. Biochem Biophys Res Commun. 2007 Jun 29;358(2):644–9. doi: 10.1016/j.bbrc.2007.04.187. [DOI] [PubMed] [Google Scholar]
- 15.Sengupta A, Kabat J, Novak M, Wu Q, Grundke-Iqbal I, Iqbal K. Phosphorylation of tau at both Thr 231 and Ser 262 is required for maximal inhibition of its binding to microtubules. Arch Biochem Biophys. 1998 Sep 15;357(2):299–309. doi: 10.1006/abbi.1998.0813. [DOI] [PubMed] [Google Scholar]
- 16.Sahara N, Ren Y, Ward S, Binder LI, Suhara T, Higuchi M. Tau oligomers as potential targets for early diagnosis of tauopathy. J Alzheimers Dis. 2014;40(Suppl 1):S91–S96. doi: 10.3233/JAD-132429. [DOI] [PubMed] [Google Scholar]
- 17.Schubert M, Gautam D, Surjo D, Ueki K, Baudler S, Schubert D, Kondo T, Alber J, Galldiks N, Kustermann E, et al. Role for neuronal insulin resistance in neurodegenerative diseases. Proc Natl Acad Sci USA. 2004 Mar 2;101(9):3100–5. doi: 10.1073/pnas.0308724101. [DOI] [PMC free article] [PubMed] [Google Scholar]
- 18.McKee AC, Stein TD, Nowinski CJ, Stern RA, Daneshvar DH, Alvarez VE, Lee HS, Hall G, Wojtowicz SM, Baugh CM, et al. The spectrum of disease in chronic traumatic encephalopathy. Brain. 2013 Jan;136(Pt 1):43–64. doi: 10.1093/brain/aws307. [DOI] [PMC free article] [PubMed] [Google Scholar]
- 19.Mez J, Stern RA, McKee AC. Chronic Traumatic Encephalopathy: Where Are We and Where Are We Going? Current Neurology and Neuroscience Reports. 2013 Dec;13(12) doi: 10.1007/s11910-013-0407-7. [DOI] [PMC free article] [PubMed] [Google Scholar]
- 20.Iliff JJ, Lee H, Yu M, Feng T, Logan J, Nedergaard M, Benveniste H. Brain-wide pathway for waste clearance captured by contrast-enhanced MRI. J Clin Invest. 2013 Mar;123(3):1299–309. doi: 10.1172/JCI67677. [DOI] [PMC free article] [PubMed] [Google Scholar]
- 21.Iliff JJ, Wang MH, Zeppenfeld DM, Venkataraman A, Plog BA, Liao YH, Deane R, Nedergaard M. Cerebral Arterial Pulsation Drives Paravascular CSF-Interstitial Fluid Exchange in the Murine Brain. Journal of Neuroscience. 2013 Nov 13;33(46):18190–9. doi: 10.1523/JNEUROSCI.1592-13.2013. [DOI] [PMC free article] [PubMed] [Google Scholar]
- 22.Janigro D. Are you in or out? Leukocyte, ion, and neurotransmitter permeability across the epileptic blood-brain barrier. Epilepsia. 2012 Jun;53(Suppl 1):26–34. doi: 10.1111/j.1528-1167.2012.03472.x. [DOI] [PMC free article] [PubMed] [Google Scholar]
- 23.Devos SL, Goncharoff DK, Chen G, Kebodeaux CS, Yamada K, Stewart FR, Schuler DR, Maloney SE, Wozniak DF, Rigo F, et al. Antisense Reduction of Tau in Adult Mice Protects against Seizures. Journal of Neuroscience. 2013 Jul 31;33(31):12887–97. doi: 10.1523/JNEUROSCI.2107-13.2013. [DOI] [PMC free article] [PubMed] [Google Scholar]
Associated Data
This section collects any data citations, data availability statements, or supplementary materials included in this article.


