Abstract
N-(2-Acetamido)-2-aminoethanesulfonic acid (ACES), one of Good's buffers, was applied to pH imaging using hyperpolarized 13C magnetic resonance spectroscopy. Rapid NMR- and MRI-based pH measurements were obtained by exploiting the sensitive pH-dependence of its 13C chemical shift within the physiologic range.
Metabolic reprogramming in cancer results in increased secretion of acid into the extracellular space. This results in an interstitial microenvironment that is slightly acidic, ranging from pH 6.5 – 7.0 for many cancer subtypes, in contrast with normal healthy tissue which characteristically has pH 7.2 -7.4. This property has been characterized by techniques including microelectrode measurements, magnetic resonance, and fluorescence.1-3 Moreover, acidification of the extracellular microenvironment accompanies local invasion and metastasis in a variety of tumors.4-6 Treatment of solid tumors with sodium bicarbonate increases tumor pH and reduces metastasis.7 Interstitial acidity is thought to induce resistance to chemotherapeutic agents, and many small molecule agents targeting acid transporters are currently under development.8, 9 Thus, acidic extracellular pH represents both a therapeutic target as well as a potential biomarker for the presence of aggressive cancer with higher risk of metastases.
Several magnetic resonance techniques, have been developed for the purpose of imaging acidic interstitial pH, including methods based on magnetic resonance spectroscopy (MRS) and chemical exchange saturation transfer (CEST).6, 10-14 A central requirement for these techniques is accuracy, since the pH change between healthy and diseased tissues is small. In the MRS strategy, a probe that has a known chemical shift response to pH changes is administered systemically. The chemical shift is then measured using MRS, and by comparison to a standard curve, the pH can be determined. This approach has been studied using several different nuclei, including 31P,15-17 1H,18-20 and 19F.21, 22 While these techniques have provided important insights in animal model systems, they have various potential limitations, including long scan time, requirement for high dose of probe administration, and in some cases, poor spatial resolution.
Hyperpolarized 13C MRS is an emerging technology which relies upon dramatic NMR signal enhancement provided via dynamic nuclear polarization (DNP).23 This method has been applied to numerous chemical substrates,24 and successfully translated to the clinic for use in men with prostate cancer.25 An elegant pH imaging strategy using hyperpolarized 13C MRS to study the equilibrium between bicarbonate and CO2 has been reported.26, 27 However, this technique has practical limitations, including 1) low signal to noise ratio of the CO2 resonance under typical physiologic conditions (since pKa,bicarbonate = 6.17), potentially propagating significant errors to pH estimates derived from this ratiometric approach, 2) the short effective T1 relaxation time of bicarbonate in vivo,26 3) the relatively low solubility of bicarbonate in glassing agents resulting in difficulty producing sufficient polarized material, and 4) the possibility for inhibition of carbonic anhydrase,28 which is required for rapid equilibration between bicarbonate and CO2.
Since relative chemical shifts can in general be measured very accurately using MRS, spectroscopic, or frequency specific imaging techniques, we reasoned that a hyperpolarized 13C approach employing a pair of probes with and without pH-dependent chemical shift could address some of the limitations of this prior approach. Specifically, this approach combines the robustness and high accuracy of chemical shift based MRS methods with the high signal to noise ratio inherent to hyperpolarized 13C imaging.
Initially, a small library of compounds was tested with thermal equilibrium NMR, comparing 13C chemical shifts of long-T1 nuclei at pH 6.5 and 7.4 (Supplemental fig. 1). These compounds were selected based on the following key criteria: 1) pKa near the physiologic range (between 6.0 and 8.0), 2) presence of a long T1 nucleus, and 3) feasibility of isotopic synthesis. Agents likely to be toxic were excluded. The classes of compounds examined included biological buffers, dicarboxylic acids, and imidazole/histidine derivatives.
In his landmark 1966 paper, Dr. N. Good described criteria for an optimal biological pH buffer, and synthesized a small series of compounds which have since become the standard buffers used in biochemistry.29 The criteria included pKa between 6 and 8, water solubility, impermeability to biological membranes, minimum influence of temperature, concentration, or ionic strength on dissociation of the buffer, lack of binding to other biological cations, resistance to degradation, and easy synthetic preparation. We rationalized that these properties would also yield optimal pH imaging probes. Moreover, these compounds have been used widely in the 50 years since their initial description, reducing the likelihood of novel interactions which could block pH dependent chemical shift change.
Four of Good's buffers with long T1 nuclei, and Tris, another commonly used biological buffer, are depicted in Figure 1. Of these, the compounds with the largest chemical shifts were ADA and ACES (Figure 1, Supplemental figures 2-6). In initial studies, we found that the pH dependent chemical shift change of ADA was blocked by the presence of calcium, consistent with its known chelation properties (Supplemental table 1).29
Fig. 1.
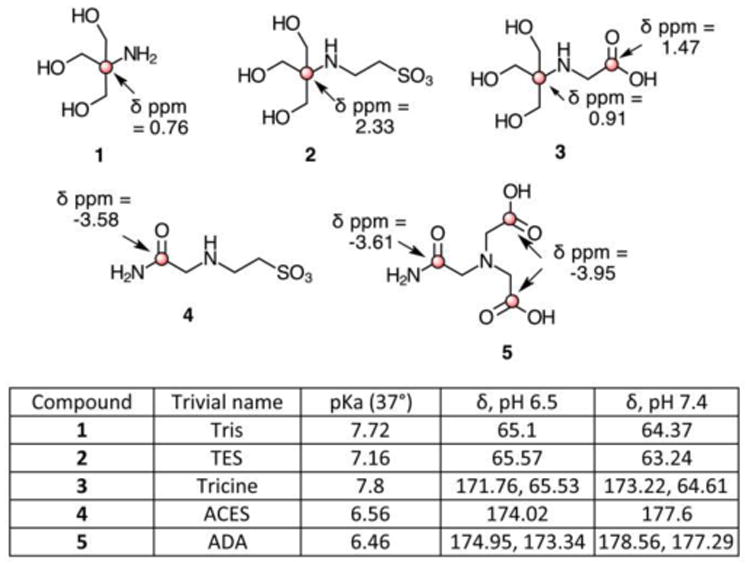
Structures of Good's buffers. Long T1 nuclei are indicated in red. The difference in chemical shift between pH 6.5 and 7.4 is shown for long T1 nuclei. A positive δ ppm indicates a downfield 13C chemical shift. pKa are based on prior literature values.
Thus, we selected ACES as the most promising overall compound for imaging, due to the large pH dependant chemical shift, synthetic accessibility, predicted lack of toxicity, and known lack of chelation of abundant biological cations. 13C, 15N ACES was synthesized in 4 steps starting from 1-13C glycine in 54% overall yield, based on the previous synthesis of the natural abundance material combined with a previously described technique for the preparation of isotopically enriched amino acids (Figure 2).29, 30 Secondary labelling with 15N was incorporated in order to eliminate low field quadrupolar T1 relaxation effects associated with 14N as well as to increase the T2 relaxation time for imaging purposes.31 This came at the expense of splitting of the 13C peak by the spin-1/2 15N nucleus, which could potentially limit the accuracy of chemical shift measurement and signal to noise.
Fig 2.
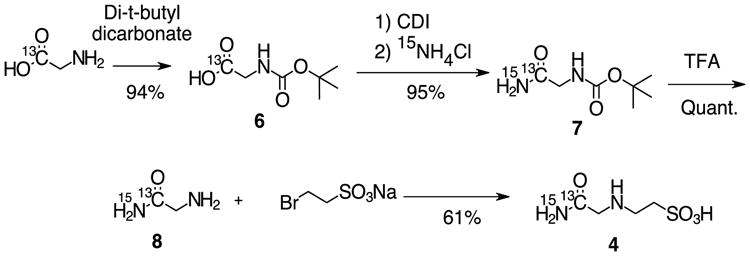
Synthesis of 13C, 15N, 13C ACES.
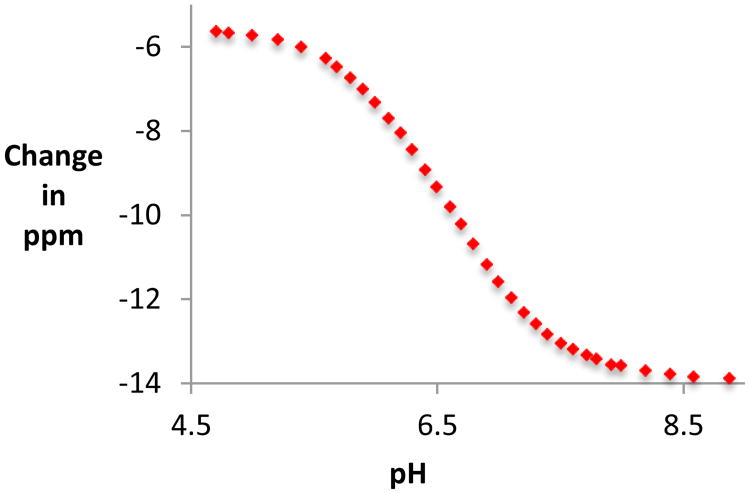
Since endogenous 13C nuclei are not abundant enough to allow for in vivo imaging, we added a second compound, 13C urea, as a chemical shift standard. Urea was selected since its 13C chemical shift is close to that of the ACES carbonyl, and hyperpolarized 13C, 15N urea is a well characterized imaging agent.32 A titration curve was developed comparing the chemical shifts of ACES and urea (Figure 3). Values for δmin, δmax, and pKa were obtained by iteratively fitting the data, yielding the following equation linking chemical shift difference to pH, in a manner similar to previously described:15
Figure 3.
Titration curve depicting the difference in chemical shift between urea and ACES as a function of pH.
The pKa obtained using this technique, 6.58 (at 37 degrees), is in agreement with the previously published value of 6.56.29
A method for hyperpolarization of 13C,15N ACES was developed and optimized with respect to microwave frequency and concentration of Gd-DOTA (Supplemental table 2). The optimized prep was obtained by dissolution of 13C,15N ACES in 0.95 equivalents NaOH (using a 10M solution), and addition of Gd-DOTA to 0.5 mM, with 20 mM OX63 trityl radical.33 Using this method, 12.5 ± 2.7% (n = 3) average liquid state polarization, back calculated to the time of dissolution was obtained. The T1 was 18 s at 11.7T and 25 s at 3T. The polarization time constant was 2490 ± 396 (s.d., n= 10). A copolarization method34 was developed to simultaneously polarize 13C,15N ACES and 13C,15N urea. By copolarizing 13C,15N ACES and 13C,15N urea, we were able to accurately determine the pH of solutions in a 500 MHz NMR (Figure 4). There was a slight but significant change in the measured pH by variation of temperature (Supplemental figure 8) and by variation of concentration of the probe (Supplemental figure 9). Furthermore, there was a slight change in the pH measured at the earliest time points in comparison to those measured at the latest time points (Supplemental figure 10). This change may be related to initial variation in temperature, and limitations of the kinetics of the acid base equilibria (although these are known to be very rapid reactions in most cases35). Overall, these data suggest that the 13C,15N ACES and 13C,15N urea copolarization method could be used to determine the pH in an imaging experiment.
Figure 4.
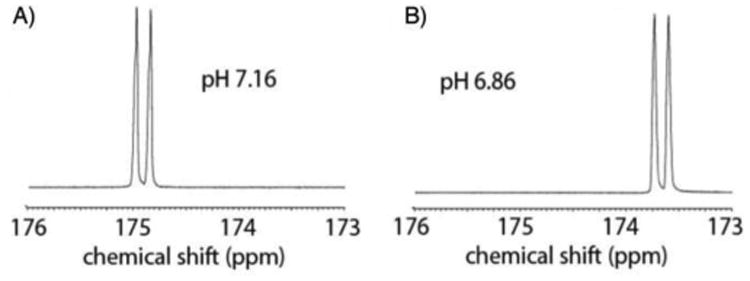
Measurement of pH with 13C,15N ACES. The calculated pH values of 7.16 and 6.86 correlated with the values of 7.22 and 6.91 measured on a pH meter following the experiment. The carboxylate of 13C,15N ACES is a doublet owing to coupling with the adjacent 15N.
In order to assess the properties of this system under imaging conditions, a five compartment phantom was imaged on a clinical 3T scanner (Figure 5). Again, the dramatic chemical shift change of ACES in response to pH allowed for rapid determination of pH. There was a slight difference in pH calculated from the chemical shift and that measured on a pH meter following the experiment. These differences, averaging 0.18 pH units, may be due to a combination of factors, including temperature (supplemental figure 8), concentration (3 mM in the phantom, supplemental figure 9), the presence of phosphate buffer in the solution (supplemental table 3), or the early time point used for imaging (supplemental table 10), and are similar to previously described phantom experiments for imaging pH using hyperpolarized 13C bicarbonate.36, 37 At present, we propose that the accuracy of measured vs. calculated pH is within 0.1 – 0.2 pH units, although a much larger series of experiments would be necessary to truly estimate the accuracy (Supplemental figure 11). In vivo pH imaging is a key future goal for this probe. Based on the phantom experiments, we predict that injection of 0.5 mg ACES should be sufficient to generate appropriate signal to noise in a mouse, for a total dose of 25 mg/kg. Since the administered probe could potentially buffer pH, one important goal is the optimization of signal to noise ratio, as well as accuracy of the method. In order to achieve this goal, synthesis of other isotopically labelled variants is currently underway in our laboratory, including 14N (to minimize signal loss due to the splitting by 15N), and 2H labelled probes (to improve the T1 of the molecule).
Figure 5.
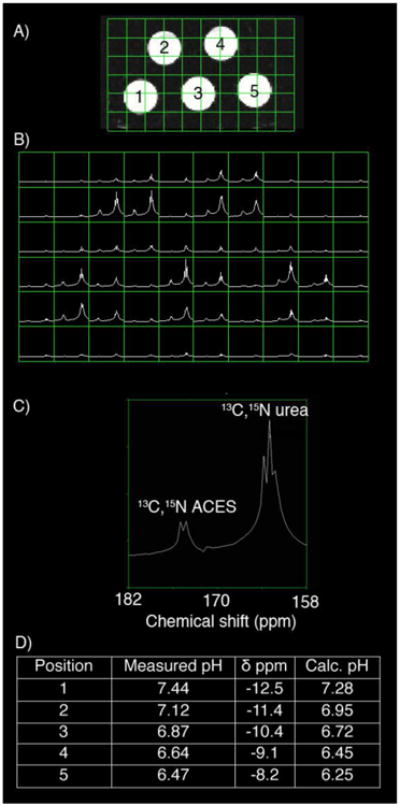
Five compartment phantom for imaging pH using 13C, 15N ACES and 13C,15N urea A) Phantom design incorporated 5 compartments with varying pH. B) 2D chemical shift imaging through the phantom. C) Representative voxel from position 2. D) Summary of calculated and measured pH values.
Overall, these data demonstrate that hyperpolarized 13C,15N ACES can be used to determine pH using 13C magnetic resonance spectroscopy. Initially, a series of compounds was screened for a large chemical shift change over the physiologically relevant pH range. Of these compounds, Good's buffers were the most promising, owing to properties considered in their initial design, coupled with the vast experience of their use. We selected 13C,15N ACES owing to the large chemical shift change over the physiologic range and lack of chelation properties. This compound was applied to pH measurement in an NMR spectrometer and in a chemical shift imaging experiment on a clinical 3T MRI scanner. 13C,15N ACES is a promising tool for imaging pH using hyperpolarized 13C MRS, and we anticipate application of this probe to imaging in animal models of malignancy.
Supplementary Material
Acknowledgments
R.R.F. acknowledges support from NIH 5T32EB0011631-10, a University of California, San Francisco Department of Radiology Seed Grant, a Radiology Society of North America research fellow grant, and an SNMMI-ERF William and Mitzi Blahd, MD Pilot Grant. D.M.W. acknowledges support from NIH R01CA166766. C.V.M. acknowledges support from NIH K01DK099451. This project was also supported by NIH center grant P41EB013598.
Footnotes
Electronic Supplementary Information (ESI) available: Materials and methods, supplementary figures, and characterization data for all new compounds.
Notes and references
- 1.Volk T, Jahde E, Fortmeyer HP, Glusenkamp KH, Rajewsky MF. Br J Cancer. 1993;68:492–500. doi: 10.1038/bjc.1993.375. [DOI] [PMC free article] [PubMed] [Google Scholar]
- 2.Helmlinger G, Yuan F, Dellian M, Jain RK. Nature medicine. 1997;3:177–182. doi: 10.1038/nm0297-177. [DOI] [PubMed] [Google Scholar]
- 3.Gatenby RA, Gillies RJ. Nat Rev Cancer. 2004;4:891–899. doi: 10.1038/nrc1478. [DOI] [PubMed] [Google Scholar]
- 4.Keshari KR, Sriram R, Koelsch BL, Van Criekinge M, Wilson DM, Kurhanewicz J, Wang ZJ. Cancer Res. 2013;73:529–538. doi: 10.1158/0008-5472.CAN-12-3461. [DOI] [PMC free article] [PubMed] [Google Scholar]
- 5.Estrella V, Chen T, Lloyd M, Wojtkowiak J, Cornnell HH, Ibrahim-Hashim A, Bailey K, Balagurunathan Y, Rothberg JM, Sloane BF, Johnson J, Gatenby RA, Gillies RJ. Cancer research. 2013;73:1524–1535. doi: 10.1158/0008-5472.CAN-12-2796. [DOI] [PMC free article] [PubMed] [Google Scholar]
- 6.Hashim AI, Zhang X, Wojtkowiak JW, Martinez GV, Gillies RJ. NMR Biomed. 2011;24:582–591. doi: 10.1002/nbm.1644. [DOI] [PMC free article] [PubMed] [Google Scholar]
- 7.Robey IF, Baggett BK, Kirkpatrick ND, Roe DJ, Dosescu J, Sloane BF, Hashim AI, Morse DL, Raghunand N, Gatenby RA, Gillies RJ. Cancer Res. 2009;69:2260–2268. doi: 10.1158/0008-5472.CAN-07-5575. [DOI] [PMC free article] [PubMed] [Google Scholar]
- 8.Parks SK, Chiche J, Pouyssegur J. Nat Rev Cancer. 2013;13:611–623. doi: 10.1038/nrc3579. [DOI] [PubMed] [Google Scholar]
- 9.Neri D, Supuran CT. Nature reviews Drug discovery. 2011;10:767–777. doi: 10.1038/nrd3554. [DOI] [PubMed] [Google Scholar]
- 10.Zhang X, Lin Y, Gillies RJ. Journal of nuclear medicine : official publication, Society of Nuclear Medicine. 2010;51:1167–1170. doi: 10.2967/jnumed.109.068981. [DOI] [PMC free article] [PubMed] [Google Scholar]
- 11.Gillies RJ, Raghunand N, Garcia-Martin ML, Gatenby RA. IEEE engineering in medicine and biology magazine : the quarterly magazine of the Engineering in Medicine & Biology Society. 2004;23:57–64. doi: 10.1109/memb.2004.1360409. [DOI] [PubMed] [Google Scholar]
- 12.Sherry AD, Woods M. Annual review of biomedical engineering. 2008;10:391–411. doi: 10.1146/annurev.bioeng.9.060906.151929. [DOI] [PMC free article] [PubMed] [Google Scholar]
- 13.Aime S, Barge A, Delli Castelli D, Fedeli F, Mortillaro A, Nielsen FU, Terreno E. Magn Reson Med. 2002;47:639–648. doi: 10.1002/mrm.10106. [DOI] [PubMed] [Google Scholar]
- 14.Zhang S, Merritt M, Woessner DE, Lenkinski RE, Sherry AD. Acc Chem Res. 2003;36:783–790. doi: 10.1021/ar020228m. [DOI] [PubMed] [Google Scholar]
- 15.Gillies RJ, Liu Z, Bhujwalla Z. Am J Physiol. 1994;267:C195–203. doi: 10.1152/ajpcell.1994.267.1.C195. [DOI] [PubMed] [Google Scholar]
- 16.Bhujwalla ZM, McCoy CL, Glickson JD, Gillies RJ, Stubbs M. Br J Cancer. 1998;78:606–611. doi: 10.1038/bjc.1998.548. [DOI] [PMC free article] [PubMed] [Google Scholar]
- 17.Raghunand N, Altbach MI, van Sluis R, Baggett B, Taylor CW, Bhujwalla ZM, Gillies RJ. Biochemical pharmacology. 1999;57:309–312. doi: 10.1016/s0006-2952(98)00306-2. [DOI] [PubMed] [Google Scholar]
- 18.van Sluis R, Bhujwalla ZM, Raghunand N, Ballesteros P, Alvarez J, Cerdan S, Galons JP, Gillies RJ. Magn Reson Med. 1999;41:743–750. doi: 10.1002/(sici)1522-2594(199904)41:4<743::aid-mrm13>3.0.co;2-z. [DOI] [PubMed] [Google Scholar]
- 19.Garcia-Martin ML, Herigault G, Remy C, Farion R, Ballesteros P, Coles JA, Cerdan S, Ziegler A. Cancer Res. 2001;61:6524–6531. [PubMed] [Google Scholar]
- 20.Provent P, Benito M, Hiba B, Farion R, Lopez-Larrubia P, Ballesteros P, Remy C, Segebarth C, Cerdan S, Coles JA, Garcia-Martin ML. Cancer Res. 2007;67:7638–7645. doi: 10.1158/0008-5472.CAN-06-3459. [DOI] [PubMed] [Google Scholar]
- 21.Hunjan S, Mason RP, Mehta VD, Kulkarni PV, Aravind S, Arora V, Antich PP. Magnet Reson Med. 1998;39:551–556. doi: 10.1002/mrm.1910390407. [DOI] [PubMed] [Google Scholar]
- 22.Ojugo ASE, McSheehy PMJ, McIntyre DJO, McCoy C, Stubbs M, Leach MO, Judson IR, Griffiths JR. NMR Biomed. 1999;12:495–504. doi: 10.1002/(sici)1099-1492(199912)12:8<495::aid-nbm594>3.0.co;2-k. [DOI] [PubMed] [Google Scholar]
- 23.Ardenkjaer-Larsen JH, Fridlund B, Gram A, Hansson G, Hansson L, Lerche MH, Servin R, Thaning M, Golman K. Proc Natl Acad Sci U S A. 2003;100:10158–10163. doi: 10.1073/pnas.1733835100. [DOI] [PMC free article] [PubMed] [Google Scholar]
- 24.Keshari KR, Wilson DM. Chem Soc Rev. 2014;43:1627–1659. doi: 10.1039/c3cs60124b. [DOI] [PMC free article] [PubMed] [Google Scholar]
- 25.Nelson SJ, Kurhanewicz J, Vigneron DB, Larson PE, Harzstark AL, Ferrone M, van Criekinge M, Chang JW, Bok R, Park I, Reed G, Carvajal L, Small EJ, Munster P, Weinberg VK, Ardenkjaer-Larsen JH, Chen AP, Hurd RE, Odegardstuen LI, Robb FJ, Tropp J, Murray JA. Sci Transl Med. 2013;5:198ra108. doi: 10.1126/scitranslmed.3006070. [DOI] [PMC free article] [PubMed] [Google Scholar]
- 26.Gallagher FA, Kettunen MI, Day SE, Hu DE, Ardenkjaer-Larsen JH, Zandt R, Jensen PR, Karlsson M, Golman K, Lerche MH, Brindle KM. Nature. 2008;453:940–943. doi: 10.1038/nature07017. [DOI] [PubMed] [Google Scholar]
- 27.Lau AZ, Chen AP, Ghugre NR, Ramanan V, Lam WW, Connelly KA, Wright GA, Cunningham CH. Magn Reson Med. 2010;64:1323–1331. doi: 10.1002/mrm.22525. [DOI] [PubMed] [Google Scholar]
- 28.Schroeder MA, Swietach P, Atherton HJ, Gallagher FA, Lee P, Radda GK, Clarke K, Tyler DJ. Cardiovasc Res. 2010;86:82–91. doi: 10.1093/cvr/cvp396. [DOI] [PMC free article] [PubMed] [Google Scholar]
- 29.Good NE, Winget GD, Winter W, Connolly TN, Izawa S, Singh RM. Biochemistry. 1966;5:467–477. doi: 10.1021/bi00866a011. [DOI] [PubMed] [Google Scholar]
- 30.Grehn L, Bondesson U, Pehk T, Ragnarsson U. J Chem Soc Chem Comm. 1992:1332–1333. doi: 10.1039/C39920001332. [DOI] [Google Scholar]
- 31.Reed GD, von Morze C, Bok R, Koelsch BL, Van Criekinge M, Smith KJ, Hong S, Larson PE, Kurhanewicz J, Vigneron DB. IEEE transactions on medical imaging. 2014;33:362–371. doi: 10.1109/TMI.2013.2285120. [DOI] [PMC free article] [PubMed] [Google Scholar]
- 32.von Morze C, Larson PEZ, Hu S, Keshari K, Wilson DM, Ardenkjaer-Larsen JH, Goga A, Bok R, Kurhanewicz J, Vigneron DB. Journal of Magnetic Resonance Imaging. 2011;33:692–697. doi: 10.1002/jmri.22484. [DOI] [PMC free article] [PubMed] [Google Scholar]
- 33.Ardenkjaer-Larsen JH, Macholl S, Johannesson H. Appl Magn Reson. 2008;34:509–522. [Google Scholar]
- 34.Wilson DM, Keshari KR, Larson PE, Chen AP, Hu S, Van Criekinge M, Bok R, Nelson SJ, Macdonald JM, Vigneron DB, Kurhanewicz J. J Magn Reson. 2010;205:141–147. doi: 10.1016/j.jmr.2010.04.012. [DOI] [PMC free article] [PubMed] [Google Scholar]
- 35.Eigen M. Angewandte Chemie International Edition in English. 1964;3:1–19. [Google Scholar]
- 36.Ghosh RK, Kadlecek SJ, Pourfathi M, Rizi RR. Magn Reson Med. 2014 doi: 10.1002/mrm.25530. [DOI] [PubMed] [Google Scholar]
- 37.Lee Y, Zacharias NM, Piwnica-Worms D, Bhattacharya PK. Chem Commun (Camb) 2014;50:13030–13033. doi: 10.1039/c4cc06199c. [DOI] [PMC free article] [PubMed] [Google Scholar]
Associated Data
This section collects any data citations, data availability statements, or supplementary materials included in this article.


