

Abstract
AIM
This study aimed at evaluation of ischemia-modified albumin (IMA), malondialdehyde (MDA), and advanced oxidative protein products (AOPP) as markers of vascular injury in diabetic nephropathy (DN) with derivation of cutoff values for the same.
MATERIALS AND METHODS
Study population comprised 60 diabetes patients and 30 controls, with diabetes patients further categorized into three groups based on urine albumin/creatinine ratio (UACR) of <30 mg/g (diabetes without microalbuminuria), 30–300 mg/g (early DN), and >300 mg/g of creatinine (overt DN). Serum IMA, MDA, and AOPP were estimated by enzyme-linked immunosorbent assay; HbA1c, serum creatinine, urine albumin, and urine creatinine were estimated using automated analyzers. Statistical analysis was done using analysis of variance, Pearson’s correlation coefficient, and receiver-operating characteristic curve.
RESULTS
A statistically significant difference was found in the levels of IMA among patients with early DN (154 ng/mL), diabetes without nephropathy (109.4 ng/mL), and healthy controls (45.7 ng/mL), with highest levels in early DN cases. Similar increase was seen in AOPP as well. A significant correlation was observed between IMA and UACR in diabetes without nephropathy (r = 0.448).
CONCLUSION
The present study postulates serum IMA as a novel biomarker for the assessment of disease progression in diabetes even before microalbuminuria, and a cutoff point ≥99 ng/mL can be used for detection of early DN.
Keywords: advanced oxidative protein products, diabetic nephropathy, ischemia-modified albumin, malondialdehyde, vascular injury
Introduction
Diabetic complications are associated with increased incidence, severity, and delayed recovery from the stress-induced ischemia participating in endothelial dysfunction, which may lead to the development of angiopathy, especially diabetic nephropathy (DN).1 The pathogenesis of DN is a complex process and it is not yet fully understood. The cause of increased urinary albumin excretion, which is considered to be an early sign of DN, can be attributed to a defect in the glomerular membrane filtration, resulting from renal endothelial damage due to hyperglycemia, oxidative stress, ischemia, and inflammation.2–5 However, several studies have reported development of DN in 29%–61% of type 2 diabetes patients having normal urine albumin levels, as microalbuminuria develops only when significant damage to the glomerular function has already occurred.4,6–8 This significant observation impedes the use of microalbuminuria as a good predictive marker6,9 and necessitates the need for a better biomarker with high sensitivity and specificity for early detection of DN.2,10
Free radical generation coupled with decreased antioxidant defense mechanism and associated ischemia in diabetes leads to an alteration in the tertiary structure of human serum albumin within minutes of arterial occlusion; hence, it is termed ischemia-modified albumin (IMA). As a result of increased generation of reactive oxygen species (ROS), structural modifications of the albumin molecule can occur. IMA is now being used as a sensitive biomarker for detecting cardiac ischemia as an indicator of oxidative stress.11 Recently, some studies were published regarding the role and diagnostic significance of IMA in noncardiac disorders. For the first time, Piwowar et al reported the association of IMA in diabetes and reported 75% increased value of IMA in diabetes compared with control after estimating it by manual spectroscopic method.12 Elevated IMA levels were also detected in diabetic ketoacidosis, pulmonary embolism, peripheral vascular disease, brain ischemia, infection, liver disease, trauma, some neoplasms, and complicated and uncomplicated pregnancies.11,13–16
Complications of diabetes are associated with increased activity of free radicals generated as a result of malignant exposure of endothelial cells to glucose, leading to oxidation of lipid molecules.17,18 Malondialdehyde (MDA), one of the highly reactive three carbon dialdehyde byproducts, is produced from peroxidation of polyunsaturated fatty acids and also during arachidonic acid metabolism for the synthesis of prostaglandins.19,20 This stress marker has been identified to reflect the complications of diabetes.21 The protein molecules that are susceptible to oxidation and glycation are another set of biomolecules that cause damage to vascular endothelium in DN. Advanced oxidative protein product (AOPP), an advanced glycation end product, is progressively related to the increase in albuminuria.22
Despite the associative studies on IMA, MDA, and AOPP with DN, the clinical application with regard to reference ranges and diagnostic criteria is limited and not homogenous across populations. To find the effect of hyperglycemia-induced stress on albumin and lipid macromolecules in vascular endothelial injury of diabetes, this study was aimed at estimating the levels of IMA, MDA, and AOPP in diabetes cases as markers of vascular injury with derivation of cutoff value to evaluate their utility in early DN.
Materials and Methods
Study population
A cross-sectional study was conducted including 60 type 2 diabetes mellitus (T2DM) cases aged between 30 and 65 years and 30 age- and sex-matched controls from Medical College Hospital between December 2014 and June 2015. Based on urine albumin/creatinine ratio (UACR), all diabetes cases were further divided into three groups of 20 each.
The diagnosis of diabetes was made on the basis of fasting plasma glucose (FPG) ≥126 mg/dL, 2-hour postprandial plasma glucose (2-hour PPPG) ≥200 mg/dL, and glycated hemoglobin (HbA1c) ≥6.5%, and that of nephropathy was made based on UACR. Group I (diabetes without microalbuminuria) included diabetes with UACR <30 mg/g; group II included diabetes with microalbuminuria (early DN) with UACR between 30 and 300 mg/g; and diabetes with macroalbuminuria (overt DN) having UACR >300 mg/g of creatinine constituted group III.
This research complied with the principles of the Declaration of Helsinki. The study was approved by the Institutional Ethics Committee, and informed consent was obtained from all the individuals before enrolment into the study. Patients having serum albumin level <3 g/dL and >5.5 g/dL, those suffering from acute infections, inflammatory diseases, known cases of hepatic, renal, cardiovascular, or endocrine diseases, pregnancy, cancer/HIV patients, and patients on steroid medications or hormonal therapy were excluded from the study. Patients’ relevant data were recorded about routine biochemical parameters such as FPG and two-hour PPPG (glucose oxidase method), HbA1c (ion-exchange high-performance liquid chromatography in Bio-Rad Turbo II Variant analyzer), serum and urine creatinine (Jaffe’s method), and serum and urine albumin (Turbidimetric method), which were estimated using Roche commercial kits on automated clinical chemistry analyzers in Central Biochemistry Laboratory of the hospital. UACR was calculated for each subject.
Blood sample was collected in plain vacutainer for the estimation of IMA, MDA, and AOPP. After separation, serum was stored at −20 °C until further analysis. IMA, MDA, and AOPP were estimated by solid-phase enzyme-linked immunosorbent assay (ELISA) with kits from Shanghai Yehua Biological Technology Co., Ltd, based on double-sandwich principle on ELx 800 by BioTek® Instruments, Inc. The sample was added to the precoated monoclonal antibody wells. After incubation, the antibodies labeled with biotin were added to form immune complex with streptavidin–horseradish peroxidase. Unbound enzymes were removed by washing, and then, the substrate was added to give color, which was measured at 450 nm by a colorimeter. The intensity of color was proportional to the concentration of the analyte and was positively correlated.23 Assay range of the ELSIA kits used was 2–600 ng/mL (sensitivity 1.08 ng/mL) for IMA, 0.2–60 nmol/mL (sensitivity 0.14 nmol/mL) for MDA, and 0.1–40 ng/mL (sensitivity 0.05 ng/mL) for AOPP, with coefficient of variation for intraassay being <10% and that for interassay being <12%.
Statistical analysis
Data were analyzed using IBM SPSS Statistics version 20 (SPSS). Intergroup comparison of means was done using analysis of variance and Tukey’s test as the post hoc test. Correlation analysis was done using Pearson’s correlation coefficient. Receiver-operating characteristic (ROC) curve was used to distinguish the positive results from negative results. The area under the curve (AUC) ranges from 0.6 to 1, and the test parameter that approaches 1 was considered as a perfect discriminator. All data are expressed as mean ± standard deviation. P < 0.05 was considered significant.
Results
The baseline characteristics of each group are presented as mean ± standard deviation (Table 1). Patients in groups II and III were having higher blood pressure and a longer duration of diabetes than group I. Significant difference was observed with regard to two-hour PPPG and HbA1c in group III as compared with groups I, II, and IV. Mean levels of FPG, two-hour PPPG, and HbA1c were found in the order of group III > group II > group I. Serum creatinine, UACR, systolic blood pressure, and diastolic blood pressure were also found to be significantly raised in group III compared with groups I, II, and IV.
Table 1.
Comparison of baseline characteristics among the groups.
| GROUP I (N = 20) | GROUP II (N = 20) | GROUP III (N = 20) | GROUP IV (N = 30) | |
|---|---|---|---|---|
| Age (Year) | 48.1 ± 17.1 (31–65) | 50.2 ± 14.1 (36–64) | 49.8 ± 16.9 (33–65) | 47.3 ± 17.2 (30–64) |
| Sex (M/F) | 12/8 | 12/8 | 9/11 | 16/14 |
| FBG (mg/dL) | 164.25 ± 61.7c*,d | 180.5 ± 34.6d | 193.8 ± 16.5a*,d | 80 ± 7.9a,b,c |
| PPPG (mg/dL) | 249.35 ± 43.3c,d | 274.3 ± 32.7c*,d | 320.3 ± 79.0a,b*,d | 129.3 ± 10.8a,b,c |
| HbA1c (%) | 7.6 ± 0.84b*,c,d | 8.9 ± 0.7a*,c,d | 10.8 ± 2.5a,b,d | 4.8 ± 0.5a,b,c |
| UACR (mg/g) | 18.9 ± 7.1b,c | 126 ± 62.3a,c,d | 535.1 ± 144a,b,d | 16.9 ± 6.1b,c |
| Serum creatinine (mg/dL) | 1.12 ± 0.25b,c | 1.5 ± 0.2a,d | 1.7 ± 0.38a,d | 0.98 ± 0.2b,c |
| SBP (mm/Hg) | 145 ± 8c*,d | 150 ± 7d | 155 ± 16a*,d | 121 ± 3a,b,c |
| DBP (mm/Hg) | 88 ± 4d | 88 ± 4d | 90 ± 4d | 80 ± 3a,b,c |
| Duration of diabetes (Year) | 4.4 ± 0.9 | 9.6 ± 1.7 | 14.8 ± 2.1 |
Notes: P < 0.001 is denoted when
group I,
group II,
group III,
group IV,
P < 0.05.
Abbreviations: N, number of subjects; SD, standard deviation; M/F, male/female; FBG, fasting blood glucose; two-hour PPPG, two-hour postprandial plasma glucose; TC, total cholesterol; TG, triglyceride; SBP, systolic blood pressure; DBP, diastolic blood pressure.
IMA, MDA, and AOPP levels
Statistically significant difference was present in the mean of IMA, MDA, and AOPP in all three groups when compared with the control group (Table 2). IMA and AOPP levels in group II was significantly high when compared with groups I and IV, but no significant difference was found when compared with group III. Among the diabetes groups, group I had the lowest levels. Diabetic patients with early nephropathy (group II) were having highest MDA levels (18.6 ± 9.2 nmol/mL) as compared with groups I, III, and IV. However, the difference in the values of groups II and III was minimal and not statistically significant.
Table 2.
Comparison of serum IMA, MDA, AOPP, and albumin levels between groups stratified according to UACR status.
| GROUP I (N = 20) | GROUP II (N = 20) | GROUP III (N = 20) | GROUP IV (N = 30) | |
|---|---|---|---|---|
| IMA (ng/mL) | 109.4 ± 50.3b*,c,d | 154.5 ± 43.1a*,d | 178.1 ± 67.9a,d | 45.7 ± 23.9a,b,c |
| MDA (nmol/mL) | 13.9 ± 6.1 | 18.6 ± 9.2d* | 18.3 ± 6.5d* | 12.5 ± 5.2b*,c* |
| AOPP (ng/mL) | 7.5 ± 3.4b,c,d* | 12.4 ± 3.0a,d | 13.6 ± 4.6a,d | 4.89 ± 1.4a*,b,c |
| Albumin (g/dL) | 3.9 ± 0.4d* | 3.8 ± 0.2d* | 3.7 ± 0.25d | 4.2 ± 0.5a*,b*,c |
Notes: Data are expressed as mean ± standard deviation. P < 0.001 is denoted when
group I,
group II,
group III,
group IV,
P < 0.05.
Correlation of IMA, MDA, and AOPP
Pearson’s correlation was used to determine the influence of these markers in pathogenesis of nephropathy; serum levels of IMA, MDA, and AOPP were correlated with HbA1c, UACR, and serum creatinine (Table 3). Among the three analytes, only IMA had significant correlation with UACR in groups I, II, and III. IMA was also positively associated with serum creatinine in group III and with HbA1c in groups II and III. MDA had no association in group I, but was found to have positive association only with UACR in group II and with HbA1c in group III. AOPP was found to have significant correlation with HbA1C and UACR in groups II and III.
Table 3.
Correlation between serum IMA, MDA, AOPP with HbA1c, UACR, and serum creatinine in each group.
| HBA1c | UACR | CREATININE | |||
|---|---|---|---|---|---|
| IMA | Group I | r | 0.051 | 0.448* | 0.381 |
| p | 0.801 | 0.034 | 0.091 | ||
| Group II | r | 0.473* | 0.46* | 0.41 | |
| p | 0.029 | 0.03 | 0.06 | ||
| Group III | r | 0.509* | 0.502* | 0.445* | |
| p | 0.022 | 0.023 | 0.035 | ||
| MDA | Group I | r | 0.07 | 0.11 | 0.15 |
| p | 0.71 | 0.61 | 0.51 | ||
| Group II | r | 0.42 | 0.467* | 0.38 | |
| p | 0.06 | 0.04 | 0.09 | ||
| Group III | r | 0.463* | 0.39 | 0.22 | |
| p | 0.04 | 0.08 | 0.39 | ||
| AOPP | Group I | r | 0.17 | 0.33 | 0.03 |
| p | 0.46 | 0.15 | 0.80 | ||
| Group II | r | 0.452* | 0.453* | 0.36 | |
| p | 0.03 | 0.03 | 0.11 | ||
| Group III | r | 0.493* | 0.454* | 0.17 | |
| p | 0.03 | 0.03 | 0.46 |
Notes: Group I is DM with UACR < 30 mg/g, group II is early DN with UACR 30–300 mg/g, and group III is overt DN with UACR >300 mg/g of creatinine (20 in each group). UACR, urinary albumin/creatinine ratio.
P < 0.05.
The ROC curves were generated to evaluate and compare the diagnostic performance of the serum levels of IMA, MDA, and AOPP for differentiating between subjects with normal kidney function (UACR <30 mg/g) and those with UACR >30 mg/g (both with micro- and macroalbuminuria; Figure 1). Cutoff value for IMA to distinguish early DN in our study population was found to be ≥99 ng/mL at maximum sensitivity of 97.5% and specificity of 78%. We observed similar AUC for IMA (0.93) and AOPP (0.933) in comparison with MDA (0.746; Table 4).
Figure 1.
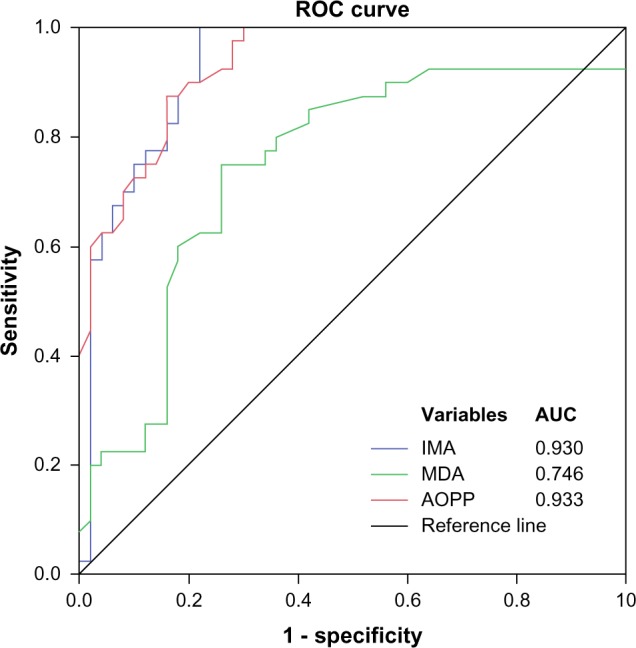
ROC curves (N = 90) for serum levels of IMA, MDA, and AOPP for differentiating individuals with normal renal function (normalbuminuria) and those with upper normal albuminuria (both micro- and macroalbuminuria).
Table 4.
Comparison of the diagnostic performance of IMA, MDA, and AOPP serum levels for distinguishing between renal function (normalbuminuria) and those with upper normal albuminuria (both micro- and macroalbuminuria).
| IMA (ng/ml) | MDA (nmol/ml) | AOPP (ng/ml) | |
|---|---|---|---|
| AUC | 0.930 | 0.746 | 0.933 |
| Cut off | 99 | 12.3 | 7.4 |
| Sensitivity | 0.975 | 0.80 | 0.975 |
| Specificity | 0.78 | 0.64 | 0.70 |
| PPV | 0.78 | 0.64 | 0.72 |
| NPV | 0.025 | 0.2 | 0.027 |
| +LR | 4.43 | 2.2 | 3.25 |
| +LR | 0.03 | 0.31 | 0.036 |
| DOR | 141.8 | 7.1 | 91 |
Notes: AUC, area under the curve; PPV, positive predictive value; NPV, negative predictive value; +LR, positive likelihood ratio; −LR, negative likelihood ratio; DOR, diagnostic odd ratio.
Discussion
The present study aimed to estimate the IMA, MDA, and AOPP levels in the serum of T2DM patients and find their correlation with the stage of DN, suggested by their HbA1c, UACR, and serum creatinine levels. In this study, higher mean levels of serum IMA were found in diabetes cases in comparison with controls. IMA increased progressively with the degree of albuminuria, supporting other studies.1,24 Among those with diabetes, lowest levels were observed in patients without microalbuminuria, which was significantly different from those in the micro- and macroalbuminuria groups, but there were no significant differences between micro- and macroalbuminuria patients.1
These results suggest that albumin modification occurs in the early stage of the disease provoked probably by hyperglycemia-induced stress and takes part in the pathogenesis of diabetic complications. IMA as an ischemic marker indicates underlying subclinical disease or vascular dysfunction in diabetic kidney, as suggested by Dash et al and Borderie et al.24,25 Analyzing the relationships between IMA and parameters applied in the routine diagnosis of renal dysfunction, significant correlation was found with the UACR in all the three groups. With serum creatinine, IMA correlated only in macroalbuminuria groups, which proves that IMA is a helpful marker for detecting early renal dysfunction.1
Recent observations have shown that increased ROS generation is directly proportional to hyperglycemia and oxidative protein damage.26,27 These changes profoundly influence cellular function and lead to abnormal renal vascular remodeling that lead to the development of DN.28 Hyperglycemia-induced ischemia, inflammation, and oxidative stress might increase the levels of IMA in the serum and also in the kidney, resulting in podocyte malfunction. Their excess accumulation along the extracellular matrix in the glomerulus and tubulointerstitium leads to vascular endothelial damage in diabetes.3,29–32
An increase in protein damage manifests as increased serum levels of AOPP and IMA. There are a fewer studies concerning AOPP in diabetes and hardly any of them correlating with the stages of DN.33–35 The levels of AOPP rose progressively and significantly with the degree of albuminuria. These findings were in support of the previous study by Piwowar et al.33 In agreement with the study by Fathy et al.36, our study found a significant correlation between AOPP, HbA1c, and UACR in T2DM patients with microalbuminuria as compared with diabetes patients without microalbuminuria.37 Increased serum AOPP promotes kidney inflammation in diabetes patients through the action of renal NADPH oxidase.38 Telci et al explained that damage to proteins may be more or occur earlier than damage to lipids during oxidative stress in vivo.39 Supporting this statement, the current study also reports significant correlation of IMA and AOPP with HbA1c, UACR, and serum creatinine in DN cases (micro- and macroalbuminuria patients) as compared with MDA.23,39 Our study also recorded increased MDA levels in diabetes cases compared with controls, and its correlation with HbA1c, UACR, and serum creatinine was found to be significant. These findings are indicative of hyperglycemia-induced oxidative stress, causing lipid peroxidation that leads to further exacerbation of renal injury in diabetes.
To evaluate the discriminatory power of the tests and their diagnostic utility, ROC analysis was used for IMA, MDA, and AOPP. Evaluation was done by their ability to distinguish individuals without any kidney disturbances (normoalbuminuria) from those with upper normal albuminuria, manifested by both micro- and macroalbuminuria. According to these criteria, the result showed highest and similar mean AUC for IMA and AOPP (0.930 and 0.933, respectively) in comparison with MDA (0.746). This indicates that after a certain period, oxidative stress-induced protein modification and inflammatory component are more strongly associated with endothelial damage and ischemia to cause DN than the oxidatively modified lipids.23 In an attempt to select appropriate cutoff values for the best marker of the three parameters from the ROC plot, it was found that IMA and AOPP were having the same sensitivity of 97.5%, but differed in specificity (78% and 70%, respectively). This indicates that IMA can be used with higher specificity to reveal individuals with upper normal albuminuria or early DN. In contrast to our finding, Piwowar et al.33 reported AOPP as a better marker than IMA, but the current study found that serum IMA levels of ≥99 ng/mL are ideal for differentiating these patients because of its high value of specificity, positive predictive value, and positive likelihood ratio.32
Strengths and Limitations
IMA, MDA, and AOPP were estimated by ELISA technique, which is a more sensitive method as compared with several previous spectrophotometric techniques. To nullify the effect of serum albumin on IMA and AOPP levels, the current study included only those subjects having serum albumin level between 3 and 5.5 g/dL. A potential limitation could be the cross-sectional design from which the cause and effect relationship cannot be established. Large-scale longitudinal prospective studies are required to add on to the existing knowledge and to establish the significance of IMA as an early marker of oxidative stress-induced vascular injury in the pathogenesis of DN.
Conclusion
The current study supports the essential relationship between the serum levels of IMA in type 2 diabetes patients and its utility in predicting vascular damage in DN. Increase in serum IMA level was more marked in diabetes without microalbuminuria and early DN cases compared with normal individuals, reinforcing the hypothesis that estimation of serum IMA may be used as a diagnostic marker to assess early detection and progression of nephropathy in diabetes. The clinical significance of IMA lies in its high negative predictive value, which may help in excluding the presence of early DN in a population. A cutoff value ≥99 ng/mL of serum IMA, as determined in this study, may help clinicians to diagnose early DN among normoalbuminuria cases or diabetes without microalbuminuria, which may help in the prognosis of the disease as well. Hence, along with the established markers such as serum creatinine and UACR, serum IMA estimation can be used as an auxiliary marker for early detection of DN.
Footnotes
ACADEMIC EDITOR: Karen Pulford, Editor in Chief
PEER REVIEW: Four peer reviewers contributed to the peer review report. Reviewers’ reports totaled 554 words, excluding any confidential comments to the academic editor.
FUNDING: Funds for the study were received from the Research Society for the Study of Diabetes in India (RSSDI). The authors confirm that the funder had no influence over the study design, content of the article, or selection of this journal.
COMPETING INTERESTS: Authors disclose no potential conflicts of interest.
Paper subject to independent expert blind peer review. All editorial decisions made by independent academic editor. Upon submission manuscript was subject to anti-plagiarism scanning. Prior to publication all authors have given signed confirmation of agreement to article publication and compliance with all applicable ethical and legal requirements, including the accuracy of author and contributor information, disclosure of competing interests and funding sources, compliance with ethical requirements relating to human and animal study participants, and compliance with any copyright requirements of third parties. This journal is a member of the Committee on Publication Ethics (COPE).
Author Contributions
Conceived and designed the experiments: AfA, PM. Analyzed the data: AfA, AsA. Contributed to the writing of the manuscript: PM, CY, AfA, AsA. Jointly developed the structure and arguments for the paper: PM, AfA, RMS, AH. Made critical revisions and approved the final version: PM, AfA, CY. All the authors reviewed and approved the final manuscript.
REFERENCES
- 1.Piwowar A, Kordecka MK, Warwas M. Connection between ischemia-modified albumin levels and markers of diabetic nephropathy and oxidative protein damage in type 2 diabetic patients. Adv Clin Exp Med. 2009;18(4):353–60. [Google Scholar]
- 2.Moresco RN, Sangoi MB, De Carvalho JA, Tatsch E, Bochi GV. Diabetic nephropathy: traditional to proteomic markers. Clin Chim Acta. 2013;421:17–30. doi: 10.1016/j.cca.2013.02.019. [DOI] [PubMed] [Google Scholar]
- 3.Booya F, Bandarian F, Larijani B, Pajouhi M, Nooraei M, Lotfi J. Potential risk factors for diabetic neuropathy: a case control study. BMC Neurol. 2005;5:24. doi: 10.1186/1471-2377-5-24. [DOI] [PMC free article] [PubMed] [Google Scholar]
- 4.Retnakaran R, Cull CA, Thorne KI, Adler AI, Holman RR, UKPDS Study Group Risk factors for renal dysfunction in type 2 diabetes: U.K. Prospective Diabetes Study 74. Diabetes. 2006;55:1832–9. doi: 10.2337/db05-1620. [DOI] [PubMed] [Google Scholar]
- 5.Behl T, Kaur I, Goel H, Pandey RK. Diabetic nephropathy and diabetic retinopathy as major health burdens in modern era. WJPPS. 2014;3(7):370–87. [Google Scholar]
- 6.Fiseha T. Urinary biomarkers for early diabetic nephropathy in type 2 diabetic patients. Biomark Res. 2015;3:16. doi: 10.1186/s40364-015-0042-3. [DOI] [PMC free article] [PubMed] [Google Scholar]
- 7.Cohen MP, Lautenslager GT, Shearman CW. Increased collagen IV excretion in diabetes. A marker of compromised filtration function. Diabetes Care. 2001;24:914–8. doi: 10.2337/diacare.24.5.914. [DOI] [PubMed] [Google Scholar]
- 8.Isakova T, Xie H, Yang W, et al. Chronic Renal Insufficiency Cohort (CRIC) Study Group Fibroblast growth factor 23 and risks of mortality and end-stage renal disease in patients with chronic kidney disease. JAMA. 2011;305:2432–9. doi: 10.1001/jama.2011.826. [DOI] [PMC free article] [PubMed] [Google Scholar]
- 9.Barratt J, Topham P. Urine proteomics: the present and future of measuring urinary protein components in disease. CMAJ. 2007;177:361–8. doi: 10.1503/cmaj.061590. [DOI] [PMC free article] [PubMed] [Google Scholar]
- 10.Kim SS, Song SH, Kim IJ, et al. Clinical implication of urinary tubular markers in the early stage of nephropathy with type 2 diabetic patients. Diabetes Res Clin Pract. 2012;97:251–7. doi: 10.1016/j.diabres.2012.02.019. [DOI] [PubMed] [Google Scholar]
- 11.Ma SG, Jin Y, Hu W, Bai F, Xu W, Yu WN. Evaluation of ischemia-modified albumin and C reactive protein in type 2 diabetics with and without ketosis. Biomark Insights. 2012;7:19–26. doi: 10.4137/BMI.S9060. [DOI] [PMC free article] [PubMed] [Google Scholar]
- 12.Piwowar A, Knapik-Kordecka M, Warwas M. Ischemia-modified albumin level in type 2 diabetes mellitus – preliminary report. Dis Markers. 2008;24(6):311–7. doi: 10.1155/2008/784313. [DOI] [PMC free article] [PubMed] [Google Scholar]
- 13.Apple FS, Wu AH, Mair J, et al. Future biomarkers for detection of ischemia and risk stratification in acute coronary syndrome. Clin Chem. 2005;51:810–24. doi: 10.1373/clinchem.2004.046292. [DOI] [PubMed] [Google Scholar]
- 14.Van Rijn BB, Franx A, Sikkema JM, Van Rijn HJ, Bruinse HW, Voorbij HA. Ischemia modified albumin in normal pregnancy and preeclampsia. Hypertens Pregnancy. 2008;27:159–67. doi: 10.1080/10641950701885147. [DOI] [PubMed] [Google Scholar]
- 15.Knapik Kordecka M, Piwowar A, Zurawska Plaksej E, Warwas M. Ischemia modified albumin-specific marker in cardiological diagnostics? Wiad Lek. 2008;61:263–8. [PubMed] [Google Scholar]
- 16.Sbarouni E, Georgiadou P, Kremastinos DT, Voudris V. Ischemia modified albumin: is this marker of ischemia ready for prime time use? Hellenic J Cardiol. 2008;49:260–6. [PubMed] [Google Scholar]
- 17.Maritim AC, Sanders RA, Watkins JB., III Diabetes, oxidative stress and antioxidants. J Biochem Mol Toxicol. 2003;17:24–38. doi: 10.1002/jbt.10058. [DOI] [PubMed] [Google Scholar]
- 18.Palanduz S, Ademoglu E, Gokkuşu C, Tamer S. Plasma antioxidants and type 2 DM. Res Commun Mol Pathol Pharmacol. 2001;109:309–18. [PubMed] [Google Scholar]
- 19.Janero DR. Malondialdehyde and thiobarbituric acid-reactivity as diagnostic indices of lipid peroxidation and peroxidative tissue injury. Free Radic Biol Med. 1990;9:515–40. doi: 10.1016/0891-5849(90)90131-2. [DOI] [PubMed] [Google Scholar]
- 20.Marnette LJ. Generation of mutagens during arachidonic acid metabolism. Cancer Metastasis Rev. 1999;13:303–8. doi: 10.1007/BF00666100. [DOI] [PubMed] [Google Scholar]
- 21.Kaefer M, De Carvalho JA, Piva SJ, et al. Plasma malondialdehyde levels and risk factors for the development of chronic complications in type 2 diabetic patients on insulin therapy. Clin Lab. 2012;58:973–8. [PubMed] [Google Scholar]
- 22.Skvarilova M, Bulava A, Stejskal D, Adamovska S, Bartek J. Increased level advanced oxidation products (AOPP) as a marker of oxidative stress in patients with acute coronary syndrome. Biomed Pap Med Fac Univ Palacky Olomouc Czech Repub. 2005;149(1):83–7. [PubMed] [Google Scholar]
- 23.Sharada HM, Abdalla MS, Amin AI, Khouly SA, El-Sherif HA. Plasma levels of oxidation protein products in type 2 diabetic patients with nephropathy. Aust J Basic Appl Sci. 2012;6(7):537–44. [Google Scholar]
- 24.Dash P, Mangaraj M, Ray S. Physiobiochemical metabolism ischaemia modified albumin-an indicator of widespread endothelial damage in diabetes. J Physiobiochem Metab. 2014;3:1. [Google Scholar]
- 25.Borderie D, Allanore Y, Meune C, Devaux JY, Ekindjian OG, Kahan A. High ischemia-modified albumin concentration reflects oxidative stress but not myocardial involvement in systemic sclerosis. Clin Chem. 2004;50:2190–3. doi: 10.1373/clinchem.2004.034371. [DOI] [PubMed] [Google Scholar]
- 26.Ceriello A. Acute hyperglycaemia: a “new” risk factor during myocardial infarction. Eur Heart J. 2005;26:328–31. doi: 10.1093/eurheartj/ehi049. [DOI] [PubMed] [Google Scholar]
- 27.Ceriello A, Motz E. Is oxidative stress the pathogenic mechanism underlying insulin resistance, diabetes, and cardiovascular disease? The common soil hypothesis revisited. Artheroscler Thromb Vasc Biol. 2004;24:816–23. doi: 10.1161/01.ATV.0000122852.22604.78. [DOI] [PubMed] [Google Scholar]
- 28.Wadham C, Parker A, Wang L, Xia P. High glucose attenuates protein S-nitrosylation in endothelial cells: role of oxidative stress. Diabetes. 2007;56(27):15–21. doi: 10.2337/db06-1294. [DOI] [PubMed] [Google Scholar]
- 29.Cohen-Bucay A, Viswanathan G. Urinary markers of glomerular injury in diabetic nephropathy. Int J Nephrol. 2012;2012:146987. doi: 10.1155/2012/146987. [DOI] [PMC free article] [PubMed] [Google Scholar]
- 30.Garg JP, Bakris GL. Microalbuminuria: marker of vascular dysfunction, risk factor for cardiovascular disease. Vasc Med. 2002;7:35–43. doi: 10.1191/1358863x02vm412ra. [DOI] [PubMed] [Google Scholar]
- 31.Vaidya VS, Waikar SS, Ferguson MA, et al. Urinary biomarkers for sensitive and specific detection of acute kidney injury in humans. Clin Transl Sci. 2008;1:200–8. doi: 10.1111/j.1752-8062.2008.00053.x. [DOI] [PMC free article] [PubMed] [Google Scholar]
- 32.Titan SM, Vieira JM, Jr, Dominguez WV, et al. Urinary MCP-1 and RBP: independent predictors of renal outcome in macroalbuminuric diabetic nephropathy. J Diabetes Complications. 2012;26:546–53. doi: 10.1016/j.jdiacomp.2012.06.006. [DOI] [PubMed] [Google Scholar]
- 33.Piwowar A, Knapik-Kordecka M, Warwas M. Comparison of the usefulness of plasma levels of oxidatively modified forms of albumin in estimating kidney dysfunction in diabetic patients. Clin Investig Med. 2010;33(2):109–16. doi: 10.25011/cim.v33i2.12349. [DOI] [PubMed] [Google Scholar]
- 34.Tsukahara H, Sekine K, Uchiyama M, et al. Formation of advanced glycosylation end products and oxidative stress in young patients with type 1 diabetes. Pediatr Res. 2003;54(3):419–24. doi: 10.1203/01.PDR.0000076662.72100.74. [DOI] [PubMed] [Google Scholar]
- 35.Pan HZ, Zhang L, Guo MY, et al. The oxidative stress status in diabetes mellitus and diabetic nephropathy. Acta Diabetol. 2010;47(suppl 1):71–6. doi: 10.1007/s00592-009-0128-1. [DOI] [PubMed] [Google Scholar]
- 36.Fathy SA, El-Habashy SA, Rasheed WI, et al. Diagnostic potential of oxidative stress indicators in Egyptian type 1 diabetic children and adolescents. J Appl Sci Res. 2009;5(12):2524–34. [Google Scholar]
- 37.Kostolanska J, Jakus V, Barak L. HbA1c and serum levels of advanced glycation and oxidation protein products in poorly and well controlled children and adolescents with type 1 diabetes mellitus. J Pediatr Endocrinol Metab. 2009;22(5):433–42. doi: 10.1515/jpem.2009.22.5.433. [DOI] [PubMed] [Google Scholar]
- 38.Shi XY, Hou FF, Niu HX, et al. Advanced oxidation protein products promote inflammation in diabetic kidney through activation of renal nicotinamide adenine dinucleotide phosphate oxidase. Endocrinology. 2008;149(4):1829–39. doi: 10.1210/en.2007-1544. [DOI] [PubMed] [Google Scholar]
- 39.Telci A, Cakatay U, Kayali R, Erdoan F, Orhan Y, Sivas A. Oxidative protein damage in plasma of type 2 diabetic patients. Horm Metab Res. 2000;32:40–3. doi: 10.1055/s-2007-978584. [DOI] [PubMed] [Google Scholar]