Abstract
A new sheathless transient capillary isotachophoresis (CITP)/capillary zone electrophoresis (CZE)–MS interface, based on a commercially available capillary with an integrated metal-coated ESI emitter, was developed in this study aiming at overcoming the reproducibility and ruggedness problems suffered to a certain degree by almost all the available CE–MS interfaces, and pushing the CE–MS technology suitable for routine sample analysis with high sensitivity. The new CITP/CZE–MS interface allows the electric contact between ESI voltage power supply and the CE separation liquid by using a conductive liquid that comes in contact with the metal-coated surface of the ESI emitter, making it a true sheathless CE–MS interface. Stable electrospray was established by avoiding the formation of gas bubbles from electrochemical reaction inside the CE capillary. Crucial operating parameters, such as sample loading volume, flow rate, and separation voltage, were systematically evaluated for their effects on both CITP/CZE separation efficiency and MS detection sensitivity. Around one hundred CITP/CZE–MS analyses can be easily achieved by using the new sheathless CITP/CZE interface without a noticeable loss of metal coating on the ESI emitter surface, or degrading of the ESI emitter performance. The reproducibility in analyte migration time and quantitative performance of the new interface was experimentally evaluated to demonstrate a LOQ below 5 attomole.
Graphical Abstract
Recent advances in capillary electrophoresis mass spectrometry (CE–MS) have made the technique a promising alternative to the conventional liquid chromatography (LC)–MS techniques in proteomics analysis.1–9 CE coupled with a triple quadruple MS operating in a selected reaction monitoring (SRM) mode has proven to be very effective in sample quantitation.1,10 By using transient capillary isotachophoresis (CITP)/capillary zone electrophoresis (CZE)–SRM MS, a hybrid CE separation technique allowing a significantly increased sample loading volume without degrading the separation quality,11 a limit of quantitation (LOQ) below 50 picomolar (pM) analyte concentration was demonstrated initially by using a sample loading volume at 30% of the total separation capillary volume in CITP/CZE–SRM MS.10
The online coupling of CE with MS is achieved in general by two different types of interfaces: a sheath liquid interface3,12 or a sheathless interface.13–15 In a sheath liquid interface, the sheath liquid is used to allow the addition of a second high voltage at the exit of the CE separation capillary for the generation of a stable electrospray.16 Although a robust coupling of CE with MS can be achieved by the sheath liquid interface, significant sample dilution by the sheath liquid in the original interface design12 limits the achievable CE–MS sensitivity. To overcome the sample dilution problem in the sheath flow CE–MS interface design, significant development effort has been focused on minimizing the flow rate of sheath liquid. A new sheath flow CE–MS interface was recently reported3 in which a nanoliter per minute sheath flow was used to minimize the sample dilution. Extremely high sensitivity CZE–MS analysis with an estimated detection limit of 1 zeptomole was demonstrated by using a 10-μm inner diameter (i.d.) separation capillary.3 The stability of this interface was further improved by using a larger i.d. emitter, and the sensitivity of the CE–MS was maintained by carefully shortening the distance between the exit of the separation capillary and the tip of the ESI emitter.17 Aiming at completely eliminating the sample dilution in the sheath liquid CE–MS interfaces, several sheathless interfaces were developed by using a coated emitter to close the electrical circuit for the CE separation voltage and the electrospray ionization (ESI) voltage. Various electrically conductive materials were used to coat the ESI emitter, including gold,18,19 silver,20 copper,21 graphite,22,23 and conductive polymer.24 Tapered emitters with shrinking inner diameter were used in all coated emitter sheathless CE–MS interface designs, which are prone to clogging and reproducibility problems. The fragile connection between the ESI voltage power supply and coated ESI emitter using a thin metal wire, attached directly to the coated emitter, also made the interface lack robustness for routine CE–MS analysis. For example, Kele et al. found that a metal-coated emitter can only be used for several CE–MS analyses before the necessary replacement of the emitter.25 To overcome these problems in all coated emitter CE–MS interfaces, a novel sheathless interface using a chemically etched porous ESI emitter was recently developed by Moini et al. showing a much improved CE–MS performance26 and has led to several successful applications.6–9,27–30 This porous emitter sheathless CE–MS interface design was further refined recently by allowing a larger i.d. separation capillary to be coupled with a smaller i.d. porous ESI emitter via a seamless joint to achieve both large sample loading volume and nanoflow rate ESI (nanoESI) operation.13 Applying this improved interface to the CITP/CZE–SRM MS quantification of targeted peptides in complex biomatrix demonstrated a limit of quantitation (LOQ) as low as 10 pM.13 Although excellent sensitivity was achieved by the porous emitter sheathless CE–MS interface and the interface has also been commercialized by Beckman Coulter CE group (now part of SCIEX separations), it becomes apparent that the fabrication of the porous emitter in the laboratory environment is a difficult-to-control process that can be easily affected by minor variations of the etch solution concentration, total etching time, and the capillary dimension, making the reproducibility of the porous emitters problematic among different emitter batches which subsequently requires different ESI voltages for the stable electrospray operation.
To combine the advantages of sheath liquid and sheathless CE–MS interfaces and avoid their corresponding problems, we describe here a new sheathless CE–MS interface that is easy to fabricate and assemble, robust to CE–MS analysis, and has much improved reproducibility. The new sheathless CE–MS interface used a commercially available capillary with an integrated metal-coated ESI emitter (i.e., a metal-coated emitter that was an integral part of the CE separation capillary and had a same constant i.d. and a tapered outer diameter (o.d.)). The electric contact between the ESI voltage power supply and the CE separation liquid was accomplished by using an electrically conductive liquid that came in contact with the metal-coated outer surface of the emitter. The performance of the new sheathless CE–MS interface in terms of its robustness, durability, and reproducibility was systematically evaluated by the CITP/CZE–SRM MS quantification of targeted peptides in biomatrix. The achievable sensitivity of the new interface was further evaluated for its achievable LOQ.
EXPERIMENTAL SECTION
Reagents
Kemptide, angiotensin I, angiotensin II, bradykinin, leucine Enkephalin, neurotensin, angiotensinogen (1–14), substance P, fibrinopeptide A, ammonium acetate, methanol, and acetic acid were purchased from Sigma-Aldrich (St. Louis, MO). BSA tryptic digest standard was purchased from Protea (Morgantown, WV). A special integrated fused silica capillary serving as both CE separation capillary and ESI emitter was purchased as a customized product from New Objective, Inc. (Woburn, MA). The capillary and the ESI emitter maintained a constant i.d. and had a tapered o.d. at the emitter end. The external surface, about 2 cm from the tip of the emitter, was coated with a thin layer of platinum.
Sample Preparation
The background electrolyte (BGE) solution used for CE separation in this study was a solution of 0.1 M acetic acid in 9:1 volume ratio of deionized water to methanol. The leading electrolyte (LE) solution was a solution of 25 mM ammonium acetate in deionized water with pH adjusted to a value of 4 by using acetic acid.
Individual stock solutions of nine peptide standards including Kemptide, angiotensin I, angiotensin II, bradykinin, leucine Enkephalin, neurotensin, angiotensinogen (1–14), substance P, and fibrinopeptide A was first prepared at 2 mM concentration in deionized water. The individual peptide stock solutions were then mixed and diluted with LE solution to form a peptide mixture stock solution containing 20 μM of each peptide. The peptide mixture stock solution was further diluted to 2 μM concentration for each peptide with LE in the CITP/CZE parameter optimization experiments. For CITP/CZE–SRM MS quantification the nine peptide mixture was spiked into a solution of 50 nM BSA tryptic digest in LE solution at different concentrations ranging from 0.025 to 500 nM.
Sheathless CITP/CZE–MS Interface
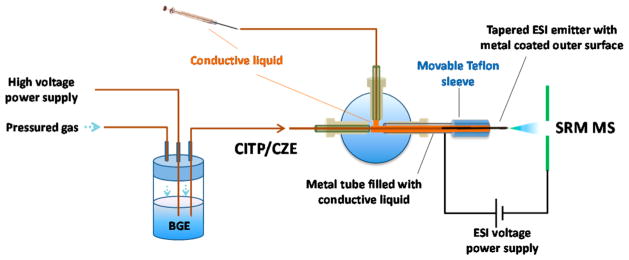
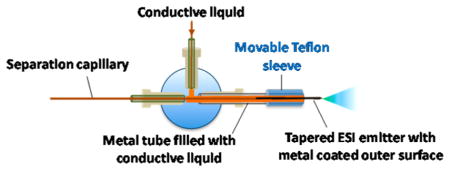
Figure 1 shows the experimental setup of the new sheathless CITP/CZE–MS used in this study. The leading end of the separation capillary (360 μm o.d., 30 μm i.d., and 1 m long) was inserted into a sealed liquid reservoir pressurized with nitrogen for sample loading or peak elution during the CE separation. The CE separation voltage was applied to the liquid via a platinum wire inserted into the reservoir. Preconditioning/regeneration of the separation capillary between sample analyses was done by flushing the capillary with BGE for at least 50-fold of the capillary volume. The BGE was prefiltered by using a 0.5-μm pore size filter (Valco Instruments, TX). The ESI emitter end of the capillary had a tapered o.d., the external surface of which was coated with a thin layer of platinum for electric conductivity. The majority of the metal-coated surface of the emitter was further enclosed in a larger metal tube (1.59 mm o.d., 1 mm i.d., and 30 mm long) filled with electrically conductive liquid (10% acetic acid in deionized water). The metal-coated emitter tip protruded about 5 mm out of the metal tube for stable electrospray operation and preventing the contact liquid from mixing with the separation liquid inside of the capillary. The whole sheathless interface was assembled together by using a metal tee. As shown in Figure 1, the left arm of the tee was used to fix the separation/emitter capillary. The right arm of the tee was used to fix the metal tube. The top arm of the tee was connected to a syringe filled with conductive liquid so that the conductive liquid could be refreshed between sample analyses to prevent ion depletion in the solution and the bubble accumulation generated by the electrochemical reaction at the metal surface. The ESI voltage was applied directly to the metal tube. The electric contact between the ESI voltage power supply and the separation liquid for stable electrospray operation was done through the contact among the metal tube, the conductive liquid, and the metal-coated surface of the emitter, making the interface a truly sheathless one. The new interface also effectively avoided the disruptive gas bubble problem. The electrochemical reaction occurred at the ESI emitter tip in the new interface appears to have no effect on either the CE separation or the stability of the electrospray possibly due to a quick removal of the gas by the separation liquid and the electrospray before the formation of the disruptive gas bubbles. To ensure stable nanoESI operation, a small and constant i.d. (30 μm) capillary with a same i.d. and tapered o.d. integrated ESI emitter was used to effectively avoid the clogging problem and make the CE–MS analysis highly reproducible. To suppress the electroosmotic flow, the inner surface of the separation capillary was coated with hydroxypropyl cellulose. The capillary coating was prepared by following the previously published procedure.13 Briefly, the capillary was flushed in sequence with 1 M HCl, 5% hydroxylpropyl cellulose, and deionized water in sufficient number of capillary volumes.
Figure 1.
Schematic of the new sheathless CITP/CZE–nanoESI–MS setup.
All the buffers and samples used in the experiments were prepared with prefiltered deionized water. Prior to each run, the separation capillary was preconditioned by flushing BGE through the capillary with over 50-fold capillary volume. Sample was then loaded into the separation capillary by applying 5 psi nitrogen back pressure to the sample reservoir, as shown in Figure 1. The sample loading volume was adjusted by varying the length of the loading time. Immediately after sample loading, the sample reservoir was replaced by the BGE reservoir and the separation voltage varying from 20 to 30 kV was applied to the BGE reservoir using a Glassman high-voltage power supply, and a second nanoESI voltage of 2.2 kV was applied to the metal tube. During the sample loading step and the first 15 min of CITP/CZE separation, the metal-coated emitter was protected by a movable Teflon tube filled with the same electric contact liquid as in the metal tube. This initial step ensured a maximum CZE separation time at a given length of the separation capillary as the initial sample focusing by the CITP process was accomplished at a zero liquid flow rate. Fifteen minutes after CITP/CZE separation, small nitrogen back pressure ranging from 1 to 3 psi, referring to as eluting pressure, was applied to the BGE reservoir to allow a liquid flow in the capillary. The metal-coated ESI emitter tip was exposed by moving back the protective Teflon tubing to form a stable electrospray. The MS data acquisition was started at 18 min. The position between the emitter and the MS inlet was adjusted to obtain a stable electrospray with the aid of a digital camera incorporated with the nanoESI source. The liquid flow rate during CITP/CZE separation at different eluting pressures was measured by using a calibrated pipet (1–5 μL, Drummond Scientific, Broomall, PA) as described in detail in our previous study.13 The liquid flow rates for the eluting pressures ranging from 1 to 5 psi used in this study are listed in Supporting Information Table S1 for reference purposes.
MS Analysis and Data Processing
All the CITP/CZE–MS analyses were performed by coupling the new sheathless CITP/CZE–nanoESI interface with triple quadruple mass spectrometry (TSQ Quantum XLS, Thermo Fisher Scientific, MA). An m/z range from 400 to 1400 was used in full scan MS data acquisition. For SRM MS analysis, Q1 and Q3 were both set at a unit resolution. All the MS spectra were recorded in centroid mode. The three most intense transitions and their corresponding collision energies for each selected peptide target were automatically determined using automated tuning procedure built in the Thermo TSQ data acquisition software. Table S2 lists all the transitions for the nine targeted peptides used in this study.
The RAW SRM MS data were imported into Skyline software31 for data analysis and to display graphs of extracted ion chromatographs (XICs) for quantitative analysis. The full scan MS data were analyzed by using Thermo Xcalibur Qual Browser 2.2. Base peak extraction of SRM MS data was also processed by using the same Xcalibur Qual Browser.
RESULTS AND DISCUSSION
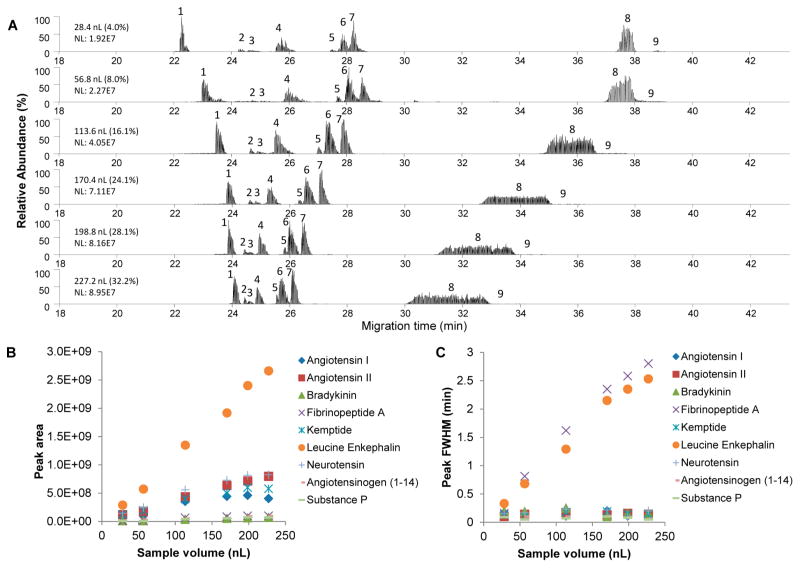
The new sheathless CITP/CZE–MS interface was first evaluated for its separation characteristics and sensitivity under different sample loading volumes using a mixture of nine peptide standards with 2 μM concentration for each peptide in the mixture. Sample loading volume was varied by changing the loading time at a fixed 5 psi nitrogen back pressure applied to the sample reservoir which corresponds to a sample loading flow rate of 28.4 nL/min. Figure 2a shows the base peak chromatograms from CITP/CZE–SRM MS data acquisitions at the selected sample loading times of 1, 2, 4, 6, 7, and 8 min with the corresponding sample loading volumes (percentage of total capillary volume) of 28.4 (4.0%), 56.8 (8.0%), 113.6 (16.1%), 170.4 (24.1%), 198.8 (28.1%), and 227.2 nL (32.2%), respectively. A constant peak elution pressure of 1 psi was used during the experiment which corresponded to a 5.7 nL/min liquid flow rate for the nanoESI. CE separation voltage and the nanoESI voltage were fixed at 30 kV and 2.2 kV, respectively, during the experiment. The results in Figure 2a indicate that while the peak intensity increases as the sample loading volume increases, the total separation window narrows with the increase of the sample loading volume, indicating a trade-off between the CITP/CZE separation quality and the CITP/CZE–MS sensitivity primarily due to an increased sample stacking time needed for an increased sample loading volume in the CITP/CZE separation.
Figure 2.
Effects of the sheathless CITP/CZE–SRM MS analyses at different sample injection volumes on (A) base peak chromatogram, (B) peak area, and (C) peak fwhm. The labeled peaks from 1 to 9 are Kemptide, substance P, bradykinin, angiotensin I, angiotensinogen (1–14), neurotensin, angiotensin II, leucine Enkephalin, and fibrinopeptide A, respectively.
Figures 2b and 2c further show the changes of peak area and peak width at half-maximum (fwhm) as the sample loading volumes changed. The peak area was shown to increase almost linearly with the increase of the sample loading volume under the tested sample loading volume range, which is similar to what was observed in our previous study.10 Different peptides show the different slopes of response between the peak area and the sample loading volume due to their different ESI efficiencies. Leucine enkephalin was shown to be the most sensitive compound among the nine peptides. The fwhm, as shown in Figure 2c, increases as the sample loading volume increases. This is consistent with the fundamental principle of sample stacking in the CITP process in which a sample reaches a same final concentration under a given CITP/CZE separation condition and sample solution. Early-eluting peptides, such as Kemptide, show a relatively narrower fwhm indicating a better sample focusing due to its higher mobility as compared to the later eluting peptides in the mixture. This is also consistent with the CITP sample stacking mechanism and our previous study using a different CITP/CZE–MS interface.13 Combined with a good ESI efficiency, Kemptide was subsequently used as a targeted peptide in the performance evaluation of the achievable LOQ for the new sheathless CITP/CZE–SRM MS.
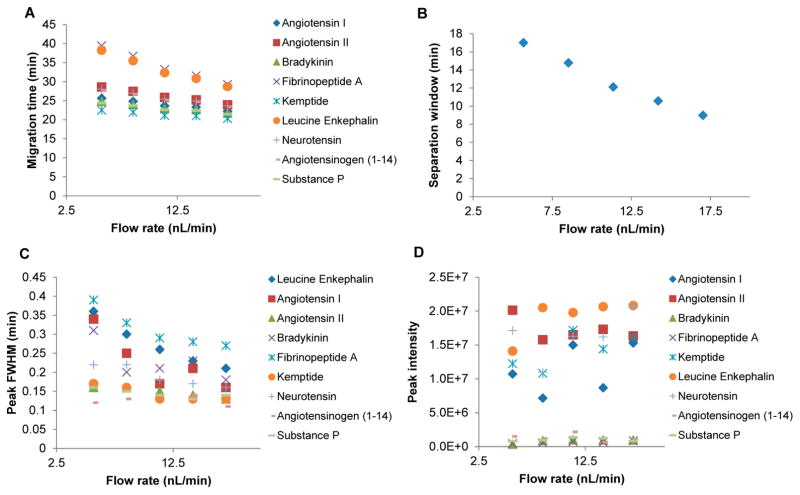
The effects of liquid flow rate on the CITP/CZE separation and the SRM MS sensitivity at a constant separation voltage of 30 kV were also systematically evaluated, as shown in Figure 3, by varying the eluting pressure applied to the BGE reservoir ranging from 1 to 3 psi which corresponded to the flow rate range of 5.7 to 17 nL/min based on the experimental measurements. Both peak migration time (Figure 3a) and CITP/CZE separation window (Figure 3b) decrease as the flow rate increases. The dependence of peak fwhm on the flow rate (Figure 3c) varies among different peptides in the mixture. For the early-eluting peptides, such as Kemptide and substance P, their peak FWHMs remain essentially constant in the tested flow rate range, while for the later-eluting peptides, such as fibrinopeptide A and luecine Enkephalin, their peak FWHMs decrease significantly as the liquid flow rate increases. Because of the significant decrease in peak migration window, which shows almost a linear dependence on the liquid flow rate, the overall separation quality (or peak capacity) decreases as the flow rate increases. The peak intensities for all the peptides remain essentially independent of the liquid flow rate indicating the sensitivity of the SRM MS is largely limited by the MS heated inlet capillary in the tested flow rate range.
Figure 3.
Effects of the sheathless CITP/CZE–SRM MS analyses at different flow rates on (A) peak migration time, (B) separation window, (C) peak fwhm, and (D) peak intensity.
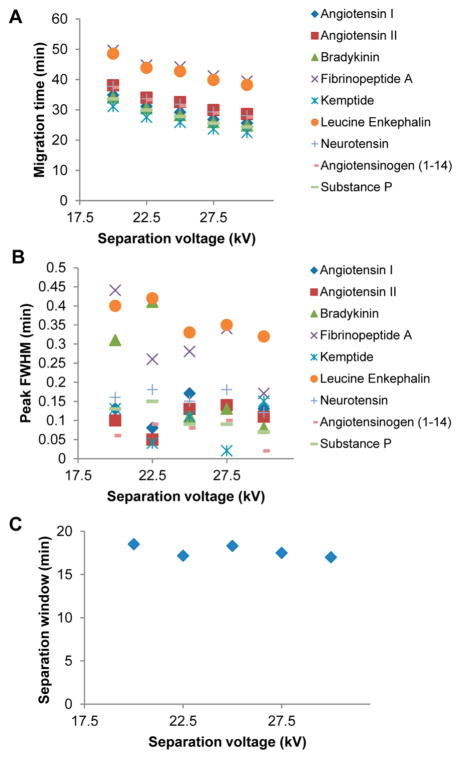
Figure 4 further shows the effects of separation voltage on the CITP/CZE separation in the voltage range of 20–30 kV. With a constant sample loading of 28.4 nL, both the peak migration (elution) time (Figure 4a) and the peak fwhm (Figure 4b) decrease as the separation voltage increases, while the CITP/CZE separation window remains essentially constant at about 18 min (Figure 4c) for the tested separation voltage range. This indicates an increased separation peak capacity at a higher separation voltage.
Figure 4.
Effects of the sheathless CITP/CZE–SRM MS analyses at different separation voltages on (A) peak migration time, (B) peak fwhm, and (C) separation window.
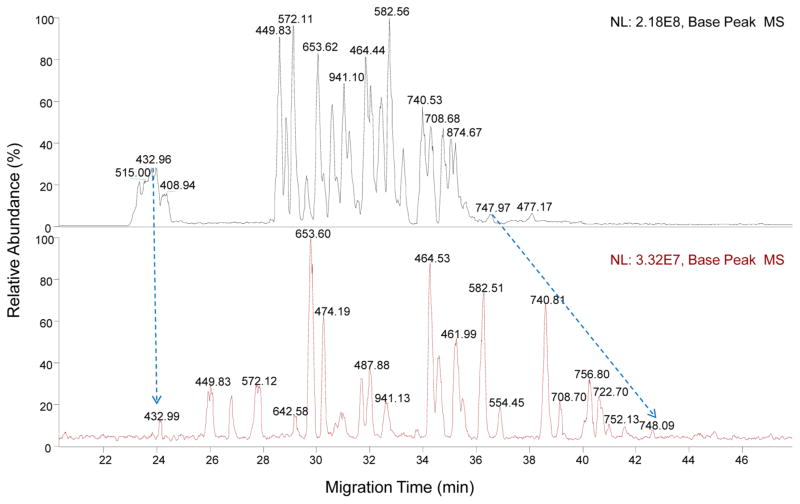
To evaluate the overall achievable peak capacity of the new CE–MS interface, the tryptic BSA digest was used for CITP/CZE–MS analysis at two sample loading volumes of 28.4 and 198.8 nL, respectively. During the experiment, the flow rate and separation voltage remained constant at 5.7 nL/min and 30 kV, respectively, for the optimum separation quality. The chromatograms shown in Figure 5 indicate again a trade-off between the sensitivity and the separation quality at different sample loading volumes. Specifically, the peak intensity increases about 7-fold for a 7-fold increase in sample loading volume, while the separation window narrows by about 30%. Most peptide peaks from the tryptic BSA digest can be easily identified based on their m/z values at both sample loading volumes with a similar peak elution order, as labeled in Figure 5. With 28.4-nL sample loading volume, a better CTIP/CZE separation can be achieved. The peak capacity of CITP/CZE separation at 28.4 nL sample loading volume was further estimated based on the extracted peak fwhm and the measured peak separation window from the annotated peaks (Table S3). Specifically, with an averaged fwhm of 0.174 min for 45 annotated BSA peptide peaks and a peak migration window of 22.18 min (i.e., between first annotated peak migration time at 24.13 min and the last annotated peak migration time 46.31 min), the peak capacity was estimated at 127.5.
Figure 5.
Sheathless CITP/CZE–MS analyses of BSA tryptic digests at different sample injection volumes of 198.8 nL (upper) and 28.4 nL (lower).
To assess the effectiveness of the new sheathless CITP/CZE interface in peptide quantification, CITP/CZE–SRM MS sample quantification was performed to evaluate the achievable sensitivity and analysis reproducibility by using the same mixture of nine peptide standards spiked into 50 nM BSA digest matrix at different concentrations. To maximize the achievable LOQ, large sample loading volume at 198.8 nL (28.1%) combined with the optimum CITP/CZE separation condition at the separation voltage of 30 kV and the flow rate of 5.7 nL/min, were used for the CITP/CZE-SRM MS analyses. Three precursor-to-fragment transitions, as listed in Table S2, were monitored for each targeted peptide in the BSA digest matrix in the experiments, with the most sensitive transition being used to measure the LOQ of the new sheathless CITP/CZE–SRM MS.
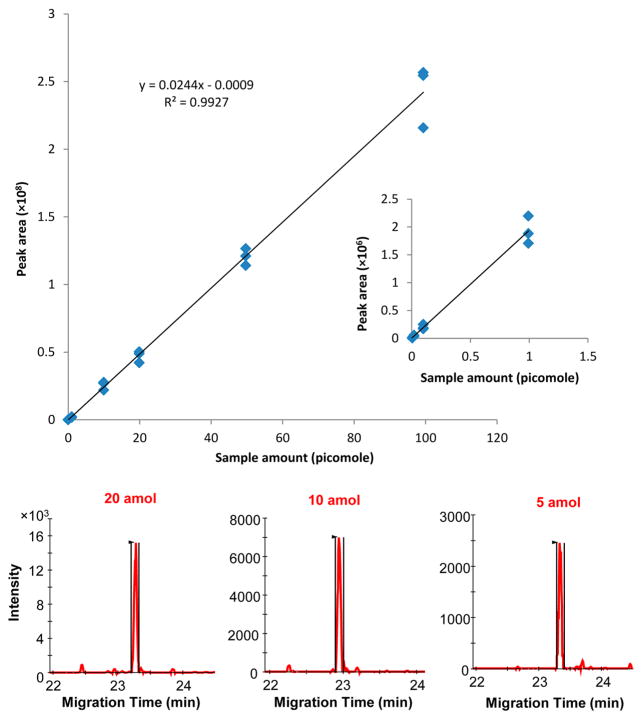
Figure 6 shows the experimental results for Kemptide in which the specific transition Q1:3872+ to Q3:567.3+ was used for CITP/CZE–SRM MS analysis. Using the peak area from extracted ion chromatogram, excellent linearity (R2 > 0.99) was obtained between the concentration and the peak area in the total sample loading amount ranging from 5 attomole to 99.4 picomole, indicating over 4 orders of magnitude of linear dynamic range, as shown in Figure 6 and Figure S1. The signal-to-noise ratio (S/N) shown in Figure 6 is still significantly larger than ten to one even for the lowest sample loading amount used in the experiment, indicating a LOQ well below 5 attomoles for Kemptide. The average CV for peak migration time from all nine different sample concentrations, as listed in Table 1, is at 0.8% indicating an excellent reproducibility of the new sheathless CITP/CZE–SRM MS. The robustness of the new sheathless CITP/CZE interface was also significantly improved due to the unique design of the interface allowing the electric contact between ESI voltage power supply and the CE separation liquid by using a conductive liquid that came in contact with the metal coated surface of the ESI emitter. Stable nanoESI was maintained through the entire CITP/CZE–SRM MS sample analysis by avoiding the formation of disruptive gas bubbles from electrochemical reaction inside of CE capillary. Our repeated sample quantification showed that even after more than a hundred sample analyses, the stability of new sheathless CITP/CZE–SRM MS still remained without noticeable loss of the metal coating on the emitter surface. The constant i.d. and the tapered o.d. of the integrated separation/emitter capillary used in the new sheathless CITP/CZE-nanoESI interface also avoided the emitter clogging problem.
Figure 6.
Sensitivity, reproducibility, and linearity of the sheathless CITP/CZE-SRM MS quantification of Kemptide. Extracted ion chromatograms (XICs) of the best transition monitored for Kemptide peptide at three lowest amounts (5, 10, and 20 attomole) are shown in the lower part.
Comparing the achievable LOQ with our previous porous ESI emitter CITP/CZE interface,13 the demonstrated 5 attomole LOQ for Kemptide by using the new interface in this study is about five time better than the achievable LOQ by using the porous ESI emitter CITP/CZE interface primarily due to a much lower ESI flow rate being used in this study for a significantly better ionization efficiency. Comparable linear dynamic ranges over four orders of magnitude were obtained by using both interfaces.
CONCLUSIONS
Detailed experimental evaluation of the new sheathless CITP/CZE–MS interface in this study demonstrated its unique capabilities in achieving reproducible and high-sensitivity CITP/CZE–nanoESI–SRM MS sample analysis. The new interface also allowed stable and dilution-free nanoESI operation at a flow rate as low as 5.7 nL/min, which was shown to simultaneously improve the CITP/CZE separation quality and the MS detection sensitivity. The LOQ as low as 5 attomole was demonstrated by using the new sheathless CITP/CZE–ESI–SRM MS instrument platform making it suitable for high-sensitivity and robust quantitative sample analysis.
Supplementary Material
Table 1.
Sheathless CITP/CZE–SRM MS Quantification Results for Kemptide
| concentration (nmol/L) | amount (attomole) | average migration time (min) | CV of migration time | average area | CV of area |
|---|---|---|---|---|---|
| 0.025 | 5 | 23.1 | 0.7% | 6.14 × 10³ | 25.2% |
| 0.05 | 10 | 22.5 | 1.3% | 2.14 × 10⁴ | 5.0% |
| 0.1 | 20 | 23.3 | 0.6% | 4.35 × 10⁴ | 24.6% |
| 0.5 | 99 | 22.8 | 1.8% | 2.02 × 10⁵ | 20.3% |
| 5 | 994 | 24.7 | 0.4% | 1.93 × 10⁶ | 12.9% |
| 50 | 9.94 × 10³ | 23.7 | 0.5% | 2.55 × 10⁷ | 12.3% |
| 100 | 1.99 × 10⁴ | 23.0 | 0.2% | 4.71 × 10⁷ | 9.2% |
| 250 | 4.97 × 10⁴ | 22.7 | 0.6% | 1.21 × 10⁸ | 5.2% |
| 500 | 9.94 × 10⁴ | 23.3 | 0.7% | 2.42 × 10⁸ | 9.5% |
Acknowledgments
This work was partially supported by grants from the National Institutes of Health: National Cancer Institute (R33 CA155252 and R21 CA199744) and National Institute of General Medical Sciences (P41 GM103493). All the experiments were performed in the Environmental Molecular Sciences Laboratory, a U.S. DOE national scientific user facility located at the Pacific Northwest National Laboratory (PNNL) in Richland, Washington. PNNL is a multiprogram national laboratory operated by Battelle for the DOE under Contract DE-AC05-76RL01830.
Footnotes
Notes
The authors declare no competing financial interest.
The Supporting Information is available free of charge on the ACS Publications website at DOI: 10.1021/acs.analchem.5b04912.
Table S1: CITP/CZE liquid flow rates at different eluting pressures; Table S2: Peptide transitions used in CITP/CZE–SRM MS; Table S3: FWHM and intensity of BSA peptides extracted from CITP/CZE–SRM MS chromatogram with a sample loading volume of 28.4 nL; Figure S1: Extracted ion chromatograms of the best transition for kemptide from CITP/CZE–SRM MS (PDF)
References
- 1.Sun L, Zhu G, Mou S, Zhao Y, Champion MM, Dovichi NJ. J Chromatogr A. 2014;1359:303–308. doi: 10.1016/j.chroma.2014.07.024. [DOI] [PMC free article] [PubMed] [Google Scholar]
- 2.Sun L, Zhu G, Yan X, Champion MM, Dovichi NJ. Proteomics. 2014;14:622–628. doi: 10.1002/pmic.201300295. [DOI] [PMC free article] [PubMed] [Google Scholar]
- 3.Sun L, Zhu G, Zhao Y, Yan X, Mou S, Dovichi NJ. Angew Chem, Int Ed. 2013;52:13661–13664. doi: 10.1002/anie.201308139. [DOI] [PMC free article] [PubMed] [Google Scholar]
- 4.Li Y, Compton PD, Tran JC, Ntai I, Kelleher NL. Proteomics. 2014;14:1158–1164. doi: 10.1002/pmic.201300381. [DOI] [PMC free article] [PubMed] [Google Scholar]
- 5.Ahmed FE. J Chromatogr B: Anal Technol Biomed Life Sci. 2009;877:1963–1981. doi: 10.1016/j.jchromb.2009.05.023. [DOI] [PubMed] [Google Scholar]
- 6.Sarg B, Faserl K, Kremser L, Halfinger B, Sebastiano R, Lindner HH. Mol Cell Proteomics. 2013;12:2640–2656. doi: 10.1074/mcp.M112.024109. [DOI] [PMC free article] [PubMed] [Google Scholar]
- 7.Faserl K, Kremser L, Müller M, Teis D, Lindner HH. Anal Chem. 2015;87:4633–4640. doi: 10.1021/acs.analchem.5b00312. [DOI] [PMC free article] [PubMed] [Google Scholar]
- 8.Han X, Wang Y, Aslanian A, Fonslow B, Graczyk B, Davis TN, Yates JR., 3rd J Proteome Res. 2014;13:6078–6086. doi: 10.1021/pr500971h. [DOI] [PMC free article] [PubMed] [Google Scholar]
- 9.Han X, Wang Y, Aslanian A, Bern M, Lavallée-Adam M, Yates JR., 3rd Anal Chem. 2014;86:11006–110012. doi: 10.1021/ac503439n. [DOI] [PMC free article] [PubMed] [Google Scholar]
- 10.Wang C, Lee CS, Smith RD, Tang K. Anal Chem. 2012;84:10395–10403. doi: 10.1021/ac302616m. [DOI] [PMC free article] [PubMed] [Google Scholar]
- 11.Stegehuis DS, Irthu H, Tjaden UR, Van der Greef J. J Chromatogr. 1991;538:393–402. doi: 10.1016/s0021-9673(01)88860-9. [DOI] [PubMed] [Google Scholar]
- 12.Smith RD, Barinaga CJ, Udseth HR. Anal Chem. 1988;60:1948–1952. [Google Scholar]
- 13.Wang C, Lee CS, Smith RD, Tang K. Anal Chem. 2013;85:7308–7315. doi: 10.1021/ac401202c. [DOI] [PMC free article] [PubMed] [Google Scholar]
- 14.Issaq HJ, Janini GM, Chan KC, Veenstra TD. J Chromatogr A. 2004;1053:37–42. [PubMed] [Google Scholar]
- 15.Wahl JH, Gale DC, Smith RD. J Chromatogr A. 1994;659:217–222. doi: 10.1016/0021-9673(94)85026-7. [DOI] [PubMed] [Google Scholar]
- 16.Wojcik R, Dada OO, Sadilek M, Dovichi NJ. Rapid Commun Mass Spectrom. 2010;24:2554–2560. doi: 10.1002/rcm.4672. [DOI] [PubMed] [Google Scholar]
- 17.Sun L, Zhu G, Zhang Z, Mou S, Dovichi NJ. J Proteome Res. 2015;14:2312–2321. doi: 10.1021/acs.jproteome.5b00100. [DOI] [PMC free article] [PubMed] [Google Scholar]
- 18.Figeys D, van Oostveen I, Ducret A, Aebersold R. Anal Chem. 1996;68:1822–1828. doi: 10.1021/ac960191h. [DOI] [PubMed] [Google Scholar]
- 19.Kelly JF, Ramaley L, Thibault P. Anal Chem. 1997;69:51–60. [Google Scholar]
- 20.Chen YR, Her GR. Rapid Commun Mass Spectrom. 2003;17:437–441. doi: 10.1002/rcm.940. [DOI] [PubMed] [Google Scholar]
- 21.Zamfir AD, Dinca N, Sisu E, Peter-Katalinic J. J Sep Sci. 2006;29:414–422. doi: 10.1002/jssc.200500374. [DOI] [PubMed] [Google Scholar]
- 22.Chang YZ, Her GR. Anal Chem. 2000;72:626–630. doi: 10.1021/ac990535e. [DOI] [PubMed] [Google Scholar]
- 23.Nilsson S, Wetterhall M, Bergquist J, Nyholm L, Markides KE. Rapid Commun Mass Spectrom. 2001;15:1997–2000. doi: 10.1002/rcm.466. [DOI] [PubMed] [Google Scholar]
- 24.Wetterhall M, Nilsson S, Markides KE, Bergquist J. Anal Chem. 2002;74:239–245. doi: 10.1021/ac010748f. [DOI] [PubMed] [Google Scholar]
- 25.Kele Z, Ferenc G, Klement E, Toth GK, Janaky T. Rapid Commun Mass Spectrom. 2005;19:881–885. doi: 10.1002/rcm.1866. [DOI] [PubMed] [Google Scholar]
- 26.Moini M. Anal Chem. 2007;79:4241–4246. doi: 10.1021/ac0704560. [DOI] [PubMed] [Google Scholar]
- 27.Haselberg R, de Jong GJ, Somsen GW. Anal Chem. 2013;85:2289–2296. doi: 10.1021/ac303158f. [DOI] [PubMed] [Google Scholar]
- 28.Ramautar R, Busnel JM, Deelder AM, Mayboroda OA. Anal Chem. 2012;84:885–892. doi: 10.1021/ac202407v. [DOI] [PubMed] [Google Scholar]
- 29.Busnel JM, Schoenmaker B, Ramautar R, Carrasco-Pancorbo A, Ratnayake C, Feitelson JS, Chapman JD, Deelder AM, Mayboroda OA. Anal Chem. 2010;82:9476–9483. doi: 10.1021/ac102159d. [DOI] [PubMed] [Google Scholar]
- 30.Ramautar R, Somsen GW, de Jong GJ. Electrophoresis. 2015;36:212–224. doi: 10.1002/elps.201400388. [DOI] [PubMed] [Google Scholar]
- 31.MacLean B, Tomazela DM, Shulman N, Chambers M, Finney GL, Frewen B, Kern R, Tabb DL, Liebler DC, MacCoss MJ. Bioinformatics. 2010;26:966–968. doi: 10.1093/bioinformatics/btq054. [DOI] [PMC free article] [PubMed] [Google Scholar]
Associated Data
This section collects any data citations, data availability statements, or supplementary materials included in this article.


