

ABSTRACT
The incidence of maternal obesity and its co-morbidities (diabetes, cardiovascular disease) continues to increase at an alarming rate, with major public health implications. In utero exposure to maternal obesity has been associated with development of cardiovascular and metabolic diseases in the offspring as a result of developmental programming. The placenta regulates maternal-fetal metabolism and shows significant changes in its function with maternal obesity. Autophagy is a cell-survival process, which is responsible for the degradation of damaged organelles and misfolded proteins. Here we show an activation of autophagosomal formation and autophagosome-lysosome fusion in placentas of males but not females from overweight (OW) and obese (OB) women vs. normal weight (NW) women. However, total autophagic activity in these placentas appeared to be decreased as it showed an increase in SQSTM1/p62 and a decrease in lysosomal biogenesis. A mouse model with a targeted deletion of the essential autophagy gene Atg7 in placental tissue showed significant placental abnormalities comparable to those seen in human placenta with maternal obesity. These included a decrease in expression of mitochondrial genes and antioxidants, and decreased lysosomal biogenesis. Strikingly, the knockout mice were developmentally programmed as they showed an increased sensitivity to high-fat diet-induced obesity, hyperglycemia, hyperinsulinemia, increased adiposity, and cardiac remodeling. In summary, our results indicate a sexual dimorphism in placental autophagy in response to maternal obesity. We also show that autophagy plays an important role in placental function and that inhibition of placental autophagy programs the offspring to obesity, and to metabolic and cardiovascular diseases.
KEYWORDS: fetal programming, high fat diet, maternal obesity, metabolomics, placental function, sex differences
Introduction
More than 65% of women entering pregnancy in the US are overweight or obese. Maternal obesity increases the risk of adverse pregnancy outcomes including major malformations, preeclampsia, pregnancy loss, and stillbirth.1-3 In addition, in utero exposure to maternal obesity causes changes in the offspring's body composition, and cardiovascular and metabolic function as a result of developmental programming.4-6
The placenta regulates maternal-fetal metabolism and produces perhaps the broadest array of information molecules (hormones, cytokines, and all other classes of signaling molecules) of any other organ except for the brain.7 Placental function is now recognized as a critical regulator of fetal growth and development, as it communicates the maternal and intrauterine environment to the fetus, and as a mediator of fetal programming.8-10 We and others have demonstrated the presence of hypoxia, inflammation, and oxidative stress11,12 in the placenta in various pathological situations and their relationship to altered placental function and developmental programming.10 Recently, we have also shown a decrease in placental ATP levels, placental mitochondrial dysfunction, and reduced mitochondrial biogenesis in overweight and obese women.13
Autophagy is responsible for the turnover of long-lived proteins and of intracellular structures that are damaged or functionally redundant.14-16 Autophagy is initiated with formation of a double-membrane structure called the phagophore, which evolves into the autophagosome, an organelle that sequesters cytoplasmic materials such as mitochondria, peroxisomes, endoplasmic reticulum, protein aggregates, and lipids.17 Upon acidification the autophagosome fuses with the lysosome to form the autolysosome, that degrades its content.17 Autophagy is active at basal levels in most cell types where it is postulated to play a housekeeping role in maintaining the integrity of intracellular organelles and proteins.18,19 Certain environmental cues (such as starvation, high temperature, hypoxia, hormonal stimulation) or intracellular stress (accumulation of misfolded proteins, endoplasmic reticulum [ER] stress and increased reactive oxygen species [ROS], and mitochondrial damage) activate signaling pathways that increase autophagy.19 Recently, a role for autophagy in the central control of energy metabolism has been identified.20 Here we hypothesized that autophagy is activated in placentas with maternal obesity.
Results
Clinical characteristics of study patients
There were no significant differences in maternal and gestational age at delivery between the women of differing body mass index (BMI; Table 1). By experimental design, mean maternal BMI significantly differed between the chosen groups (one-way ANOVA with Tukey's post hoc test). The gestational weight gain in OB mothers was significantly smaller than in NW mothers (p = 0.003). Placentas of females from OW women were significantly heavier compared to placentas of females from NW women (p < 0.05), while placentas of females from NW and OB women were significantly lighter than placentas of males within the same group of adiposity (p < 0.05).
Table 1.
Clinical characteristics of study patients.
| Pre-pregnancy or first trimester BMI group |
NW |
OW |
OB |
|||
|---|---|---|---|---|---|---|
| Sex of fetus |
Male n = 10 |
Female n = 10 |
Male n = 6 |
Female n = 6 |
Male n = 10 |
Female n = 10 |
| Pre-pregnancy BMI(kg/m2) | 22.7 (18.2–23.9) |
22.2 (19.5–24.9) |
27.4*, (26.4–28.7) |
27.3*, (25.0–29.9) |
35.9*, (30.6–43.0) |
36.3*, (30.8–44.0) |
| Maternal age (years) | 28.5 (20–37) |
27.8 (21–36) |
29.2 (23–32) |
29.1 (24–34) |
31.1 (23–38) |
27.5(22–36) |
| Gestational age (weeks) | 39.2 (39–40) |
39.5 (38–40) |
38.2 (38.5–39) |
38.9 (38.5–40) |
39.0 (38–40) |
39.0 (38.5–40) |
| Weight gain (kg) | 13.3 (9.5–18.6) |
11.4 (8.1–17.3) |
13.7 (9.0–19.5) |
12.3 (5.9–20.5) |
6.9*, (0–17.7) |
7.6*, (0–14.1) |
| Placenta weight (mean ±SEM, grams) | 754 (669–752) |
702#, (669–752) |
724(505–740) | 785*, (612–848) |
792(628–1007) | 718#, (401–837) |
| Birth weight (grams) | 3640 (3010–4325) |
3352 (2995–4046) |
3448 (2746–4063) |
3281 (3100–3450) |
3453 (2775–4402) |
3408 (2920–3755) |
| Parity (%) | ||||||
| Primiparous | 70% | 70% | 16% | 50% | 40% | 70% |
| Multiparous | 30% | 30% | 84% | 50% | 60% | 30% |
| Ethnicity (hispanic/non-hispanic) | 7/3 | 8/2 | 5/1 | 6/0 | 7/3 | 9/1 |
Note. Significant differences relative to the normal weight group were determined using a one-way ANOVA with Tukey's post hoc testing for each gender. Values are mean (range).
p < 0.05 vs. NW group;
p < 0.05 vs. males within the same group of adiposity. Sample sizes are given for males and females.
Evidence for the increase in autophagy in placentas with maternal obesity in a fetal sex-dependent manner
We have recently shown a decrease in placental ATP levels and placental mitochondrial dysfunction with maternal obesity.13 Reduction in ATP content has been previously linked to activation of AMPK (AMP-activated protein kinase), a crucial cellular energy sensor,21,22 which, in turn, can drive autophagy.23 To examine the activation of AMPK in placentas of OW and OB women, western blot analysis for the phosphorylated (p-AMPK) and total AMPK (t-AMPK) was performed (Fig. 1). The ratio of p-AMPK to t-AMPK (Fig. 1A–B) was significantly increased in male placentas ranging from 1.5 ± 0.2 in NW women to 2.1 ± 0.2 in OB women (p = 0.03), and showed a tendency to increase in placentas of males from OW women (1.9 ± 0.5) and placentas of females with increasing adiposity, but did not reach statistical significance (p = 0.1).
Figure 1.
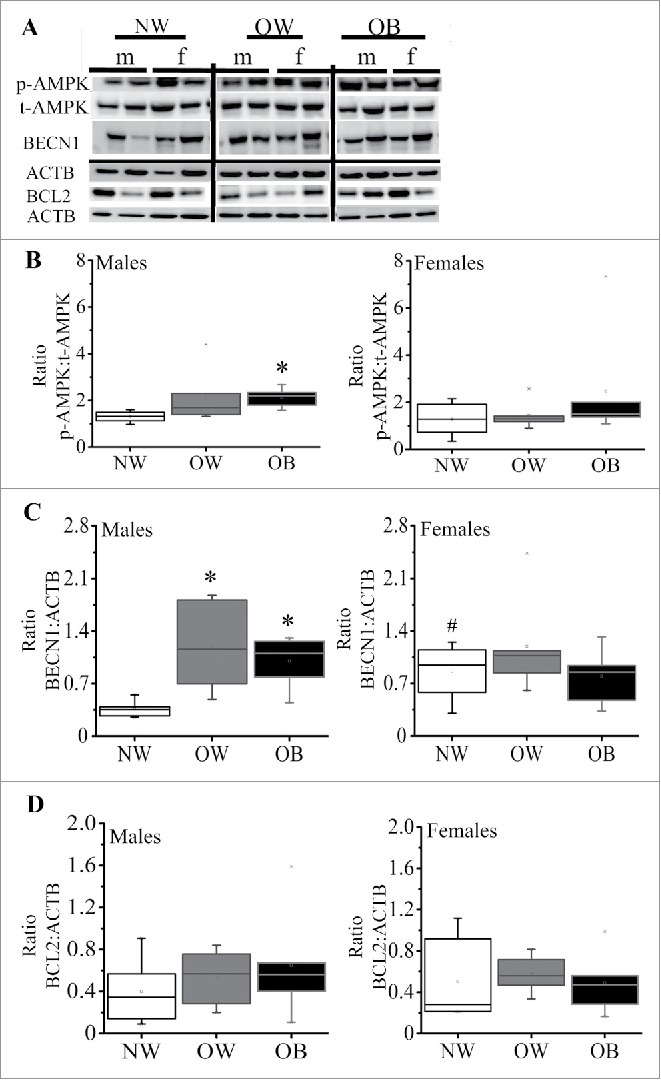
Expression of markers of autophagy in placentas from women with increasing adiposity. (A) Representative western blots for phosphorylated (p)-AMPK and total (t)-AMPK, BECN1 and BCL2 with the corresponding ACTB in placentas of males and females from NW, OW and OB women. (B) Box-and-whisker plot of calculated ratio of p-AMPK:t-AMPK in males (left) and females (right). (C) Quantification data for BECN1 in male and female placentas of NW, OW and OB women. (D) Quantification data for BCL2 in placentas of males and females from NW, OW and OB women. Data were normalized to ACTB. Data presented as box-and-whisker plot, the bottom and top of the boxes indicate the 25th and 75th percentiles, and the whiskers indicate the 5th and 95th percentiles, x marks outliers, n = 6−10 per group of adiposity/fetal sex *, p < 0.05 vs. NW group; #, p < 0.05 vs. males within the same group of adiposity.
Activation of AMPK switches on autophagy, acting by either inhibition of MTOR (mechanistic target of rapamycin [serine/threonine kinase]) signaling24 or, as happens in the case of energy depletion, by direct activation of BECN1/Beclin 1.25 We found no differences in MTOR signaling as was indicated by expression and/or phosphorylation of its downstream targets, RPS6KB/S6K (ribosomal protein S6 kinase, 70 kDa) and EIF4EBP1/4EBP (eukaryotic translation initiation factor 4E binding protein 1) (Fig. S1). In contrast, the protein expression of BECN1 showed a significant increase in placentas of males from OW (3.8 fold, p = 0.03) and OB (2.8 fold, p = 0.001) women compared to NW women (Fig. 1C), suggesting an initiation of autophagy. However, BECN1 expression in placentas of females from NW women was already significantly greater than in placentas of males from NW women and showed no further increase with maternal adiposity. BECN1 binds with antiapoptotic BCL2 (B-cell CLL/lymphoma 2) leading to the inhibition of BECN1-mediated autophagic initiation.26 No differences, however, in BCL2 expression were observed across the groups (Fig. 1D).
Induction of autophagy has been shown to be associated with an increase in the levels of ceramides.27 We therefore measured the concentration of ceramides and dihydroceramides in the placentas of males and females from normal weight and obese women using a targeted metabolomics approach (Fig. 2). No differences in the levels of C16, C18 and C22 ceramides were observed between the groups. Levels of C20 ceramide, C16 and C18 dihydroceramides were similar between female placentas of NW and OB women and male placentas of OB women (Fig. 2A–B). However, in male placentas from NW women, the levels of C20:0 ceramide (Fig. 2A) and C16/C18 dihydroceramides (Fig. 2B) were reduced by 75% and 50%, respectively, compared to male placentas of OB women (p = 0.03).
Figure 2.

Targeted metabolomics in placentas of NW and OB women with male and female fetuses. Levels of C16, C18, C20 and C22 ceramides (A) and C16/C18 dihydroceramides (B) in placentas of male and female fetuses from NW and OB women. Values are mean ± SEM, n = 10 per group of adiposity/fetal sex, *, p < 0.05 vs. NW group; #, p < 0.05 vs. males within the same group of adiposity.
Formation of autophagosomes in placentas with maternal obesity
Autophagy is initiated by the nucleation/formation of the phagophore, and the coordinated action of ATG (autophagy-related) proteins results in the expansion of this membrane to form the autophagosome.28 Western blots showed an increase in the levels of placental ATG3 and ATG7 with maternal obesity, which reached statistical significance for ATG3 in placentas of females from OW and OB women (1.5 and 2.3-fold, respectively vs. NW, p < 0.05, Fig. 3B) and for ATG7 in placentas of males from OW and OB women (2 and 2.5-fold, respectively vs. NW, p < 0.05) (Fig. 3C). The MAP1LC3B/LC3B (microtubule-associated protein 1 light chain 3 beta) cleavage (ratio MAP1LC3B-II to MAP1LC3B-I) was increased significantly with maternal adiposity in male placentas suggesting either increased formation or reduced clearance of autophagosomes (Fig. 3D). Again, however, in female placentas of NW women, the MAP1LC3B-II/MAP1LC3B-I ratio was significantly greater than in male placentas of NW women. No changes were found across the groups in ATG5 and ATG12 (not shown).
Figure 3.

Markers of autophagosome formation in placentas from NW, OW and OB women with male or female fetuses. (A) Representative western blots for ATG3, ATG7, MAP1LC3B-I and MAP1LC3B-II, as well as SQSTM1 with corresponding ACTB. (B-E) Quantification data for ATG3 (B) and ATG7 (C) in placentas of males (left) and females (right). (D) Ratio of MAP1LC3B-II:MAP1LC3B-I in placentas of males and females. (E) Quantification data for placental SQSTM1 in males and females. Data were normalized to ACTB. Data presented as box-and-whisker plot, the bottom and top of the boxes indicate the 25th and 75th percentiles, and the whiskers indicate the 5th and 95th percentiles, x marks outliers, n = 6−10 per group of adiposity/fetal sex, *, p < 0.05 vs. NW group; #, p < 0.05 vs. males within the same group of adiposity.
The SQSTM1/p62 (sequestosome 1) protein is a ubiquitin-binding receptor protein that binds directly to MAP1LC3B and serves to link the ubiquitinated proteins to the autophagic machinery to enable their degradation in the lysosome.29 Since SQSTM1 accumulates when autophagy is inhibited, and is reduced when autophagy is induced, it is used as a marker to study autophagic flux. Increase in maternal adiposity induced a statistically significant accumulation of SQSTM1 in placentas of males from OW and OB mothers (2.4 and 2.2-fold, respectively, p = 0.03), while no differences in SQSTM1 levels were observed between the female placentas of NW, OW and OB women (Fig. 3E).
Markers of autophagosome-lysosome fusion are activated in OW and OB placentas of males
After the autophagosome forms, the outer autophagosome membrane become ready to fuse with the lysosome for the degradation of enclosed cytoplasmic materials.30 Three proteins, STX17 (syntaxin 17), SNAP29 (synaptosomal-associated protein 29) and VAMP8 (vesicle-associated membrane protein 8), are critical for autophagosome–lysosome fusion.31 As shown in Fig. 4, placentas of males from OW and OB women had significantly (p < 0.05) higher concentrations of STX17 (2.9 and 2.2-fold, respectively, Fig. 4A–B), SNAP29 (2.7 and 1.7-fold, respectively, Fig. 4C) and VAMP8 (3 and 2.3-fold, respectively, Fig. 4D) when compared to male placentas of NW women. Again, female placentas of NW women had significantly higher levels of STX17 (2.4-fold, p = 0.02), SNAP29 (3.1-fold, p = 0.005), and VAMP8 (2.3-fold, p = 0.01) compared to male placentas of NW. No changes in expression of these proteins were observed in placentas of females across the groups.
Figure 4.

Expression of markers for autophagosomal-lysosomal fusion. (A) Representative western blots for STX17, SNAP29 and VAMP8 with corresponding ACTB. (B-D) Quantification data for placental STX17 (B), SNAP 29 (C), and VAMP8 (D) in males (left) and females (right) of NW, OW and OB women. Data were normalized to ACTB. Data presented as box-and-whisker plot, the bottom and top of the boxes indicate the 25th and 75th percentiles, and the whiskers indicate the 5th and 95th percentiles, x marks outliers, n = 6−10 per group of adiposity/fetal sex, *, p < 0.05 vs. NW group; #, p < 0.05 vs. males within the same group of adiposity.
Lysosomal markers remained unchanged in placentas with maternal obesity
The progression and resolution of autophagy critically depends on lysosomal function, as lysosomes play a role in the degradation of cellular components.32 The biogenesis of autophagosomes and lysosomes is regulated by TFEB (transcription factor EB).33 We therefore measured protein expression of TFEB (Fig. 5). Surprisingly, the levels of TFEB were reduced in both male and female placentas from OW and OB women compared to NW women, however, this only reached the statistical significance in placentas of males (50%, p = 0.01; Fig. 5A–B). The protein expression of lysosomal protease CTSB (cathepsin B) and LAMP2 (lysosomal-associated membrane protein 2) did not differ between NW, OW and OB groups in placentas of males (Fig. 5C–D). Interestingly, in female placentas from OB women, the expression of LAMP2 was significantly increased compared to the NW group (1.5-fold, p < 0.05; Fig. 5D). Thus, despite the fact that autophagosome formation and autophagosome-lysosome fusion have been activated in OW and OB placentas of males, no changes in expression of lysosomal markers were observed.
Figure 5.

Expression of markers for lysosomal biogenesis and lysosomal activity. (A) Representative western blots for TFEB, CTSB and LAMP2 in placentas of males and females from NW, OW, and OB women. (B-D) Quantification data for TFEB (B), CTSB (C) and LAMP2 (D). Data normalized to ACTB. Data presented as box-and-whisker plot, the bottom and top of the boxes indicate the 25th and 75th percentiles, and the whiskers indicate the 5th and 95th percentiles, x marks outliers, n = 6−10 per group of adiposity/fetal sex. *, p < 0.05 vs. NW group; #, p < 0.05 vs. males within the same group of adiposity. (E-F) Representative images (E) and quantification data (F) from monodansylcadaverine (MDC, green) staining of primary syncytiotrophoblasts isolated from NW and OB women (male and female fetuses) and cultured in the presence or absence of amino acids (± AA) for 6 h. Cells were counterstained by phalloidin staining of actin (red). Since there were no differences in MDC staining between male and female fetuses of NW women, combined data are shown. At least 5 areas were scanned for each well and images represented are characteristic of treatment replicates. Values are mean ± SEM, n = 3 individual experiments per group of adiposity/fetal sex, *, p < 0.05, starvation medium vs. full medium; #, p < 0.05, OB women vs. NW women; a, p < 0.05 female vs. male STs from OB women.
Autophagy response is defective in OB placentas of males
In order to visualize autophagy in vitro, primary trophoblasts were isolated from male and female placentas of NW and OB women, cultured for 72 h to allow syncytialization and stained with MDC (monodansylcadaverine). MDC is a spontaneously fluorescent dye that is incorporated into the autophagosomes and autolysosomes.34 To examine whether physiological stimuli (starvation) induce autophagy in trophoblasts, we incubated them either in full medium or starvation medium (± amino acids; Fig. 5E–F). When cultured in full medium, MDC staining was undetectable in the trophoblasts of either males or females from NW mothers (Fig. 5E). However, activation of autophagy by starvation resulted in a 60-fold increase (p = 0.007) in characteristic MDC staining of autophagic vacuoles in treated trophoblasts. Syncytiotrophoblasts (ST) isolated from male but not female placentas of OB women cultured in full medium demonstrated a significant 18-fold increase in MDC staining compared to NW women (p = 0.025, Fig. 5F). Surprisingly, however, amino acid starvation of these ST caused a 10-fold reduction in the percentage of MDC-positive cells (p < 0.05) compared to nonstarved cells, indicating a dysregulation in autophagic response. There were no differences between ST from NW women and OB women with female fetuses when cultured in full medium. However, amino acid starvation of trophoblasts isolated from female placentas of OB women showed a 12-fold increase in the number of autophagic vacuoles (p = 0.004) as compared to nonstarved cells.
Generation and characterization of Atg7 conditional knockout mice
Single transgenics Atg7 Flox/Flox mice (referred to as wild-type mice, WT) and Cyp19a1-Cre along with the double conditional knockout mice Atg7 f/f/Cyp19a1 (referred to as knockout mice, KO) were born healthy and fertile without any apparent pathological phenotype. No protein expression of ATG7 was detected in the placentas of knockout mice (Fig. 6A), while expression remained unchanged in the liver (Fig. 6A), lungs and hearts (not shown). No differences in the protein expression of BECN1 were observed. Both MAP1LC3B-I and MAP1LC3B-II forms were also detected in placentas of WT and KO mice (Fig. 6A). No differences in litter size (6–9 pups per litter) and placental weights (Fig. 6B) were found between WT and KO mice. However, deletion of placental Atg7 caused a significant 53% reduction in birth weight compared to WT mice (p = 0.004; n = 7−10 fetuses from 6 mothers in each group) indicating a substantial fetal growth restriction (Fig. 6B). This resulted in a significant reduction in placental efficiency in the KO mice when compared to WT mice calculated as the body weight of a pup divided by the mass of its placenta (2.7 ± 0.3 vs. 5.8 ± 0.9 respectively, p = 0.02).
Figure 6.
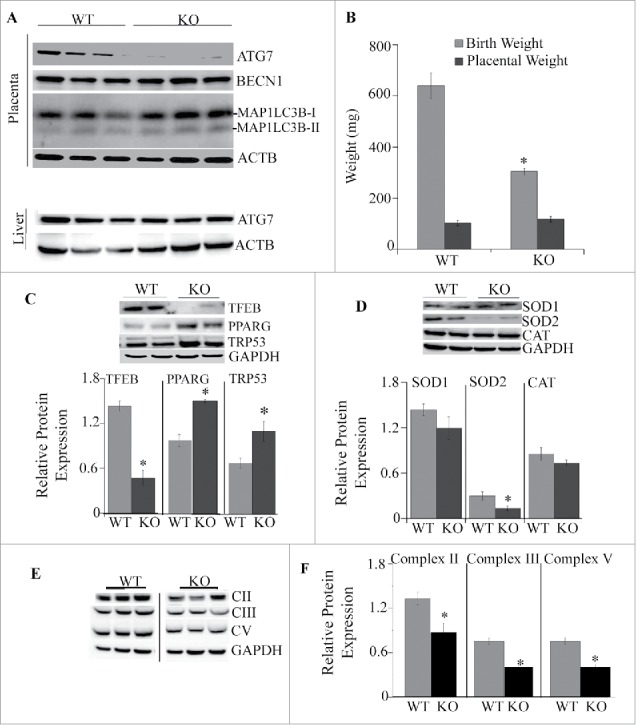
Analysis of placentas from Atg7 knockout mice. (A) Western blots of ATG7, BECN1, MAP1LC3B-I and MAP1LC3B-II in placentas of WT and KO mice (top) and expression of ATG 7 in the liver of WT and KO mice (bottom). (B) Placental and birth weights of WT and KO mice (n = 12−17/each group). (C) Representative western blots and quantification data of transcription factors TFEB, PPARG and TRP53 in placentas of males and females from WT and KO mice, (D) Representative western blots and quantification data of antioxidants SOD1, SOD2 and CAT. (E-F) Representative images (E) and quantification data (F) for protein expression of subunits of complexes II, III and V of the mitochondrial electron transport chain. Data were normalized to GAPDH. Values are mean ± SEM, n = 5 pregnant dams per each experimental group with 4–7 pooled placentas per each dam. *, p < 0.05 vs. WT mice.
Placental dysfunction in Atg7 conditional knockout mice
Next, we examined whether inactivation of autophagy by ablation of Atg7 would affect placental function. Similar to human placentas from OB mothers, placentas from conditional KO mice had significantly lower concentrations of TFEB (65%, p < 0.005; Fig. 6C). No differences in protein levels of the NFKB subunits RELA/p65 and NFKB1/p50 or HIF1A/HIF-1α (hypoxia-inducible factor 1, alpha subunit [basic helix-loop-helix transcription factor]) were observed between the groups (data not shown). One of the critical regulators of placental development is the nuclear receptor PPARG (peroxisome proliferator activated receptor gamma).35 We found a significant increase in the level of PPARG in placentas of KO mice compared to WT mice (1.5-fold, p < 0.005, Fig. 6C). Fetal growth restriction has been previously associated with overexpression of pro-apoptotic TRP53 (transformation related protein 53),36,37 and activation of oxidative stress.38 Western blot analyses show an increase in protein levels of TRP53 in placentas of KO mice vs. WT mice (1.5 -fold, p < 0.005; Fig. 6C). The expression of mitochondrial antioxidant SOD2 (superoxide dismutase 2, mitochondrial) was significantly reduced in placentas of KO mice compared to WT (Fig. 6D), while other antioxidants such as SOD1 (superoxide dismutase 1, soluble) and CAT (catalase) did not change. Defective autophagy has been previously linked to mitochondrial dysfunction.39,40 We then measured the expression of the subunits of the mitochondrial electron transport chain. The subunits of mitochondrial complexes II (SDHB [succinate dehydrogenase complex iron sulfur subunit B]), III (UQCRC2 [ubiquinol-cytochrome c reductase core protein II]) and complex V (ATP5A1 [ATP synthase, H+ transporting, mitochondrial F1 complex, alpha subunit 1, cardiac muscle]) were 50% decreased in KO mice compared to WT (p < 0.01; Fig. 6E), indicating mitochondrial dysfunction. No changes were observed in expression of subunits of complexes I (NDUFB8 [NADH:ubiquinone oxidoreductase subunit B8]) and IV (MT-CO2 [mitochondrially encoded cytochrome c oxidase II]) (not shown).
Changes in placental morphology in placenta-specific Atg7 null mice
Placentas of KO mice showed a 30% reduction in the area of the maternal decidua (29.3% ± 0.8 in WT vs. 22.5% ± 1.6 in KO, p = 0.02) and an 11% increase in the proportion occupied by the labyrinth zone responsible for maternal-fetal nutrient transfer (54.3% ± 1.0 in WT vs. 59.8 ± 0.8 in KO, p = 0.01; Fig. 7A-B). These slight changes in placental structure suggest that placental dysfunction seen in KO mice might be caused by physiological rather than morphological changes.
Figure 7.
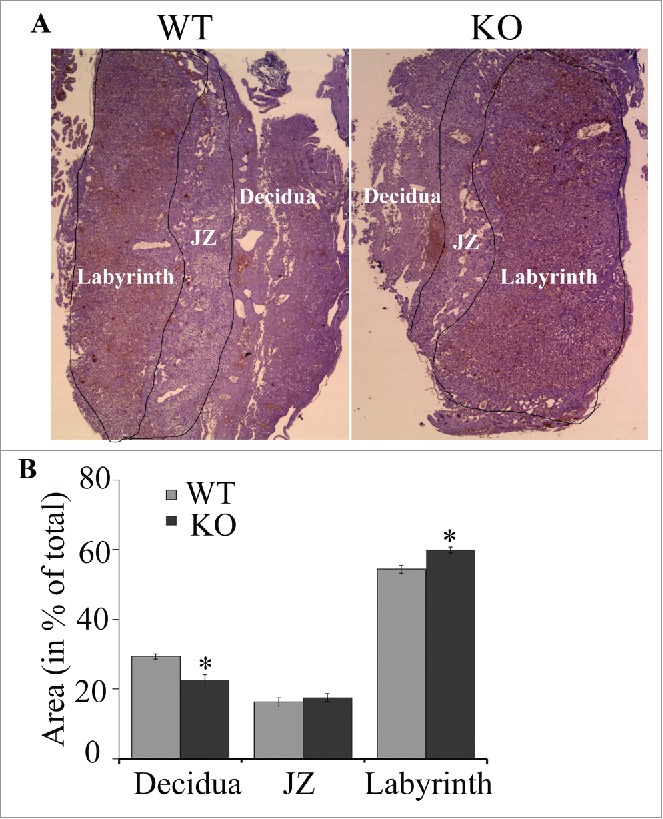
Representative photomicrograph (A) and quantification data (B) of a mouse placenta from WT and atg7 KO mice. The areas of decidua, junctional zone (JZ; labeled) and labyrinth (labeled) were measured and normalized (in %) to the total area of placenta. N = 5/group; *, p < 0.05 vs. WT mice.
Placenta-specific Atg7 conditional knockout mice are sensitive to high-fat diet-induced obesity
We further investigated if the placenta-specific Atg7 knockout mice were developmentally programmed to obesity and metabolic disease. The WT and Atg7 KO mice were fed a high-fat diet starting at the age of 8 wk and continuing for 12 wk (Fig. 8A). The body weight of each mouse was measured weekly. The KO offspring exhibit catch-up growth during their first months of life, and body weights at 8 wk of either male or female WT and KO mice fed a regular diet (RD) were indistinguishable (Fig. 8C). However, the offspring of KO mice had higher sensitivity to a high-fat diet (HFD)-induced obesity compared to WT mice (Fig. 8B-F). At 20 wk of age, the body weight of HFD-fed male KO mice was 48.5 ± 0.4g (n = 7) exceeding that of RD-fed KO mice (31.9 ± 1.1g, n = 11, p < 0.0001), and HFD-fed WT mice (39.0 ± 2.0g, n = 7, p < 0.01), and RD-fed WT mice (32.7 ± 0.5g, n = 11, p < 0.0001; Fig. 8C). The 37.9 ± 4.5% weight gain in male KO fed a HFD was greater than the 26.1 ± 7.5% weight gain in WT mice fed a HFD (p < 0.02; Fig. 8E). In female KO mice fed a HFD, the body weight was 27.7 ± 0.5g (n = 9), which was significantly higher than KO mice fed RD (17.2 ± 0.8g, n = 11, p < 0.0001), WT mice fed a HFD (21.8 ± 0.3g, n = 8, p < 0.0001), and WT fed a RD (19.5 ± 0.5g, n = 12, p < 0.001, Fig. 8D). The weight gain in female KO after 12 wk of a HFD was 39.4 ± 4.7% and exceeded the weight gain in WT mice (17.5 ± 6.2, p < 0.0002; Fig. 8F).
Figure 8.
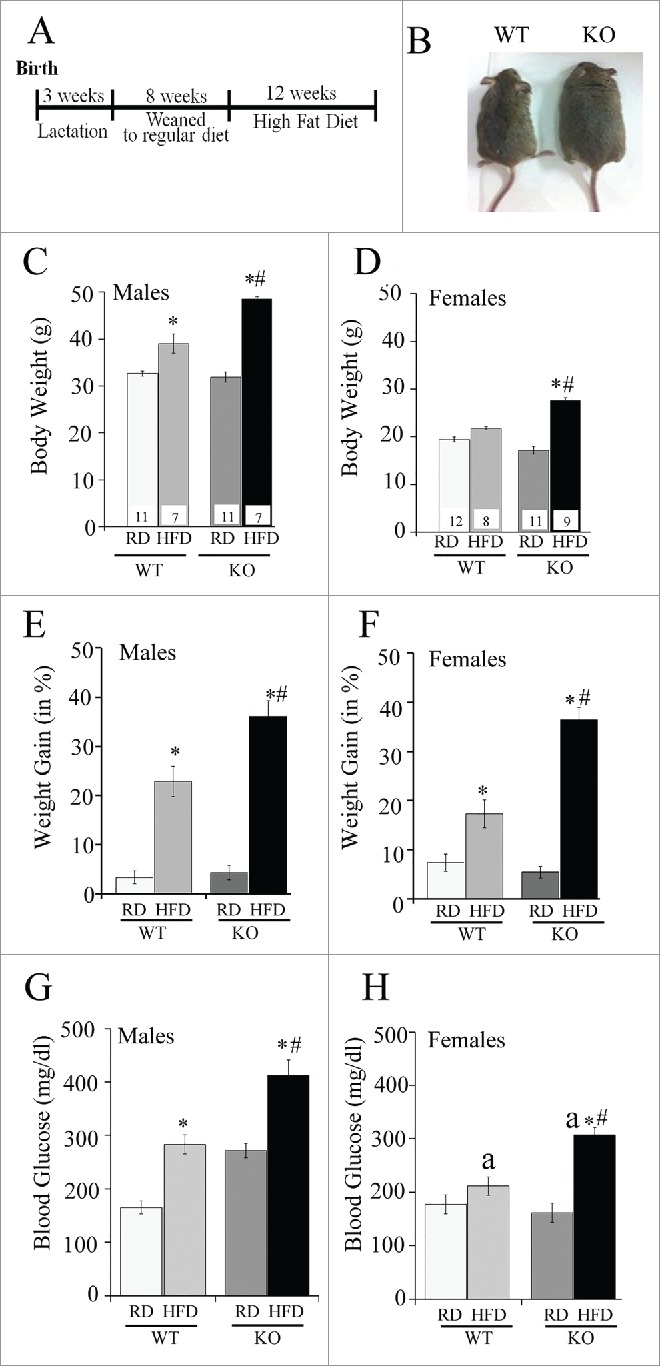
Effect of a high-fat diet (HFD) on placenta-specific atg7 knockout mice. (A) Time course of dietary intervention, (B) Representative images of wild-type (WT) and atg7 knockout mice (KO) at the end of high-fat dietary regimen at the age of 20 wk. (C-D) Body weight in WT and KO male (C) and female (D) mice after exposure to high-fat diet (HFD) or to regular diet (RD). (E-F) Weight gain of WT and KO mice after 12 wk of either RD or HFD in males (E) and females (F). (G-H) Blood glucose in WT and KO mice fed a RD or HFD in males (G) and females (H). Sample size is shown in (C) and (D). *, p < 0.05 vs. mice fed a regular diet; #, p < 0.05 vs. WT mice; a, p < 0.05 vs. males on the same diet.
Placenta-specific Atg7 conditional knockout mice are hyperglycemic and hyperinsulinemic
Male Atg7 knockout mice fed a regular diet were markedly hyperglycemic (non-fasted blood glucose: 272 ± 213.5 mg/dl) compared to male WT mice (164.75 ± 12.1mg/dl, p < 0.0001) (Fig. 8G-H). When fed a high-fat diet, both male and female KO mice developed severe hyperglycemia (412 ± 29.5mg/dl and 308 ±13.8mg/dl, respectively) compared with male and female WT mice on a high-fat diet (283 ± 17.7mg/dl and 211 ± 16.9mg/dl, respectively, p < 0.005). Male but not female HFD-fed WT mice developed significant hyperinsulinemia compared to WT RD-fed mice. Male KO had significantly higher levels of insulin when were fed with both regular and high-fat diets compared to male WT mice (Fig. 9A, p < 0.05). Changes in plasma glucose and insulin levels were further reflected in a significant increase in the HOMA-IR (homeostasis model assessment-insulin resistance) index (Fig. 9B), a quantitative measure of insulin resistance, in male WT HFD vs. WT RD mice (4-fold, p < 0.05), in male KO RD mice vs. WT RD (4-fold, p < 0.05) and in male KO HFD mice compared to KO RD and WT HFD (3-fold, p < 0.05). No differences in HOMA-IR were observed in female mice across the groups.
Figure 9.
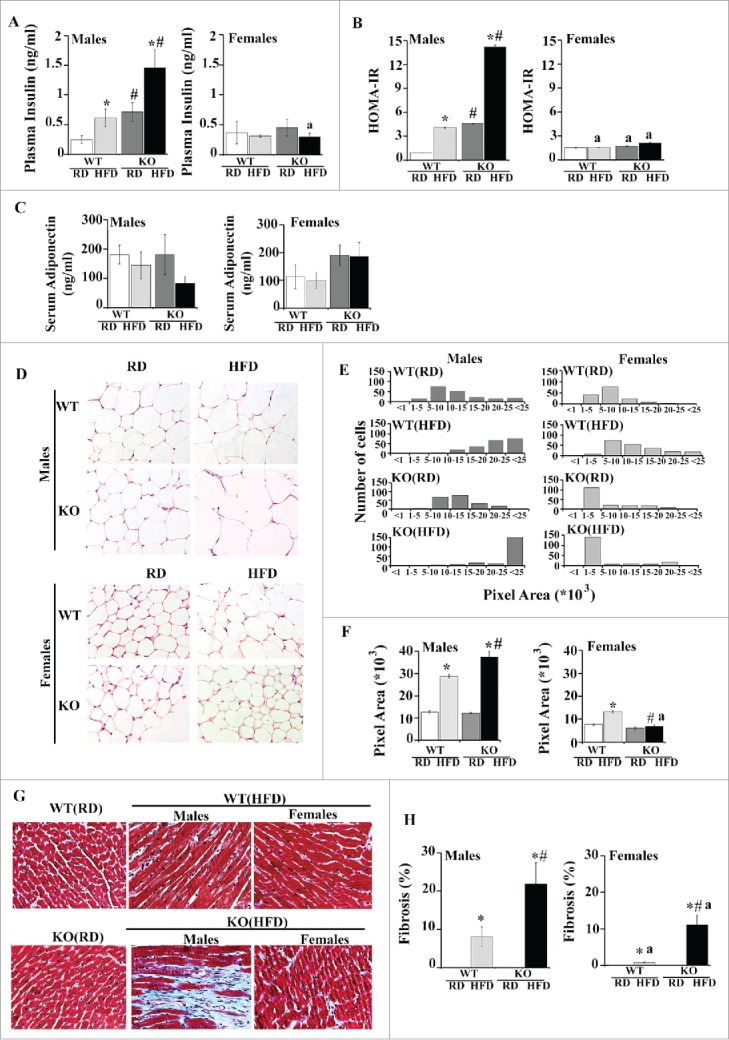
Metabolic and cardiac dysfunction in placenta-specific Atg7 knockout mice. (A-B) plasma insulin levels (A) and HOMA-IR score (B) at 20 wk of age in WT and KO mice fed either regular or a high-fat diet. (C-F) Adiposity and adipose tissue morphology in male and female RD or HFD-fed KO and WT mice. (C) Serum ADIPOQ concentration. (D) H&E staining of histological sections of abdominal fat pads (original magnification x40). (E) Size distribution of adipocyte area after 12 wk of HFD, and (F) mean adipocyte area of RD- or HFD-fed KO and WT mice. N = 150−200 adipocytes analyzed per each group. (G-H) Representative images (G) and quantification bars (H) of Masson trichrome-stained sections from RD- or HFD-fed KO and WT mice (magnification x40). Results represent mean ± SEM. N = 6 mice per group. *, p < 0.05 vs. mice fed a regular diet; #, p < 0.05 vs. WT mice on the same diet; a, p < 0.05 vs. males on the same diet.
Increased adiposity in Atg7 KO mice
We then assessed whether differences in weight gain were related to alterations in adiposity. There were no differences in serum levels of ADIPOQ/adiponectin across the group, though male KO HFD mice showed a tendency to decrease (Fig. 9C). As shown in Table 2, the average weight of the visceral fat was increased 2-fold in male and female KO HFD mice compared to WT HFD mice. Interestingly, female HFD-fed WT and KO mice showed a significantly larger accumulation of adipose tissue compared to male mice within the same experimental group. No differences in either liver or heart weights were observed across the groups (Table 2). Sections of adipose tissue from male WT HFD and KO HFD mice exhibited significantly increased adipocyte size relative to RD-fed mice with adipocytes from KO HFD mice being 25% larger than WT HFD mice (p < 0.05) (Fig. 9D–F). Surprisingly, this was not observed in female mice. Despite the large weight gain on HFD, the size of adipocytes was similar between female KO RD and KO HFD mice. Furthermore, the KO HFD mice showed an approximately 50% decrease in adipocyte size compared to female WT HFD mice and an 80% decrease compared to male KO HFD mice (Fig. 9F, p < 0.05).
Table 2.
Normalized liver, heart and visceral adipose tissue weights in male and female WT and KO mice fed a regular or a high-fat diet.
| Males | ||||
|---|---|---|---|---|
| Organ weights(normalized to body weight) | WT/RD N = 6 |
WT/HFD N = 8 |
KO/RD N = 8 |
KO/HFD N = 7 |
| Liver | 0.029 (0.026–0.033) |
0.026 (0.017–0.028) |
0.029 (0.025–0.032) |
0.028 (0.025–0.036) |
| Heart | 0.006 (0.005–0.007) |
0.007 (0.004–0.10) |
0.006 (0.004–0.009) |
0.007 (0.003–0.012) |
| Visceral adipose tissue | 0.010 (0.007–0.013) |
0.019*, (0.012–0.025) |
0.010 (0.006–0.015) |
0.055*,,#, (0.041–0.064) |
| Females | ||||
| Organ weights(normalized to body weight) | WT/RD N=10 |
WT/HFD N=6 |
KO/RD N=8 |
KO/HFD N=7 |
| Liver | 0.026 (0.016–0.032) |
0.020 (0.006–0.033) |
0.023 (0.016–0.035) |
0.024 (0.018–0.034) |
| Heart | 0.007 (0.005–0.010) |
0.007 (0.004–0.009) |
0.008 (0.007–0.009) |
0.007 (0.005–0.009) |
| Visceral adipose tissue | 0.009 (0.004–0.010) |
0.038*,,a, (0.032–0.042) |
0.013 (0.005–0.023) |
0.077*,,#,,a, (0.043–0.120) |
p < 0.05 vs. mice fed a regular diet;
p < 0.05 vs. WT mice;
p < 0.05 vs. males on a same diet.
Cardiac remodeling in HFD-fed Atg7 mice
shown that animals which were provided with a high-fat diet for at least 8 wk developed an extensive cardiac fibrosis despite a nonsignificant increase in body weight.41,42 While Masson's trichrome staining of tissue sections from WT and KO mice showed increased collagen depositions in the hearts of all HFD-fed animals, male and female KO HFD mice showed a much greater area of fibrosis compared to WT HFD mice. In addition, male WT HFD and KO HFD mice had larger accumulation of fibrotic tissue compared to females within the same experimental group (Fig. 9G–H).
Discussion
This study yielded several findings. First, there is a sexual dimorphism in placental response to maternal obesity: placentas of males switch to autophagy probably to maintain cellular homeostasis by degrading damaged organelles such as, for example, mitochondria.43 In contrast, female placentas from normal weight women showed an increase in the levels of C20 ceramides, and C16/C18 dihydroceramides, phosphorylated and total AMPK, autophagy markers BECN1, lipidated MAP1LC3B and proteins involved in autophagosome-lysosome fusion (STX17, SNAP29 and VAMP8) compared to male placentas from NW women (Table 3). This increase in prosurvival factors might confer further protection against stress conditions, and might play a key role in sex differences in fetal outcomes. It was previously shown that under similar conditions, female fetuses make multiple adaptations in placental gene and protein expression in response to intrauterine adversity, such as maternal asthma, preeclampsia44,45 and maternal stress,46 while male fetuses show fewer signs of adaptation.47 Our study, however, revealed that male fetuses did respond to maternal obesity with placental autophagy though with a disrupted autophagic flux as indicated by inhibited autolysosomal protein degradation and lysosomal biogenesis.
Table 3.
Comparison of autophagy and lysosomal markers in male and female placentas from normal weight women and women with increased adiposity (OW and OB).
| Males |
Females |
|||
|---|---|---|---|---|
| NW | Increased adiposity | NW | Increased adiposity | |
| Markers for activation of autophagy: | ||||
| Ratio p-AMPK:t-AMPK | – | ↑ vs. NW | – | – |
| MTOR signaling | – | – | – | – |
| C20 ceramide | – | ↑ vs. NW | ↑ vs. male | – |
| C16/C18 dihydroceramides | – | ↑ vs. NW | ↑ vs. male | – |
| Autophagy markers: | ||||
| ATG3 | – | – | – | ↑ vs. NW |
| ATG7 | – | ↑ vs. NW | – | – |
| BECN1 | – | ↑ vs. NW | ↑ vs. male | – |
| Ratio MAP1LC3B-II:MAP1LC3B-I | – | ↑ vs. NW | ↑ vs. male | – |
| SQSTM1/p62 | – | ↑ vs. NW | – | – |
| Markers for autophagosome-lysosome fusion: | ||||
| STX17-SNAP29-VAMP8 | – | ↑ vs. NW | ↑ vs. male | – |
| Markers for autolysosomes: | ||||
| TFEB | – | ↓ vs. NW | – | – |
| CTSB | – | – | – | – |
| LAMP2 | – | – | – | ↑ vs. NW |
Next, deletion of autophagy in the mouse placenta causes placental abnormalities similar to those seen with obesity in women, and the mice with placenta-specific deletion of autophagy appeared programmed to diet-induced obesity, and metabolic and cardiac diseases as adults.
Our cohort included healthy weight, overweight, and obese mothers with no medical conditions complicating their pregnancy. Gestational weight gain in most of these overweight and obese women was within the recommended guidelines, which may underlie why we see no excess of birthweight with maternal obesity. Low maternal weight gain, however, did not associate with better placental function suggesting that pre-pregnancy obesity is sufficient to affect the placenta. Changes in placental metabolism may possibly have resulted in offspring of similar weight in the obese and healthy weight women, but with increased adiposity and lower lean mass in the infants from obese mothers.48 This might not be the case, however, in a rodent model of placenta dysfunction. We show here that deletion of Atg7 leads to mitochondrial dysfunction in mouse placenta, which might, in turn, cause placental insufficiency. Thus, despite the differences in fetal outcome in human and mice, both models suggest that placental abnormalities affect the offspring's metabolic health.
Autophagy is essential for normal placental development and for maintaining pregnancy at different gestational stages49,50 and a protective role of autophagy in placental antiviral defense has been recently reported.51 Placental autophagy is also induced under pathological conditions, such as preeclampsia and intrauterine growth restriction.52,53 Our study show that maternal obesity also activates placental autophagy but in a fetal sex-dependent manner.
The energy sensor AMP-activated protein kinase (AMPK), which is activated by ATP depletion or glucose starvation, was previously thought to activate autophagy entirely through its ability to inactivate the MTOR complex.54 Two studies, however, provide evidence that AMPK can also activate autophagy via MTOR-independent mechanisms.24,55 In our study, activation of AMPK was found in male placentas from OW and OB women while no differences in MTOR signaling were observed suggesting that direct activation of autophagy by AMPK might take place.
SQSTM1 is a receptor protein that plays an important role in targeting ubiquitinated proteins to be transported to the autophagic machinery for their clearance in lysosomes.56 Association of ubiquitinated proteins with SQSTM1 is not sufficient for autophagic removal, and, for this reason, SQSTM1-positive protein aggregates are often identified in diseases associated with defective autophagy. The elimination of targeted substrates by autophagy controls many aspects of normal physiology, and failure to clear potentially toxic substrates, such as damaged mitochondria, underlies at least some of the cellular dysfunction that leads to the development of cardiovascular disease,57 liver dysfunction,58-60 neurodegeneration and cancer.60 In our study, despite the fact that formation of autophagosomes has been activated in male placentas from OW and OB women, the expression of SQSTM1 was also increased suggesting defective autophagy.
Defective autophagy has been reported in the context of obesity and high-fat diet.61-64 In adipocytes, for example, obesity leads to an increase in autophagy, and in a study of obese patients autophagy was particularly elevated in omental adipose tissue.65 Unlike adipocytes, the liver displays a decrease in autophagy in obese (ob/ob) mice.58 Chronic HFD results in an autophagy defect in the hypothalamus that correlates with increased inflammation, ER stress and obesity.64 The relevance of autophagy in obesity was further exemplified in pancreatic β-cells where selectively suppressing autophagy by breeding β-cell-specific Atg7-deficient mice with ob/ob mice results in severe diabetes.66 Pancreatic β-cells display an accumulation of autophagosomes and decrease in lysosomal gene expression in response to HFD.67 The placenta now joins the list of organs that exhibit defective autophagy in the settings of obesity.
It was reported that STX17, an autophagosomal soluble N-ethylmaleimide-sensitive factor attachment protein receptor protein, interacts with cytosolic SNAP29 and lysosomal VAMP8, inducing a fusion between the outer autophagosomal membrane and lysosomal membrane.31 Park et al.68 have recently proposed that an inhibition of autophagosome-lysosome fusion is the main cause of autophagy arrest during lypotoxicity and obesity. However, we show an increase in the protein expression of STX17, SNAP29 and VAMP8 in placentas of males from OW and OB women suggesting that the mechanisms of defective autophagy can be tissue-specific.
Ceramides are bioactive sphingolipids with distinct chain-length-specific biological functions.27 Despite the fact that a role for ceramide in induction of autophagy has been reported,69-71 the mechanisms whereby ceramides contribute to autophagy remain unclear. Ceramides can induce the expression of BECN1,70 and long-chain ceramides (C18) can induce lethal autophagy via lipidation of MAP1LC3B and selective targeting of mitochondria by MAP1LC3B-II-containing phagophores (mitophagy) through direct interaction between ceramides and MAP1LC3B-II.72 Dihydroceramides are the immediate metabolic precursors of ceramides in de novo sphingolipid synthesis and for a long time were considered as inert nonsignaling molecules. Several publications, however, have reported that dihydroceramides can be directly involved in activation of autophagy: (1) dihydroceramides, but not ceramides, mediate activation of autophagy in response to resveratrol,73 (2) exogenous addition of dihydroceramides74 and induction of C16:0, C24:0 and C24:1 dihydroceramides by celecoxib (a selective PTGS2/COX-2 inhibitor) have also been shown to induce autophagy.75 Here we found that levels of C16 and C18 dihydroceramides were increased in male placentas with increased maternal adiposity. Of ceramides, however, only C20 were slightly increased, indicating that dihydroceramides may be involved in activation of autophagy and placental physiology per se and are not simply the inactive precursors of ceramides.
It is well known that there is a sexual dimorphism in development of adverse pregnancy outcome with the male fetus being more at risk.76 Our work again emphasizes that fetal sex has a major influence on regulation of placental function and adds to a growing body of evidence showing sexual dimorphism in placental function including basal placental gene expression,77,78 changes in gene expression in response to maternal inflammatory status79-81 or maternal diet,82 and expression of placental miRNAs.83
Sex-dependent differences in autophagic responses have been shown before.84-87 In a mouse model of cancer-induced cardiac atrophy, Cosper et al.84 found that males have a more severe phenotype than females, including greater cardiac autophagy. Sexual dimorphism was also found in neuronal response to nutrient deprivation with neurons from males but not females undergoing autophagy.85 In neonates, sex-dependent activation of brain autophagy following hypoxia-ischemia was observed with female neonates having greater basal autophagy activity than males.87
The mechanisms underlying the sexually dimorphic effect of maternal obesity remain poorly understood. One potential explanation can be the fetal sex-dependent differences in the levels of hormones. Both male and female fetuses are exposed to high levels of estrogens in utero,88 however, it was shown that pregnant women with preeclampsia have higher plasma testosterone levels than healthy pregnant women.89,90 Dysregulation in androgen signaling may affect placental function, and several reports show that greater levels of testosterone might lead to fetal programming of adult cardiovascular and metabolic diseases.91,92
There is a substantial amount of data showing that placental function is compromised in obese women,13,83,93 but its effect on the offspring remains unclear. We sought to investigate the functional role of placental autophagy in vivo by generating and characterizing a mouse model in which an essential autophagy gene, Atg7, was deleted in placental tissue. Interestingly, lipidation of MAP1LC3B was still present in the placentas of atg7 KO mice, which might be potentially explained either by the contribution of other cell types, which can still express ATG7 (endothelial cells, fibroblasts, macrophages, and blood cells); or by activation of MAP1LC3B lipidation by ATG3,94 and Atg4.95 In agreement with our study, accumulation of lipidated MAP1LC3B -II has been previously shown in the ATG7-deficient epidermis.96
Deletion of Atg7 had a slight effect on placental morphology, but significantly affected the placental function including changes in mitochondrial genes, expression of antioxidants and of nutrient-sensing factors. Furthermore, the placenta-specific atg7 knockout mice showed an increased sensitivity to high-fat-diet-induced obesity. This may be either a result of reduced energy expenditure or decreased energy utilization/storage efficiency or both. We found increased levels of blood glucose in knockout mice fed either a regular diet (males) or a high-fat diet (males and females). Interestingly, the plasma levels of insulin and HOMA-IR scores were changed only in male mice. The changes in adiposity in HFD-fed mice were also sex-dependent: the adipocyte size was increased significantly in male WT (HFD) and KO (HFD) mice but not in female. It has been shown that adipocyte hypertrophy, especially in the visceral fat compartment, is a significant predictor of the cardiovascular and metabolic alterations related to obesity.97,98 In fact, we have already observed an increased cardiac fibrosis in the male KO (HFD) mice. Cardiac fibrosis is strongly associated with obesity and metabolic dysfunction and may contribute to the increased myocardial stiffness and diastolic dysfunction,97,98 incidence of heart failure, atrial arrhythmias, and sudden cardiac death in obese subjects.99,100
It is important to note that our mouse studies evaluated a deletion of Atg7 to mimic autophagic deficiency, whereas in the human placenta with maternal obesity, expression of ATG7 was increased. Therefore, some of the phenotypes that we observed might be due to the uniqueness of ATG7-deficient placental tissue and might not be relevant to human studies.
Although this study provided initial evidence for the placental response to maternal obesity in a fetal sex-specific manner, the limited number of patients is a potential weakness. These findings cannot be generalized to the broader community based on this study alone, since in our cohort, no differences in birth weights or fetal outcomes were observed. Our results will have to be confirmed in a larger cohort, with longitudinal data to assess the full impact of this study.
In summary, we show that defective autophagy occurs in the placentas of obese mothers in a fetal sex-dependent manner, which might represent one of the mechanisms contributing to the placental dysfunction and to fetal programming of obesity and metabolic disease in later life.
Materials and methods
Ethical approval and study participants
Placentae were collected from the Labor and Delivery Unit at University Hospital under a protocol approved by the Institutional Review Board of the University of Texas Health Science Center San Antonio, with informed consent from the patients.
All procedures on animals were performed in accordance with our Institutional Guidelines for Animal Research and the investigation conformed to the Guide for the Care and Use of Laboratory Animals published by the US National Institutes of Health (NIH Publication No. 85–23, revised in 1996).
Materials
Monodansylcadaverine (MDC) and antibodies against SQSTM1/p62 (P0067) and ACTB (actin, β; A2228) were from Sigma. Antibodies against ATG3, ATG5, ATG7, MAP1LC3B, and BECN1 were combined into the Autophagy Antibody Sampler Kit from Cell Signaling Technology (4445). Five other antibodies were also purchased from Cell Signaling Technology: p-AMPK (2531), t-AMPK (2532), VAMP8 (13060), TFEB (4240) and CTSB/cathepsin B (3373). Anti-LAMP2 antibody was purchased from ABNOVA (H00003920-A01). Mouse endothelial marker anti-PLVAP/MECA32 antibody was purchased from Santa Cruz Biotechnology (sc-19603). Anti-TRP53 was purchased from Novus (NB 200–104), anti-PPARG from Santa Cruz Biotechnology (sc-1273) and antibodies against SOD1 and SOD2 and catalase (CAT) from Abcam (ab13498, ab13533 and ab16731, respectively). Anti-RPS6KB and anti-EIF4EBP1 antibodies were purchased from Cell Signaling Technology (9202 and 9955, respectively).
Collection of placental tissue
Placentas were collected at term immediately following delivery by elective Caesarean section (no labor) to avoid oxidative stress induced by labor from uncomplicated pregnancies in women with a range of pre-pregnancy or first trimester BMI ranging from 18.5 to 45, grouped as normal weight (NW, BMI 18.5–24.9), overweight (OW, BMI 25–29.9) and obese (OB, BMI>30).
Placental tissue processing and sampling
A random sampling technique was used to collect tissue from 5 sites in the placenta. Villous tissue 1×1×1 cm was dissected out from beneath the chorionic plate, avoiding the basal plate, flash frozen and stored at −80°C. Tissue was subsequently thawed, the 5 samples from each placenta combined and homogenized by mini bead beater (Biospec products, USA) in lysis buffer as described previously.12 Total protein in the homogenates was estimated using Bradford's reagent (Bio-Rad, 5000205).
Isolation and culture of primary trophoblasts
Villous cytotrophoblasts (CTs) were isolated from placental tissue of women with a range of adiposity using trypsin-DNAse digestion and a Percoll (Sigma, P4937) gradient purification method as we have previously described.101,102 Cytotrophoblasts spontaneously syncytialize with 72-h culture in DMEM-F12 +10% FBS.
Western blot analysis
Proteins (20 μg) were separated on 4–20% precast linear gradient gels (Bio-Rad), transferred to nitrocellulose membranes and blocked with 5% (w/v) nonfat milk in Tween 20 (0.1%)-TBS (Fisher, BP337 and BP2471) for 1 h. Membranes were incubated overnight at 4°C with primary antibody diluted in 1% nonfat milk (w/v) in Tween 20-TBS and detected using an appropriate peroxidase conjugated secondary antibody (anti-rabbit antibodies were from Cell Signaling Technology, 7074; and anti-mouse antibodies were from Amersham, NA931) diluted in the same manner. Products were visualized by ECL chemiluminescence (Millipore, WBKLS0050). Band intensities were measured using the G-box system (Syngene, Frederick, MD, USA).
Sphingolipid analysis
Lipids were extracted from villous placental tissue (˜100 mg) using 200 μL of water and 800 μL of ice-cold chloroform:methanol (2:1). Tissue samples were homogenized with a lyser from Biospec (Bartlesville, OK) for 2 min with a one-min break after the first min, and then maintained on ice for 30 min. After centrifugation at 13,800 x g for 10 min, the chloroform layer was removed, dried in vacuo and reconstituted in 50% isopropanol. HPLC-tandem-MS analyses were conducted on a Thermo Fisher Q Exactive fitted with a PicoChip nanospray source (New Objective, Woburn, MA, USA). HPLC conditions were: column, PicoChip (Waters Atlantis dC18; 150 μm × 105 mm; 3-μm particle); mobile phase A, acetonitrile/water (40:60) containing 10 mM ammonium acetate; mobile phase B, acetonitrile:isopropanol (10:90) containing 10 mM ammonium acetate; gradient (55 min total), 10 % B for 7 min (sample loading), 10 to 99 % B over 33 min, 99% B for 15 min; flow rate, 1 μl/min. Data-dependent analyses were conducted using one full MS scan (70,000 resolution, m/z 200) followed by 6 tandem-MS scans using the following parameters: detection, positive ion; dynamic exclusion, 10s. SIEVE (Thermo Fisher) was used to process the raw data files. Peak alignment and integration was performed and the relative abundance was generated for each lipid among the different experimental groups. Sphingolipid species were identified using LipidSearch (Thermo Fisher) and by searching the following databases: METLIN (http://metlin.scripps.edu/index.php) and LIPID MAPS (http://www.lipidmaps.org/data/structure/) using a 5-ppm mass tolerance. The putative lipid identifications were manually verified through examination of the tandem mass spectra and in comparison with the retention times from commercially available standards (Avanti Polar Lipids, 860644P-860650P (ceramides) and 860625P-860629P (dihydroceramides).
Labeling autophagic vacuoles with monodansylcadaverine
Primary trophoblasts from NW and OB women were grown in DMEM-F12 (Sigma, D6429 and 51651C) with 10% FBS (Sigma, F2442) on sterile coverslips pretreated with 1% gelatin (Sigma, G1393) as an adhesion solution. At 66 h after plating, the ST were washed with phosphate-buffered saline (PBS; GIBCO, 70011–044) and incubated either in amino acid-free DMEM without FBS to trigger an autophagic response, or in full DMEM-F12 medium. After 6 h of incubation, syncytiotrophoblasts were washed twice with PBS and incubated with 50 μM monodansylcadaverine (Sigma, 30432) in PBS at 37°C for 1 h. The cells were then washed 3 times with PBS and analyzed immediately by fluorescence microscopy (excitation filter of 360 nm and an emission filter of 525 nm). The images were captured with a CCD camera, and MDC staining was quantified using ImageJ (National Institutes of Health). After visualization of MDC, cells were fixed, permeabilized, blocked by 1% BSA (Sigma, A2153) in PBS, and counter-stained with Alexa Fluor 568 Phalloidin (Thermo Fisher, A20184), a high-affinity filamentous actin probe.
Generation and characterization of placenta-specific Atg7 knockout mice
To investigate the role of autophagy in placental function, we generated Atg7 conditional knockout mice by crossbreeding mice homozygous for the Atg7 flox allele (Atg7f/f) that were generated and provided by the RIKEN BRC through the National Bio-Resource Project of the MEXT, Japan103 with a line of transgenic mice that express the Cre-recombinase under the control of the 501 base pair region within the first exon of human CYP19 (exon I.1; generated and provided by Dr. Gustavo Leone, Ohio State University).104 CYP19A1/cytochrome P450 is an aromatase responsible for the conversion of C19 steroids to estrogens in various organs of the human body, including gonads, brain, adipose, fetal liver, and placenta. Whereas exons 2–10 contain the protein-coding sequence for CYP19A1, the first exon consists of tissue-specific regulatory sequences. A 501 base pair region within the first exon of human CYP19A1 (exon I.1) drives expression of a reporter transgene in mouse synciotrophoblasts.105,106 The placenta-specific Atg7 conditional knockout mice Atg7f/f/Cyp19a1-Cre were subsequently backcrossed to the C57BL/6 background for at least 9 generations. The genotypes of the mice were determined and deletion of Atg7 in placental tissue was confirmed by PCR using primers as described previously.103,104 The body weights of mutant and control mice were measured once every week after wk 3. For the dietary intervention, groups of mice at 8 wk of age were fed either a regular diet with 17 kcal% fat (Teklad LM-485 Mouse/Rat Sterilizable Diet) or a high-fat diet (HFD) with 45 kcal% fat (Harlan Teklad Adjusted Calories Diet TD.06415) for 12 wk, and body weights were measured once every week.
Placental morphology in Atg7 KO mice
One placenta from each of 5 WT and 5 KO mothers was collected by cesarean-section on d 18.5, hemisected, fixed and processed. Paraffin-embedded mouse placenta sections (5 μm) were mounted on glass slides and stained with PLVAP/MECA32. In each section, the total placenta area, the maternal decidua, the endocrine (junctional) zone (Jz) and the labyrinth zone (Lab), responsible for maternal-fetal nutrient transfer, were measured using ImageJ software.
Determination of plasma insulin and serum ADIPOQ/adiponectin
Plasma insulin levels were measured using the Mercodia ultrasensitive mouse Insulin Elisa Kit (Mercodia, 10-1249-01). The serum ADIPOQ level was determined with ADIPOQ ELISA kit from Thermo Fisher Scientific (KMP0041). Insulin resistance estimation was carried out using the homeostasis model assessment method, HOMA-IR, and was calculated using the following formula: Plasma glucose (converted to mmol/L) × plasma insulin (pmol/L) collected at sacrifice in the fasting state divided by 405 as described before.107,108
Histology
For light microscopy, adipose and cardiac tissues were processed and embedded in paraffin. Sections (5-mm thick) were cut from paraffin-embedded specimens and stained with hematoxylin and eosin (adipose tissue) or Masson's trichrome staining (cardiac tissue). To quantify the adipocyte areas, H&E images were captured at 40X magnification and analyzed using Gene Tools from Syngene. Adipocytes were analyzed if they met the following criteria: (1) the adipocyte contains an area between 500 and 50,000 pixels; (2) the adipocyte has a shape factor of 0.35–1 (a shape factor of 0 indicating a straight line and 1 a perfect circle); and (3) the adipocyte does not border the image frame. From 100 to 200 adipocytes were analyzed in each group. Cardiac fibrosis areas within sections were measured by visualizing blue-stained areas, exclusive of staining that colocalized with intramural vascular structures. Using ImageJ software (http://rsbweb.nih.gov/ij/), we used color-based thresholding to determine blue-stained areas and nonstained myocyte areas from each section. The percentage of total fibrotic area was calculated as the summed blue-stained areas divided by total ventricular area, as described previously.109
Statistical analysis
Data are reported as mean ± SEM. Comparisons of clinical characteristics between groups were performed with the Student t test. Western blot data from human placentas were analyzed using Kruskal-Wallis test with Mann-Whitney U post hoc test. Other experiments were analyzed using one-way analyses of variance (ANOVA) with Tukey's post hoc test used where appropriate. P<0.05 was considered as significant.
Supplementary Material
ABBREVIATIONS
- ACTB
actin, β
- AMPK
AMP-activated protein kinase
- BCL2
B-cell CLL/lymphoma 2
- BMI
body mass index
- CAT
catalase
- EIF4EBP1
eukaryotic translation initiation factor 4E binding protein 1
- GAPDH
glyceraldehyde-3-phosphate dehydrogenase
- HFD
high-fat diet
- HOMA-IR
homeostasis model assessment-insulin resistance
- KO
knockout
- LAMP2
lysosomal-associated membrane protein 2
- MAP1LC3B
microtubule-associated protein 1 light chain 3 β
- MDC
monodansylcadaverine
- MTOR
mechanistic target of rapamycin (serine/threonine kinase)
- NW
normal weight
- OB
obese
- OW
overweight
- PPARG
peroxisome proliferator activated receptor gamma
- RD
regular diet
- ROS
reactive oxygen species
- RPS6KB
ribosomal protein S6 kinase, 70kDa
- ST
syncytiotrophoblasts
- SNAP29
synaptosome associated protein 29kDa
- SOD1
superoxide dismutase 1, soluble
- SOD2
superoxide dismutase 2, mitochondrial
- ST
syncytiotrophoblasts
- STX17
syntaxin 17
- SQSTM1/p62
sequestosome 1
- TFEB
transcription factor EB
- TRP53
transformation related protein 53
- VAMP8
vesicle associated membrane protein 8
Disclosure of potential conflicts of interest
No potential conflicts of interest were disclosed.
Acknowledgments
The authors thank women who donated their placentas for this study. We are grateful for the mouse models generated and provided to our research by Dr. Gustavo Leone (Ohio State University) and RIKEN BRC through the National Bio-Resource Project of the MEXT (Japan).
Funding
Authors are grateful for funding sources NIH HD076259A (LM and AM) and CTSA grants (UL1RR025767 and UL1TR001120) (AM). Animal studies were funded by Departmental Funds (AM).
References
- [1].Aye IL, Lager S, Ramirez VI, Gaccioli F, Dudley DJ, Jansson T, Powell TL. Increasing maternal body mass index is associated with systemic inflammation in the mother and the activation of distinct placental inflammatory pathways. Biol Reprod 2014; 90:129; PMID:24759787; http://dx.doi.org/ 10.1095/biolreprod.113.116186 [DOI] [PMC free article] [PubMed] [Google Scholar]
- [2].Challier JC, Basu S, Bintein T, Minium J, Hotmire K, Catalano PM, Hauguel-de Mouzon S. Obesity in pregnancy stimulates macrophage accumulation and inflammation in the placenta. Placenta 2008; 29:274-81; PMID:18262644; http://dx.doi.org/ 10.1016/j.placenta.2007.12.010 [DOI] [PMC free article] [PubMed] [Google Scholar]
- [3].Hendler I, Blackwell SC, Mehta SH, Whitty JE, Russell E, Sorokin Y, Cotton DB. The levels of leptin, adiponectin, and resistin in normal weight, overweight, and obese pregnant women with and without preeclampsia. Am J Obstet Gynecol 2005; 193:979-83; PMID:16157097; http://dx.doi.org/ 10.1016/j.ajog.2005.06.041 [DOI] [PubMed] [Google Scholar]
- [4].Gluckman PD, Hanson MA, Low FM. The role of developmental plasticity and epigenetics in human health. Birth Defects Res C Embryo Today 2011; 93:12-8; PMID:21425438; http://dx.doi.org/ 10.1002/bdrc.20198 [DOI] [PubMed] [Google Scholar]
- [5].Rogers LK, Velten M. Maternal inflammation, growth retardation, and preterm birth: insights into adult cardiovascular disease. Life Sci 2011; 89:417-21; PMID:21821056; http://dx.doi.org/ 10.1016/j.lfs.2011.07.017 [DOI] [PubMed] [Google Scholar]
- [6].Yogev Y, Catalano PM. Pregnancy and obesity. Obstet Gynecol Clin North Am 2009; 36:285-300, viii; PMID:19501314; http://dx.doi.org/ 10.1016/j.ogc.2009.03.003 [DOI] [PubMed] [Google Scholar]
- [7].Carter AM. Evolution of placental function in mammals: the molecular basis of gas and nutrient transfer, hormone secretion, and immune responses. Physiol Rev 2012; 92:1543-76; PMID:23073626; http://dx.doi.org/ 10.1152/physrev.00040.2011 [DOI] [PubMed] [Google Scholar]
- [8].Jansson T, Powell TL. Role of the placenta in fetal programming: underlying mechanisms and potential interventional approaches. Clin Sci (Lond) 2007; 113:1-13; PMID:17536998; http://dx.doi.org/ 10.1042/CS20060339 [DOI] [PubMed] [Google Scholar]
- [9].Burton GJ, Fowden AL. Review: The placenta and developmental programming: balancing fetal nutrient demands with maternal resource allocation. Placenta 2012; 33 Suppl:S23-7; PMID:22154688; http://dx.doi.org/ 10.1016/j.placenta.2011.11.013 [DOI] [PubMed] [Google Scholar]
- [10].Myatt L. Placental adaptive responses and fetal programming. J Physiol 2006; 572:25-30; PMID:16469781; http://dx.doi.org/ 10.1113/jphysiol.2006.104968 [DOI] [PMC free article] [PubMed] [Google Scholar]
- [11].Myatt L, Cui X. Oxidative stress in the placenta. Histochem Cell Biol 2004; 122(4):369-82; PMID:15248072 [DOI] [PubMed] [Google Scholar]
- [12].Roberts VH, Smith J, McLea SA, Heizer AB, Richardson JL, Myatt L. Effect of increasing maternal body mass index on oxidative and nitrative stress in the human placenta. Placenta 2009; 30:169-75; PMID:19100619; http://dx.doi.org/ 10.1016/j.placenta.2008.11.019 [DOI] [PMC free article] [PubMed] [Google Scholar]
- [13].Mele J, Muralimanoharan S, Maloyan A, Myatt L. Impaired mitochondrial function in human placenta with increased maternal adiposity. Am J Physiol Endocrinol Metab 2014; 307:E419-25; PMID:25028397; http://dx.doi.org/ 10.1152/ajpendo.00025.2014 [DOI] [PMC free article] [PubMed] [Google Scholar]
- [14].Ebato C, Uchida T, Arakawa M, Komatsu M, Ueno T, Komiya K, Azuma K, Hirose T, Tanaka K, Kominami E, et al.. Autophagy is important in islet homeostasis and compensatory increase of β cell mass in response to high-fat diet. Cell Metab 2008; 8:325-32; PMID:18840363; http://dx.doi.org/ 10.1016/j.cmet.2008.08.009 [DOI] [PubMed] [Google Scholar]
- [15].Jung HS, Lee MS. Role of autophagy in diabetes and mitochondria. Ann N Y Acad Sci 2010; 1201:79-83; PMID:20649543; http://dx.doi.org/ 10.1111/j.1749-6632.2010.05614.x [DOI] [PubMed] [Google Scholar]
- [16].Quan W, Jung HS, Lee MS. Role of autophagy in the progression from obesity to diabetes and in the control of energy balance. Arch Pharm Res 2013; 36:223-9; PMID:23371805; http://dx.doi.org/ 10.1007/s12272-013-0024-7 [DOI] [PubMed] [Google Scholar]
- [17].Barth S, Glick D, Macleod KF. Autophagy: assays and artifacts. J Pathol 2010; 221:117-24; PMID:20225337; http://dx.doi.org/ 10.1002/path.2694 [DOI] [PMC free article] [PubMed] [Google Scholar]
- [18].Glick D, Barth S, Macleod KF. Autophagy: cellular and molecular mechanisms. J Pathol 2010; 221:3-12; PMID:20225336; http://dx.doi.org/ 10.1002/path.2697 [DOI] [PMC free article] [PubMed] [Google Scholar]
- [19].Green DR, Levine B. To be or not to be? How selective autophagy and cell death govern cell fate. Cell 2014; 157:65-75; PMID:24679527; http://dx.doi.org/ 10.1016/j.cell.2014.02.049 [DOI] [PMC free article] [PubMed] [Google Scholar]
- [20].Kaushik S, Rodriguez-Navarro JA, Arias E, Kiffin R, Sahu S, Schwartz GJ, Cuervo AM, Singh R. Autophagy in hypothalamic AgRP neurons regulates food intake and energy balance. Cell Metab 2011; 14:173-83; PMID:21803288; http://dx.doi.org/ 10.1016/j.cmet.2011.06.008 [DOI] [PMC free article] [PubMed] [Google Scholar]
- [21].Wu SB, Wu YT, Wu TP, Wei YH. Role of AMPK-mediated adaptive responses in human cells with mitochondrial dysfunction to oxidative stress. Biochim Biophys Acta 2014; 1840:1331-44; PMID:24513455; http://dx.doi.org/ 10.1016/j.bbagen.2013.10.034 [DOI] [PubMed] [Google Scholar]
- [22].Hardie DG. AMPK: positive and negative regulation, and its role in whole-body energy homeostasis. Curr Opin Cell Biol 2014; 33C:1-7 [DOI] [PubMed] [Google Scholar]
- [23].Pietrocola F, Izzo V, Niso-Santano M, Vacchelli E, Galluzzi L, Maiuri MC, Kroemer G. Regulation of autophagy by stress-responsive transcription factors. Semin Cancer Biol 2013; 23:310-22; PMID:23726895; http://dx.doi.org/ 10.1016/j.semcancer.2013.05.008 [DOI] [PubMed] [Google Scholar]
- [24].Egan DF, Shackelford DB, Mihaylova MM, Gelino S, Kohnz RA, Mair W, Vasquez DS, Joshi A, Gwinn DM, Taylor R, et al.. Phosphorylation of ULK1 (hATG1) by AMP-activated protein kinase connects energy sensing to mitophagy. Science 2011; 331:456-61; PMID:21205641; http://dx.doi.org/ 10.1126/science.1196371 [DOI] [PMC free article] [PubMed] [Google Scholar]
- [25].Kim J, Kim YC, Fang C, Russell RC, Kim JH, Fan W, Liu R, Zhong Q, Guan KL. Differential regulation of distinct Vps34 complexes by AMPK in nutrient stress and autophagy. Cell 2013; 152:290-303; PMID:23332761; http://dx.doi.org/ 10.1016/j.cell.2012.12.016 [DOI] [PMC free article] [PubMed] [Google Scholar]
- [26].Pattingre S, Tassa A, Qu X, Garuti R, Liang XH, Mizushima N, Packer M, Schneider MD, Levine B. Bcl-2 antiapoptotic proteins inhibit Beclin 1-dependent autophagy. Cell 2005; 122:927-39; PMID:16179260; http://dx.doi.org/ 10.1016/j.cell.2005.07.002 [DOI] [PubMed] [Google Scholar]
- [27].Grosch S, Schiffmann S, Geisslinger G. Chain length-specific properties of ceramides. Prog Lipid Res 2012; 51:50-62; PMID:22133871; http://dx.doi.org/ 10.1016/j.plipres.2011.11.001 [DOI] [PubMed] [Google Scholar]
- [28].Mizushima N, Yoshimori T, Ohsumi Y. The role of Atg proteins in autophagosome formation. Annu Rev Cell Dev Biol 2011; 27:107-32; PMID:21801009; http://dx.doi.org/ 10.1146/annurev-cellbio-092910-154005 [DOI] [PubMed] [Google Scholar]
- [29].Bjorkoy G, Lamark T, Pankiv S, Overvatn A, Brech A, Johansen T. Monitoring autophagic degradation of p62/SQSTM1. Methods Enzymol 2009; 452:181-97; PMID:19200883; http://dx.doi.org/ 10.1016/S0076-6879(08)03612-4 [DOI] [PubMed] [Google Scholar]
- [30].Settembre C, Fraldi A, Medina DL, Ballabio A. Signals from the lysosome: a control centre for cellular clearance and energy metabolism. Nat Rev Mol Cell Biol 2013; 14:283-96; PMID:23609508; http://dx.doi.org/ 10.1038/nrm3565 [DOI] [PMC free article] [PubMed] [Google Scholar]
- [31].Itakura E, Kishi-Itakura C, Mizushima N. The hairpin-type tail-anchored SNARE syntaxin 17 targets to autophagosomes for fusion with endosomes/lysosomes. Cell 2012; 151:1256-69; PMID:23217709; http://dx.doi.org/ 10.1016/j.cell.2012.11.001 [DOI] [PubMed] [Google Scholar]
- [32].Levine B. Eating oneself and uninvited guests: autophagy-related pathways in cellular defense. Cell 2005; 120:159-62; PMID:15680321 [DOI] [PubMed] [Google Scholar]
- [33].Settembre C, De Cegli R, Mansueto G, Saha PK, Vetrini F, Visvikis O, Huynh T, Carissimo A, Palmer D, Klisch TJ, et al.. TFEB controls cellular lipid metabolism through a starvation-induced autoregulatory loop. Nat Cell Biol 2013; 15:647-58; PMID:23604321; http://dx.doi.org/ 10.1038/ncb2718 [DOI] [PMC free article] [PubMed] [Google Scholar]
- [34].Vazquez CL, Colombo MI. Assays to assess autophagy induction and fusion of autophagic vacuoles with a degradative compartment, using monodansylcadaverine (MDC) and DQ-BSA. Methods Enzymol 2009; 452:85-95; PMID:19200877; http://dx.doi.org/ 10.1016/S0076-6879(08)03606-9 [DOI] [PubMed] [Google Scholar]
- [35].Barak Y, Sadovsky Y, Shalom-Barak T. PPAR Signaling in Placental Development and Function. PPAR Res 2008; 2008:142082; PMID:18288278; http://dx.doi.org/ 10.1155/2008/142082 [DOI] [PMC free article] [PubMed] [Google Scholar]
- [36].Heazell AE, Sharp AN, Baker PN, Crocker IP. Intra-uterine growth restriction is associated with increased apoptosis and altered expression of proteins in the p53 pathway in villous trophoblast. Apoptosis 2011; 16:135-44; PMID:21052841; http://dx.doi.org/ 10.1007/s10495-010-0551-3 [DOI] [PubMed] [Google Scholar]
- [37].Levy R, Smith SD, Yusuf K, Huettner PC, Kraus FT, Sadovsky Y, Nelson DM. Trophoblast apoptosis from pregnancies complicated by fetal growth restriction is associated with enhanced p53 expression. Am J Obstet Gynecol 2002; 186:1056-61; PMID:12015537; http://dx.doi.org/ 10.1067/mob.2002.122250 [DOI] [PubMed] [Google Scholar]
- [38].Burton GJ, Yung HW, Cindrova-Davies T, Charnock-Jones DS. Placental endoplasmic reticulum stress and oxidative stress in the pathophysiology of unexplained intrauterine growth restriction and early onset preeclampsia. Placenta 2009; 30 Suppl A:S43-8; PMID:19081132; http://dx.doi.org/ 10.1016/j.placenta.2008.11.003 [DOI] [PMC free article] [PubMed] [Google Scholar]
- [39].Osellame LD, Duchen MR. Quality control gone wrong: mitochondria, lysosomal storage disorders and neurodegeneration. Br J Pharmacol 2014; 171:1958-72; PMID:24116849; http://dx.doi.org/ 10.1111/bph.12453 [DOI] [PMC free article] [PubMed] [Google Scholar]
- [40].Schiavi A, Ventura N. The interplay between mitochondria and autophagy and its role in the aging process. Exp Gerontol 2014; 56:147-53; PMID:24607515; http://dx.doi.org/ 10.1016/j.exger.2014.02.015 [DOI] [PubMed] [Google Scholar]
- [41].Wang Z, Li L, Zhao H, Peng S, Zuo Z. Chronic high fat diet induces cardiac hypertrophy and fibrosis in mice. Metabolism 2015; 64:917-25; PMID:25982698; http://dx.doi.org/ 10.1016/j.metabol.2015.04.010 [DOI] [PMC free article] [PubMed] [Google Scholar]
- [42].Aubin MC, Lajoie C, Clement R, Gosselin H, Calderone A, Perrault LP. Female rats fed a high-fat diet were associated with vascular dysfunction and cardiac fibrosis in the absence of overt obesity and hyperlipidemia: therapeutic potential of resveratrol. J Pharmacol Exp Ther 2008; 325:961-8; PMID:18356487; http://dx.doi.org/ 10.1124/jpet.107.135061 [DOI] [PubMed] [Google Scholar]
- [43].Wang K, Klionsky DJ. Mitochondria removal by autophagy. Autophagy 2011; 7:297-300; PMID:21252623; http://dx.doi.org/ 10.4161/auto.7.3.14502 [DOI] [PMC free article] [PubMed] [Google Scholar]
- [44].Clifton VL, Murphy VE. Maternal asthma as a model for examining fetal sex-specific effects on maternal physiology and placental mechanisms that regulate human fetal growth. Placenta 2004; 25 Suppl A:S45-52; PMID:15033307; http://dx.doi.org/ 10.1016/j.placenta.2004.01.004 [DOI] [PubMed] [Google Scholar]
- [45].Stark MJ, Clifton VL, Wright IM. Neonates born to mothers with preeclampsia exhibit sex-specific alterations in microvascular function. Pediatric Res 2009; 65:292-5; PMID:19391250; http://dx.doi.org/ 10.1203/PDR.0b013e318193edf1 [DOI] [PubMed] [Google Scholar]
- [46].Doyle C, Werner E, Feng T, Lee S, Altemus M, Isler JR, Monk C. Pregnancy distress gets under fetal skin: Maternal ambulatory assessment & sex differences in prenatal development. Dev Psychobiol 2015; 57(5):607-25; PMID:25945698 [DOI] [PMC free article] [PubMed] [Google Scholar]
- [47].Clifton VL. Review: Sex and the human placenta: mediating differential strategies of fetal growth and survival. Placenta 2010; 31 Suppl:S33-9; PMID:20004469; http://dx.doi.org/ 10.1016/j.placenta.2009.11.010 [DOI] [PubMed] [Google Scholar]
- [48].Sewell MF, Huston-Presley L, Super DM, Catalano P. Increased neonatal fat mass, not lean body mass, is associated with maternal obesity. Am J Obstet Gynecol 2006; 195:1100-3; PMID:16875645; http://dx.doi.org/ 10.1016/j.ajog.2006.06.014 [DOI] [PubMed] [Google Scholar]
- [49].Chifenti B, Locci MT, Lazzeri G, Guagnozzi M, Dinucci D, Chiellini F, Filice ME, Salerno MG, Battini L. Autophagy-related protein LC3 and Beclin-1 in the first trimester of pregnancy. Clin Exp Reprod Med 2013; 40:33-7; PMID:23614114; http://dx.doi.org/ 10.5653/cerm.2013.40.1.33 [DOI] [PMC free article] [PubMed] [Google Scholar]
- [50].Signorelli P, Avagliano L, Virgili E, Gagliostro V, Doi P, Braidotti P, Bulfamante GP, Ghidoni R, Marconi AM. Autophagy in term normal human placentas. Placenta 2011; 32:482-5; PMID:21459442; http://dx.doi.org/ 10.1016/j.placenta.2011.03.005 [DOI] [PubMed] [Google Scholar]
- [51].Delorme-Axford E, Bayer A, Sadovsky Y, Coyne CB. Autophagy as a mechanism of antiviral defense at the maternal? fetal interface. Autophagy 2013; 9:2173-4; PMID:24231730; http://dx.doi.org/ 10.4161/auto.26558 [DOI] [PubMed] [Google Scholar]
- [52].Hung TH, Chen SF, Lo LM, Li MJ, Yeh YL, Hsieh TT. Increased autophagy in placentas of intrauterine growth-restricted pregnancies. PLoS One 2012; 7:e40957; PMID:22815878; http://dx.doi.org/ 10.1371/journal.pone.0040957 [DOI] [PMC free article] [PubMed] [Google Scholar]
- [53].Oh SY, Choi SJ, Kim KH, Cho EY, Kim JH, Roh CR. Autophagy-related proteins, LC3 and Beclin-1, in placentas from pregnancies complicated by preeclampsia. Reprod Sci 2008; 15:912-20; PMID:19050324; http://dx.doi.org/ 10.1177/1933719108319159 [DOI] [PubMed] [Google Scholar]
- [54].Gwinn DM, Shackelford DB, Egan DF, Mihaylova MM, Mery A, Vasquez DS, Turk BE, Shaw RJ. AMPK phosphorylation of raptor mediates a metabolic checkpoint. Mol Cell 2008; 30:214-26; PMID:18439900; http://dx.doi.org/ 10.1016/j.molcel.2008.03.003 [DOI] [PMC free article] [PubMed] [Google Scholar]
- [55].Kim J, Kundu M, Viollet B, Guan KL. AMPK and mTOR regulate autophagy through direct phosphorylation of Ulk1. Nat Cell Biol 2011; 13:132-41; PMID:21258367; http://dx.doi.org/ 10.1038/ncb2152 [DOI] [PMC free article] [PubMed] [Google Scholar]
- [56].Moscat J, Diaz-Meco MT. p62 at the crossroads of autophagy, apoptosis, and cancer. Cell 2009; 137:1001-4; PMID:19524504; http://dx.doi.org/ 10.1016/j.cell.2009.05.023 [DOI] [PMC free article] [PubMed] [Google Scholar]
- [57].Zhang Y, Xu X, Ren J. MTOR overactivation and interrupted autophagy flux in obese hearts: a dicey assembly? Autophagy 2013; 9:939-41; PMID:23529215; http://dx.doi.org/ 10.4161/auto.24398 [DOI] [PMC free article] [PubMed] [Google Scholar]
- [58].Yang L, Li P, Fu S, Calay ES, Hotamisligil GS. Defective hepatic autophagy in obesity promotes ER stress and causes insulin resistance. Cell Metab 2010; 11:467-78; PMID:20519119; http://dx.doi.org/ 10.1016/j.cmet.2010.04.005 [DOI] [PMC free article] [PubMed] [Google Scholar]
- [59].Stumptner C, Fuchsbichler A, Heid H, Zatloukal K, Denk H. Mallory body–a disease-associated type of sequestosome. Hepatology 2002; 35:1053-62; PMID:11981755; http://dx.doi.org/ 10.1053/jhep.2002.32674 [DOI] [PubMed] [Google Scholar]
- [60].Zatloukal K, Stumptner C, Fuchsbichler A, Heid H, Schnoelzer M, Kenner L, Kleinert R, Prinz M, Aguzzi A, Denk H. p62 Is a common component of cytoplasmic inclusions in protein aggregation diseases. Am J Pathol 2002; 160:255-63; PMID:11786419; http://dx.doi.org/ 10.1016/S0002-9440(10)64369-6 [DOI] [PMC free article] [PubMed] [Google Scholar]
- [61].Ignacio-Souza LM, Bombassaro B, Pascoal LB, Portovedo MA, Razolli DS, Coope A, Victorio SC, de Moura RF, Nascimento LF, Arruda AP, et al.. Defective regulation of the ubiquitin/proteasome system in the hypothalamus of obese male mice. Endocrinology 2014; 155:2831-44; PMID:24892821; http://dx.doi.org/ 10.1210/en.2014-1090 [DOI] [PubMed] [Google Scholar]
- [62].Jaishy B, Zhang Q, Chung HS, Riehle C, Soto J, Jenkins S, Abel P, Cowart LA, Van Eyk JE, Abel ED. Lipid-induced NOX2 activation inhibits autophagic flux by impairing lysosomal enzyme activity. J Lipid Res 2015; 56:546-61; PMID:25529920; http://dx.doi.org/ 10.1194/jlr.M055152 [DOI] [PMC free article] [PubMed] [Google Scholar]
- [63].Juarez-Rojas JG, Reyes-Soffer G, Conlon D, Ginsberg HN. Autophagy and cardiometabolic risk factors. Rev Endocr Metab Disord 2014; 15:307-15; PMID:25246308; http://dx.doi.org/ 10.1007/s11154-014-9295-7 [DOI] [PMC free article] [PubMed] [Google Scholar]
- [64].Meng Q, Cai D. Defective hypothalamic autophagy directs the central pathogenesis of obesity via the IkappaB kinase β (IKKbeta)/NF-kappaB pathway. J Biol Chem 2011; 286:32324-32; PMID:21784844; http://dx.doi.org/ 10.1074/jbc.M111.254417 [DOI] [PMC free article] [PubMed] [Google Scholar]
- [65].Kosacka J, Kern M, Kloting N, Paeschke S, Rudich A, Haim Y, Gericke M, Serke H, Stumvoll M, Bechmann I, et al.. Autophagy in adipose tissue of patients with obesity and type 2 diabetes. Mol Cell Endocrinol 2015; 409:21-32; PMID:25818883; http://dx.doi.org/ 10.1016/j.mce.2015.03.015 [DOI] [PubMed] [Google Scholar]
- [66].Quan W, Kim HK, Moon EY, Kim SS, Choi CS, Komatsu M, Jeong YT, Lee MK, Kim KW, Kim MS, et al.. Role of hypothalamic proopiomelanocortin neuron autophagy in the control of appetite and leptin response. Endocrinology 2012; 153:1817-26; PMID:22334718; http://dx.doi.org/ 10.1210/en.2011-1882 [DOI] [PubMed] [Google Scholar]
- [67].Las G, Serada SB, Wikstrom JD, Twig G, Shirihai OS. Fatty acids suppress autophagic turnover in β-cells. J Biol Chem 2011; 286:42534-44; PMID:21859708; http://dx.doi.org/ 10.1074/jbc.M111.242412 [DOI] [PMC free article] [PubMed] [Google Scholar]
- [68].Park HW, Park H, Semple IA, Jang I, Ro SH, Kim M, Cazares VA, Stuenkel EL, Kim JJ, Kim JS, et al.. Pharmacological correction of obesity-induced autophagy arrest using calcium channel blockers. Nat Commun 2014; 5:4834; PMID:25189398; http://dx.doi.org/ 10.1038/ncomms5834 [DOI] [PMC free article] [PubMed] [Google Scholar]
- [69].Lepine S, Allegood JC, Edmonds Y, Milstien S, Spiegel S. Autophagy induced by deficiency of sphingosine-1-phosphate phosphohydrolase 1 is switched to apoptosis by calpain-mediated autophagy-related gene 5 (Atg5) cleavage. J Biol Chem 2011; 286:44380-90; PMID:22052905; http://dx.doi.org/ 10.1074/jbc.M111.257519 [DOI] [PMC free article] [PubMed] [Google Scholar]
- [70].Scarlatti F, Bauvy C, Ventruti A, Sala G, Cluzeaud F, Vandewalle A, Ghidoni R, Codogno P. Ceramide-mediated macroautophagy involves inhibition of protein kinase B and up-regulation of beclin 1. J Biol Chem 2004; 279:18384-91; PMID:14970205; http://dx.doi.org/ 10.1074/jbc.M313561200 [DOI] [PubMed] [Google Scholar]
- [71].Sims K, Haynes CA, Kelly S, Allegood JC, Wang E, Momin A, Leipelt M, Reichart D, Glass CK, Sullards MC, et al.. Kdo2-lipid A, a TLR4-specific agonist, induces de novo sphingolipid biosynthesis in RAW264.7 macrophages, which is essential for induction of autophagy. J Biol Chem 2010; 285:38568-79; PMID:20876532; http://dx.doi.org/ 10.1074/jbc.M110.170621 [DOI] [PMC free article] [PubMed] [Google Scholar]
- [72].Sentelle RD, Senkal CE, Jiang W, Ponnusamy S, Gencer S, Selvam SP, Ramshesh VK, Peterson YK, Lemasters JJ, Szulc ZM, et al.. Ceramide targets autophagosomes to mitochondria and induces lethal mitophagy. Nat Chem Biol 2012; 8:831-8; PMID:22922758; http://dx.doi.org/ 10.1038/nchembio.1059 [DOI] [PMC free article] [PubMed] [Google Scholar]
- [73].Signorelli P, Munoz-Olaya JM, Gagliostro V, Casas J, Ghidoni R, Fabrias G. Dihydroceramide intracellular increase in response to resveratrol treatment mediates autophagy in gastric cancer cells. Cancer Lett 2009; 282:238-43; PMID:19394759; http://dx.doi.org/ 10.1016/j.canlet.2009.03.020 [DOI] [PubMed] [Google Scholar]
- [74].Zheng W, Kollmeyer J, Symolon H, Momin A, Munter E, Wang E, Kelly S, Allegood JC, Liu Y, Peng Q, et al.. Ceramides and other bioactive sphingolipid backbones in health and disease: lipidomic analysis, metabolism and roles in membrane structure, dynamics, signaling and autophagy. Biochim Biophys Acta 2006; 1758:1864-84; PMID:17052686; http://dx.doi.org/ 10.1016/j.bbamem.2006.08.009 [DOI] [PubMed] [Google Scholar]
- [75].Huang S, Sinicrope FA. Celecoxib-induced apoptosis is enhanced by ABT-737 and by inhibition of autophagy in human colorectal cancer cells. Autophagy 2010; 6:256-69; PMID:20104024; http://dx.doi.org/ 10.4161/auto.6.2.11124 [DOI] [PMC free article] [PubMed] [Google Scholar]
- [76].Eriksson JG, Kajantie E, Osmond C, Thornburg K, Barker DJ. Boys live dangerously in the womb. Am J Hum Biol 2010; 22:330-5; PMID:19844898; http://dx.doi.org/ 10.1002/ajhb.20995 [DOI] [PMC free article] [PubMed] [Google Scholar]
- [77].Sood R, Zehnder JL, Druzin ML, Brown PO. Gene expression patterns in human placenta. Proc Natl Acad Sci U S A 2006; 103:5478-83; PMID:16567644; http://dx.doi.org/ 10.1073/pnas.0508035103 [DOI] [PMC free article] [PubMed] [Google Scholar]
- [78].Buckberry S, Bianco-Miotto T, Bent SJ, Dekker GA, Roberts CT. Integrative transcriptome meta-analysis reveals widespread sex-biased gene expression at the human fetal-maternal interface. Mol Hum Reprod 2014; 20:810-9; PMID:24867328; http://dx.doi.org/ 10.1093/molehr/gau035 [DOI] [PMC free article] [PubMed] [Google Scholar]
- [79].Osei-Kumah A, Smith R, Jurisica I, Caniggia I, Clifton VL. Sex-specific differences in placental global gene expression in pregnancies complicated by asthma. Placenta 2011; 32:570-8; PMID:21641640; http://dx.doi.org/ 10.1016/j.placenta.2011.05.005 [DOI] [PubMed] [Google Scholar]
- [80].Prescott SL, Clifton V. Asthma and pregnancy: emerging evidence of epigenetic interactions in utero. Curr Opin Allergy Clin Immunol 2009; 9:417-26; PMID:19652594; http://dx.doi.org/ 10.1097/ACI.0b013e328330634f [DOI] [PubMed] [Google Scholar]
- [81].Clifton VL. Sexually dimorphic effects of maternal asthma during pregnancy on placental glucocorticoid metabolism and fetal growth. Cell Tissue Res 2005; 322:63-71; PMID:16052336; http://dx.doi.org/ 10.1007/s00441-005-1117-5 [DOI] [PubMed] [Google Scholar]
- [82].Mao J, Zhang X, Sieli PT, Falduto MT, Torres KE, Rosenfeld CS. Contrasting effects of different maternal diets on sexually dimorphic gene expression in the murine placenta. Proc Natl Acad Sci U S A 2010; 107:5557-62; PMID:20212133; http://dx.doi.org/ 10.1073/pnas.1000440107 [DOI] [PMC free article] [PubMed] [Google Scholar]
- [83].Muralimanoharan S, Guo C, Myatt L, Maloyan A. Sexual dimorphism in miR-210 expression and mitochondrial dysfunction in the placenta with maternal obesity. Int J Obes (Lond) 2015; 39:1274-81; PMID:25833255; http://dx.doi.org/ 10.1038/ijo.2015.45 [DOI] [PMC free article] [PubMed] [Google Scholar]
- [84].Cosper PF, Leinwand LA. Cancer causes cardiac atrophy and autophagy in a sexually dimorphic manner. Cancer Res 2011; 71:1710-20; PMID:21163868; http://dx.doi.org/ 10.1158/0008-5472.CAN-10-3145 [DOI] [PMC free article] [PubMed] [Google Scholar]
- [85].Du L, Hickey RW, Bayir H, Watkins SC, Tyurin VA, Guo F, Kochanek PM, Jenkins LW, Ren J, Gibson G, et al.. Starving neurons show sex difference in autophagy. J Biol Chem 2009; 284:2383-96; PMID:19036730; http://dx.doi.org/ 10.1074/jbc.M804396200 [DOI] [PMC free article] [PubMed] [Google Scholar]
- [86].Koenig A, Sateriale A, Budd RC, Huber SA, Buskiewicz IA. The role of sex differences in autophagy in the heart during coxsackievirus B3-induced myocarditis. J Cardiovasc Transl Res 2014; 7:182-91; PMID:24323874; http://dx.doi.org/ 10.1007/s12265-013-9525-5 [DOI] [PMC free article] [PubMed] [Google Scholar]
- [87].Weis SN, Toniazzo AP, Ander BP, Zhan X, Careaga M, Ashwood P, Wyse AT, Netto CA, Sharp FR. Autophagy in the brain of neonates following hypoxia-ischemia shows sex- and region-specific effects. Neuroscience 2014; 256:201-9; PMID:24184979; http://dx.doi.org/ 10.1016/j.neuroscience.2013.10.046 [DOI] [PubMed] [Google Scholar]
- [88].Burton GJ, Fowden AL. The placenta: a multifaceted, transient organ. Philos Trans R Soc Lond B Biol Sci 2015; 370:20140066; PMID:25602070; http://dx.doi.org/ 10.1098/rstb.2014.0066 [DOI] [PMC free article] [PubMed] [Google Scholar]
- [89].Salamalekis E, Bakas P, Vitoratos N, Eleptheriadis M, Creatsas G. Androgen levels in the third trimester of pregnancy in patients with preeclampsia. Eur J Obstet Gynecol Reprod Biol 2006; 126:16-9; PMID:16139944; http://dx.doi.org/ 10.1016/j.ejogrb.2005.07.007 [DOI] [PubMed] [Google Scholar]
- [90].Laivuori H, Kaaja R, Rutanen EM, Viinikka L, Ylikorkala O. Evidence of high circulating testosterone in women with prior preeclampsia. J Clin Endocrinol Metab 1998; 83:344-7; PMID:9467538 [DOI] [PubMed] [Google Scholar]
- [91].Ortega HH, Salvetti NR, Padmanabhan V. Developmental programming: prenatal androgen excess disrupts ovarian steroid receptor balance. Reproduction 2009; 137:865-77; PMID:19261835; http://dx.doi.org/ 10.1530/REP-08-0491 [DOI] [PMC free article] [PubMed] [Google Scholar]
- [92].King AJ, Olivier NB, Mohankumar PS, Lee JS, Padmanabhan V, Fink GD. Hypertension caused by prenatal testosterone excess in female sheep. Am J Physiol Endocrinol Metab 2007; 292:E1837-41; PMID:17327368; http://dx.doi.org/ 10.1152/ajpendo.00668.2006 [DOI] [PubMed] [Google Scholar]
- [93].Myatt L, Maloyan A. Obesity and Placental Function. Semin Reprod Med 2016; 34(1):42-9; PMID:26734917 [DOI] [PubMed] [Google Scholar]
- [94].Nath S, Dancourt J, Shteyn V, Puente G, Fong WM, Nag S, Bewersdorf J, Yamamoto A, Antonny B, Melia TJ. Lipidation of the LC3/GABARAP family of autophagy proteins relies on a membrane-curvature-sensing domain in Atg3. Nat Cell Biol 2014; 16:415-24; PMID:24747438; http://dx.doi.org/ 10.1038/ncb2940 [DOI] [PMC free article] [PubMed] [Google Scholar]
- [95].Nakatogawa H, Oh-oka K, Ohsumi Y. Lipidation of Atg8: how is substrate specificity determined without a canonical E3 enzyme? Autophagy 2008; 4:911-3; PMID:18690009; http://dx.doi.org/ 10.4161/auto.6646 [DOI] [PubMed] [Google Scholar]
- [96].Rossiter H, Konig U, Barresi C, Buchberger M, Ghannadan M, Zhang CF, Mlitz V, Gmeiner R, Sukseree S, Födinger D, et al.. Epidermal keratinocytes form a functional skin barrier in the absence of Atg7 dependent autophagy. J Dermatol Sci 2013; 71:67-75; PMID:23669018; http://dx.doi.org/ 10.1016/j.jdermsci.2013.04.015 [DOI] [PubMed] [Google Scholar]
- [97].Pascual M, Pascual DA, Soria F, Vicente T, Hernández AM, Tébar FJ, Valdés M. Effects of isolated obesity on systolic and diastolic left ventricular function. Heart 2003; 89:1152-6; PMID:12975404; http://dx.doi.org/ 10.1136/heart.89.10.1152 [DOI] [PMC free article] [PubMed] [Google Scholar]
- [98].Scaglione R, Dichiara MA, Indovina A, Lipari R, Ganguzza A, Parrinello G, Capuana G, Merlino G, Licata G. Left ventricular diastolic and systolic function in normotensive obese subjects: influence of degree and duration of obesity. Eur Heart J 1992; 13:738-42; PMID:1623860 [DOI] [PubMed] [Google Scholar]
- [99].Abed HS, Samuel CS, Lau DH, Kelly DJ, Royce SG, Alasady M, Mahajan R, Kuklik P, Zhang Y, Brooks AG, et al.. Obesity results in progressive atrial structural and electrical remodeling: implications for atrial fibrillation. Heart Rhythm 2013; 10:90-100; PMID:23063864; http://dx.doi.org/ 10.1016/j.hrthm.2012.08.043 [DOI] [PubMed] [Google Scholar]
- [100].Albert CM, Chae CU, Grodstein F, Rose LM, Rexrode KM, Ruskin JN, Stampfer MJ, Manson JE. Prospective study of sudden cardiac death among women in the United States. Circulation 2003; 107:2096-101; PMID:12695299; http://dx.doi.org/ 10.1161/01.CIR.0000065223.21530.11 [DOI] [PubMed] [Google Scholar]
- [101].Maloyan A, Mele J, Muralimanohara B, Myatt L. Measurement of mitochondrial respiration in trophoblast culture. Placenta 2012; 33:456-8; PMID:22336334; http://dx.doi.org/ 10.1016/j.placenta.2012.01.016 [DOI] [PMC free article] [PubMed] [Google Scholar]
- [102].Muralimanoharan S, Maloyan A, Mele J, Guo C, Myatt LG, Myatt L. MIR-210 modulates mitochondrial respiration in placenta with preeclampsia. Placenta 2012; 33:816-23; PMID:22840297; http://dx.doi.org/ 10.1016/j.placenta.2012.07.002 [DOI] [PMC free article] [PubMed] [Google Scholar]
- [103].Komatsu M, Waguri S, Ueno T, Iwata J, Murata S, Tanida I, Ezaki J, Mizushima N, Ohsumi Y, Uchiyama Y, et al.. Impairment of starvation-induced and constitutive autophagy in Atg7-deficient mice. J Cell Biol 2005; 169:425-34; PMID:15866887; http://dx.doi.org/ 10.1083/jcb.200412022 [DOI] [PMC free article] [PubMed] [Google Scholar]
- [104].Wenzel PL, Leone G. Expression of Cre recombinase in early diploid trophoblast cells of the mouse placenta. Genesis 2007; 45:129-34; PMID:17299749; http://dx.doi.org/ 10.1002/dvg.20276 [DOI] [PubMed] [Google Scholar]
- [105].Kamat A, Mendelson CR. Identification of the regulatory regions of the human aromatase P450 (CYP19) gene involved in placenta-specific expression. J Steroid Biochem Mol Biol 2001; 79:173-80; PMID:11850222; http://dx.doi.org/ 10.1016/S0960-0760(01)00156-X [DOI] [PubMed] [Google Scholar]
- [106].Kamat A, Graves KH, Smith ME, Richardson JA, Mendelson CR. A 500-bp region, approximately 40 kb upstream of the human CYP19 (aromatase) gene, mediates placenta-specific expression in transgenic mice. Proc Natl Acad Sci U S A 1999; 96:4575-80; PMID:10200304; http://dx.doi.org/ 10.1073/pnas.96.8.4575 [DOI] [PMC free article] [PubMed] [Google Scholar]
- [107].Berglund ED, Li CY, Poffenberger G, Ayala JE, Fueger PT, Willis SE, Jewell MM, Powers AC, Wasserman DH. Glucose metabolism in vivo in four commonly used inbred mouse strains. Diabetes 2008; 57:1790-9; PMID:18398139; http://dx.doi.org/ 10.2337/db07-1615 [DOI] [PMC free article] [PubMed] [Google Scholar]
- [108].Matthews DR, Hosker JP, Rudenski AS, Naylor BA, Treacher DF, Turner RC. Homeostasis model assessment: insulin resistance and β-cell function from fasting plasma glucose and insulin concentrations in man. Diabetologia 1985; 28:412-9; PMID:3899825; http://dx.doi.org/ 10.1007/BF00280883 [DOI] [PubMed] [Google Scholar]
- [109].Teekakirikul P, Eminaga S, Toka O, Alcalai R, Wang L, Wakimoto H, Nayor M, Konno T, Gorham JM, Wolf CM, et al.. Cardiac fibrosis in mice with hypertrophic cardiomyopathy is mediated by non-myocyte proliferation and requires Tgf-β. J Clin Invest 2010; 120:3520-9; PMID:20811150; http://dx.doi.org/ 10.1172/JCI42028 [DOI] [PMC free article] [PubMed] [Google Scholar]
Associated Data
This section collects any data citations, data availability statements, or supplementary materials included in this article.