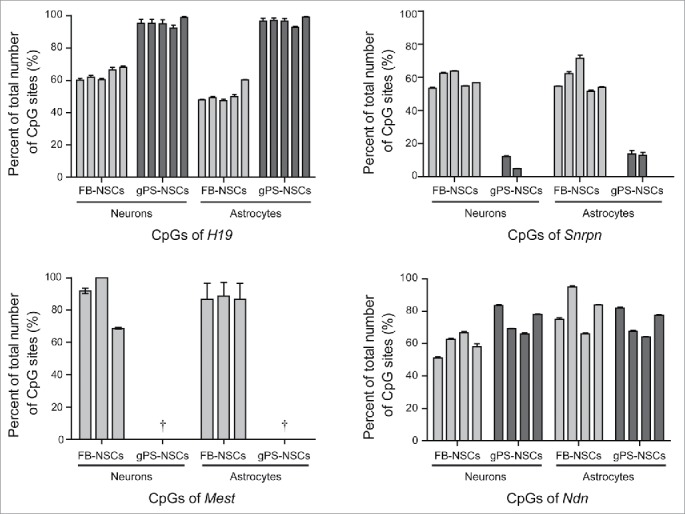
Figure 3.

Pyrosequencing analysis of H19, Snrpn, Mest and Ndn in neurons and astrocytes differentiated from gPS-NSCs and FB-NSCs. Cytosine methylation percentages in the target regions are shown. Means ± s.e.m. are shown for three independent experiments († = the numbers were not detectable because of 0%).
