Summary
The integrated stress response (ISR) is a homeostatic mechanism by which eukaryotic cells sense and respond to stress-inducing signals, such as amino acid starvation. General controlled nonrepressed (GCN2) kinase is a key orchestrator of the ISR, and modulates cellular metabolism in response to amino acid starvation. Here we demonstrate that GCN2 controls intestinal inflammation by suppressing inflammasome activation. Enhanced activation of ISR was observed in intestinal antigen presenting cells (APCs) and epithelial cells during amino acid starvation, or intestinal inflammation. Genetic deletion of GCN2 in CD11c+ APCs or intestinal epithelial cells resulted in enhanced intestinal inflammation and Th17 responses, due to enhanced inflammasome activation and IL-1β production. This was caused by reduced autophagy in GCN2−/− intestinal APCs and epithelial cells, leading to increased reactive oxygen species (ROS), a potent activator of inflammasomes1. Thus, conditional ablation of Atg5 and Atg7 in intestinal APCs resulted in enhanced ROS and Th17 responses. Furthermore, in vivo blockade of ROS and IL-1β resulted in inhibition of Th17 responses and reduced inflammation in GCN2−/− mice. Importantly, acute amino acid starvation suppressed intestinal inflammation via a mechanism dependent on GCN2. These results reveal a mechanism that couples amino acid sensing with control of intestinal inflammation via GCN2.
The immune system can sense pathogens through pathogen recognition receptors2, but emerging evidence suggests that it can also sense and respond to environmental changes that cause cellular stress3. The ISR is an evolutionarily ancient mechanism that enables eukarytoic cells to sense and respond to diverse stress signals, such as amino acid starvation and endoplasmic reticulum (ER) stress4. The four known sensors of the ISR include: GCN2, Protein Kinase R (PKR), Heme-Regulated Inhibitor (HRI) and PKR-like Endoplasmic Reticulum Kinase (PERK)4. GCN2 senses amino acid depletion, PERK senses endoplasmic reticulum (ER) stress, and PKR can recognize viral double-stranded RNA4. Activation of HRI is induced by heme deficiency5, and is important for the survival of erythroid precursors. Activation of these four sensors results in phosphorylation of eukaryotic initiation factor 2 (eIF2α) leading to initiate global translational arrest4. Recent evidence suggests a crosstalk between the ISR and the immune system3. Thus, our recent systems based analysis of immune responses to the yellow fever vaccine (YF-17D) in humans revealed a correlation between the expression of GCN2 in the blood and the magnitude of the later CD8+ T cell response6. Furthermore YF-17D induced GCN2 activation in dendritic cells (DCs), resulting in enhanced autophagy and antigen presentation7. Whether GCN2 can modulate immune responses during conditions of amino acid restriction remains unexplored. This is particularly relevant in the intestine, where the immune system has to endure dynamic changes in nutrient bioavailability. We thus determined whether GCN2 impacts immune-homeostasis in the intestine.
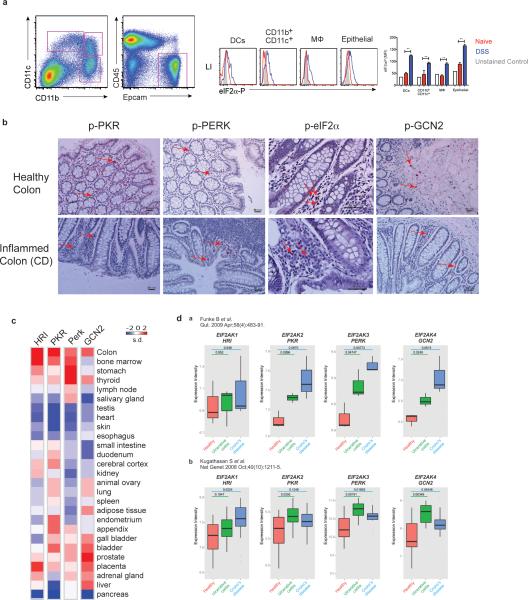
Phosphorylated eIF2α was detected in intestinal DCs, macrophages and epithelial cells under steady state and inflammatory conditions (Extended Data. Fig.1a). Furthermore, expression of phosphorylated PKR, PERK, eIF2α and GCN2 could be detected in tissues from healthy and inflamed human colon (Extended Data. Fig.1b). Analysis of public gene expression databases revealed that the expression of genes encoding GCN2 and other eIF2α kinases was highest in the colon, relative to other organs (Extended Data. Fig.1c). Interestingly, there was a higher expression of genes encoding GCN2, PERK and PKR in ulcerative colitis (UC) and crohn's disease (CD), relative to healthy controls8,9 (Extended Data. Fig. 1d).
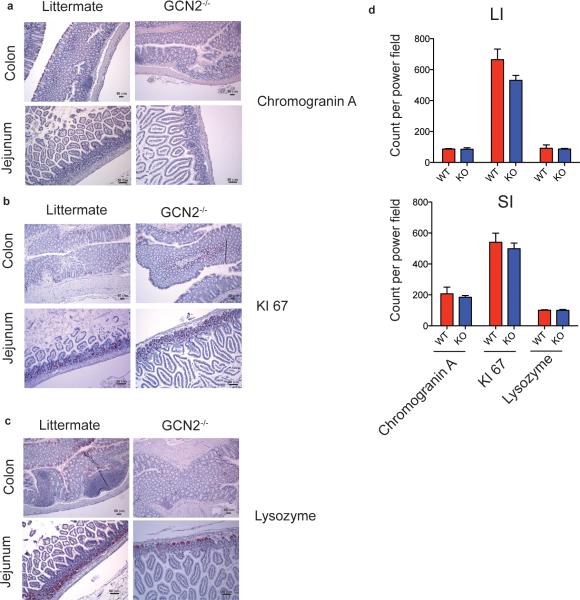
To investigate the functions of GCN2 in vivo we analyzed the structure and morphology of gut tissue isolated from the GCN2−/− mice. Ki-67 and Chromogranin A staining in small and large intestines were unaffected in GCN2−/− mice suggesting that GCN2 is not required for steady-state cell differentiation and proliferation in the intestine (Extended Data Fig. 2a, b and d). GCN2−/− mice had normal paneth cell granules as evident in the lysozyme staining (Extended Data Fig. 2c), and did not exhibit any spontaneous gut inflammation up to 45 wks of age.
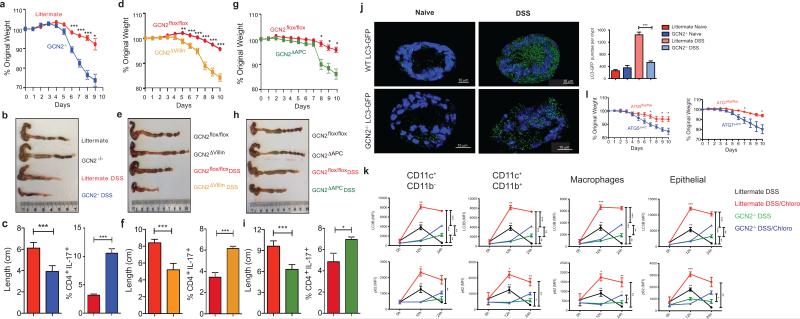
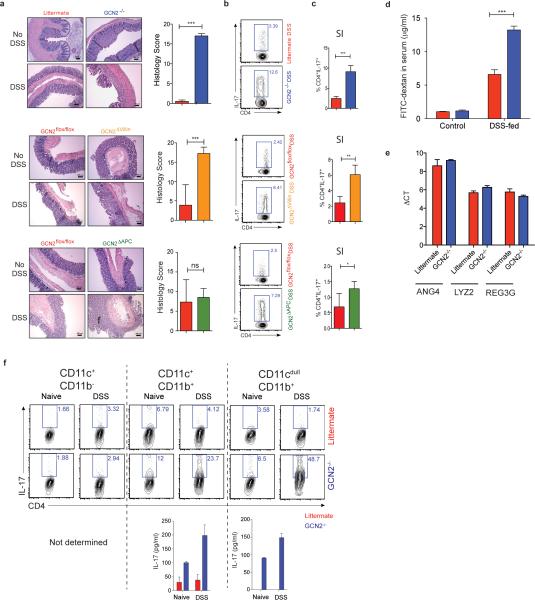
We then assessed the impact of GCN2 deficiency on acute colitis by challenging the mice with 2% Dextran Sodium Sulfate (DSS), a chemical irritant which induces inflammation with clinical and histological features of Inflammatory Bowel Diseases (IBD) in mice10. Upon DSS administration GCN2−/− mice exhibited enhanced severity of colitis compared to littermates, including greater weight loss, inflammation, Th17 responses and colon shortening (Fig. 1a-c & Extended Data Fig. 3a, b and c). Histopathological analysis revealed severe mucosal epithelial erosion, displacement and crypt loss (Extended Data Fig. 3a). Consistent with enhanced gut inflammation, we observed a severely impaired epithelial barrier, evidenced by increased intestinal permeability (Extended Data Fig. 3d). These differences were not due to differences in the expression of antimicrobial defensins between wild type and GCN2−/− mice (Extended Data Fig. 3e).
Figure 1. GCN2 activation in APCs and epithelial cells suppresses intestinal inflammation by a mechanism dependent on autophagy.
GCN2 deficiency leads to loss of body weight, colon shortening and enhanced production of IL-17 by colonic CD4+ T cells (a-c). Expression of GCN2 in epithelial cells (GCN2Δvillin) (d-f) or APCs (GCN2ΔAPC) (g-i) protects mice from DSS induced colitis. (j). LC3-GFP expression and the GFP punctae counts in the crypts (3D) from GCN2−/− LC3-GFP and LC3-GFP mice before and 12 hrs after DSS (k) Mean fluorescence Intensity (MFI) comparison of LC3B and p62 expression with and without chloroquine on APC subsets and epithelial cells by flow cytometry before and following 3% DSS administration. (l) Comparison of body weights of Atg5ΔAPC and Atg7ΔAPC mice to littermate controls subjected to acute 2% DSS-induced colitis. Data are representative of three separate experiments (n=5). *P < 0.05; **P < 0.005, ***P < 0.0005. Error bars indicate mean ±SEM., two-tailed unpaired student's t-test.
To assess potential roles for APCs versus epithelial cells in mediating the effects of GCN2, we generated mice lacking GCN2 specifically in epithelial cells (GCN2flox/flox villin cre+, GCN2ΔVillin hereon) (Fig. 1 d-f, Extended Data Fig. 3a, b and c), or in CD11c+ APCs (GCN2flox/flox CD11c cre+, GCN2ΔAPC hereon) (Fig. 1g-i; Extended data Fig 3a, b and c). DSS induced enhanced colitis in both strains, evidenced by weight loss, colon shortening and increased Th17 responses, (a surrogate readout of intestinal inflammation), relative to littermate controls (Fig. 1; Extended Data Fig. 3b and c). Consistent with a role for GCN2 in APCs, isolated intestinal DCs from GCN2−/− mice could stimulate enhanced IL-17 production from antigen specific CD4+ T cells, in vitro (Extended Fig. 3f). Collectively, these findings demonstrate that GCN2 deficiency in both epithelial cells and APCs results in enhanced inflammation and DSS-induced colitis.
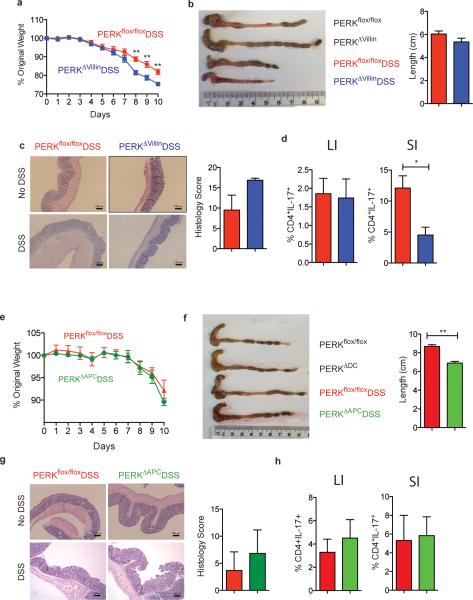
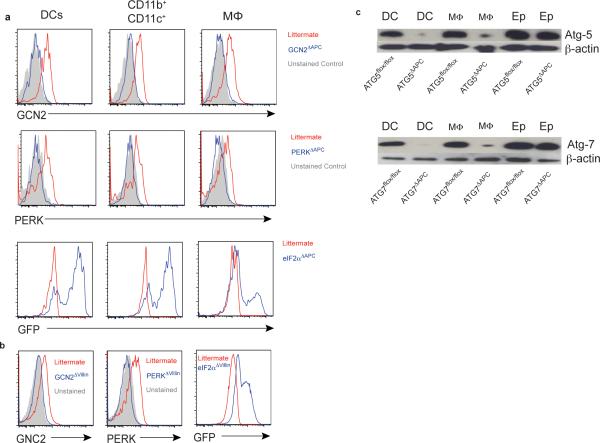
Since PERK activation by ER stress is also known to be an important component of the host ISR11, we generated mice lacking PERK in epithelial cells (PERKflox/flox villin cre+, PERKΔVillin hereon) or APCs (PERKflox/flox CD11cre+, PERKΔAPC hereon) to study the role of PERK in intestinal inflammation (Extended Data Fig. 4). PERK deficient strains were challenged with 2% DSS, and their symptoms and pathology were compared to littermate controls. Both PERKΔVillin and PERKΔAPC strains exhibited little or no differences relative to littermates, in intestinal inflammation induced by DSS (Extended Data Fig. 4).
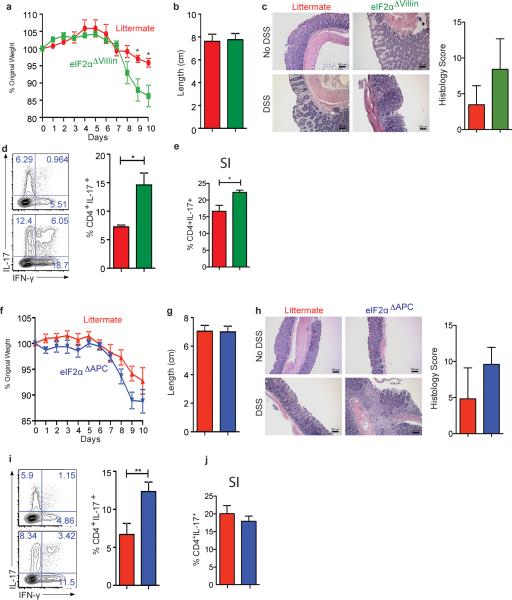
Since ISR kinases exert their function by phosphorylating Ser-51 on eIF2α, we assessed the impact of eIF2α on intestinal inflammation. We generated mice conditionally lacking Ser51 eIF2α phosphorylation in epithelial cells (eIF2αflox/flox villin cre+, eIF2αΔVillin, hereon) as previously described12,13 and APCs (eIF2αflox/flox CD11cre+, eIF2αΔAPC hereon) (Extended Data Fig. 5). eIF2αΔVillin mice exhibited enhanced weight loss and elevated Th17 response relative to littermate controls and eIF2αΔAPC mice exhibited enhanced Th17 responses (Extended Data Fig. 5), consistent with a recent report on a role for eIF2α in mediating protection against gut inflammation13. However these effects were more modest than those observed in GCN2−/− mice (Fig. 1), suggesting additional eIF2α independent mechanisms.
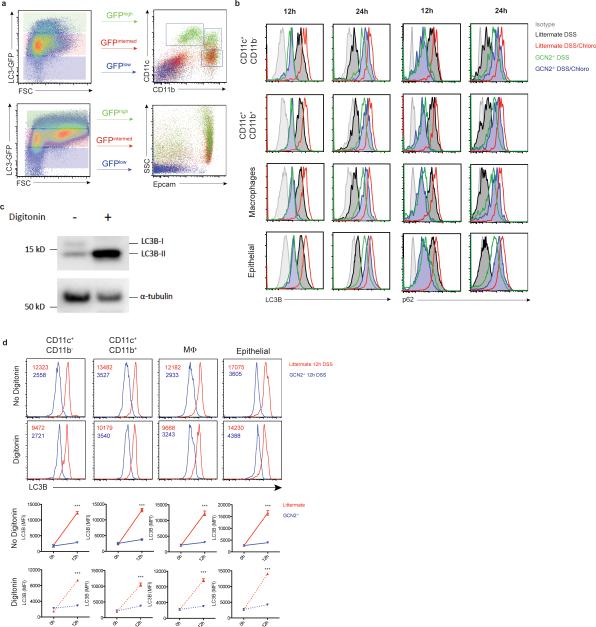
Recent studies indicate a role for GCN2 in promoting autophagy7,14. Given its importance in regulating inflammation at mucosal sites15, we hypothesized that defective autophagy may mediate enhanced gut inflammation in GCN2−/− mice. We analyzed expression of the autophagy protein LC3 using a knock-in reporter strain16, and observed high LC3 expression in colonic antigen presenting cells (APCs) and epithelial cells, which was indicative of constitutive autophagy (Extended Data Fig. 6a). To study the role of GCN2 in mediating autophagy at mucosal sites we generated GCN2-deficient autophagic reporter mice (GCN2−/− × LC3-GFP), and additionally examined expression of p62, another marker for autophagy. In naive mice, expression of both LC3 and p62 were similar in intestinal APCs and epithelial cells of GCN2−/− and littermates (Fig. 1j and k). However, we observed a significant increase in the number of LC3-GFP punctae in the crypts of wild type mice compared to the GCN2−/− mice following oral administration of DSS (Fig. 1j). Additionally, we observed that intestinal APCs and epithelial cells from GCN2−/− mice have lower levels of LC3B and p62 relative to cells from wild type mice (Fig. 1k; Extended Data Fig. 6b). To determine if the observed reduction in autophagy in GCN2−/− was due to impaired induction or enhanced degradation of autophagosomes, we assessed LC3B and p62 levels in intestinal APCs and epithelial cells from wild type or GCN2−/− with or without chloroquine, an inhibitor of autophagy degradation (Fig. 1k; Extended Data Fig. 6b). Blocking the degradation of autophagosomes with chloroquine in wild type mice resulted in greater accumulation of LC3B and p62 at 12hrs after DSS (Fig. 1k; Extended Data Fig. 6b). Importantly, the accumulated form (LC3B and p62) was significantly lower in GCN2−/− cells indicating reduced autophagy flux relative to wild type mice (Fig. 1k; Extended Data Fig. 6b). Similar results were observed at 24hrs, although chloroquine treated GCN2−/− mice displayed enhanced accumulation of LC3B and p62, albeit at lower levels than wild type mice (Fig. 1k; Extended Data Fig. 6b). The specificity of the LC3B antibody to LC3BII was confirmed using digitonin to specifically retain the membrane bound LC3II within cells 17 (Extended Data Fig. 6 c and d).
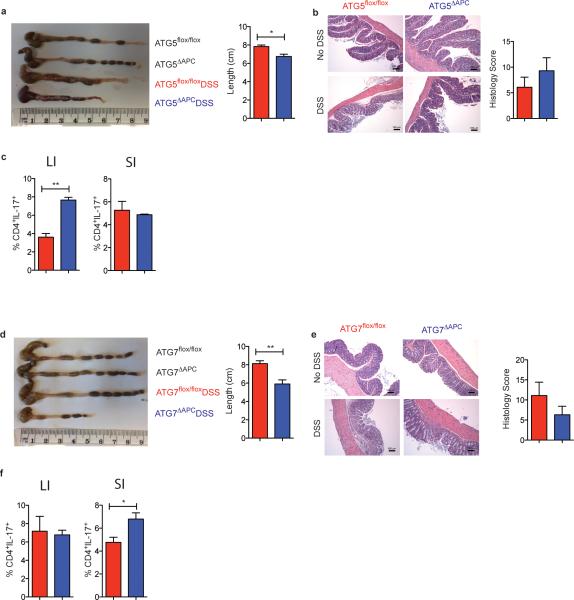
These findings suggested that defective autophagy in intestinal cells may mediate enhanced inflammation in GCN2−/− mice. We therefore generated Atg5lox/lox CD11c cre (Atg5ΔAPC) and Atg7lox/lox CD11c cre (Atg7ΔAPC) mice that are conditionally deficient in autophagy proteins Atg5 and Atg7 in CD11c+ APCs (Extended Data Fig. 7). Upon treatment with 2% DSS both Atg5ΔAPC and the Atg7ΔAPC strains exhibited greater weight loss (Fig. 1l), enhanced shortening of colon length, Th17 responses and immunopathology (Extended Data Fig. 7) compared to the littermate controls, indicating a role for APC-intrinsic autophagy in regulating inflammation in GCN2−/− mice.
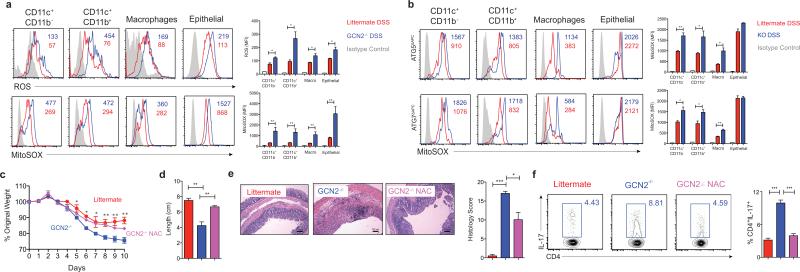
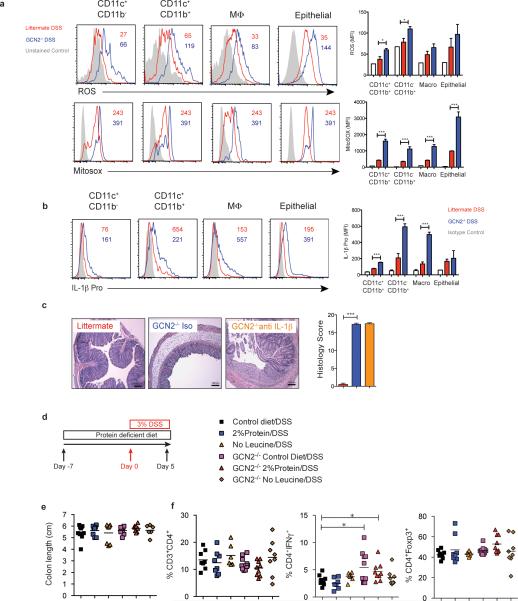
Autophagy can limit reactive oxygen species (ROS) abundance during colitis15, and impaired autophagy results in abnormal mitochondrial function and oxidative stress15, which is a characteristic feature of IBD18. Hence we studied the role of ROS in mediating DSS-induced inflammation, using cell-permeant 2′, 7′-dichlorodihydrofluorescein diacetate (H2DCF-DA) a fluorescent probe that reacts with numerous types of ROS19. Following oxidation by ROS, the nonfluorescent H2DCFDA is converted to fluorescent 2', 7’-dichlorofluorescein (DCF)19, which was detected in intestinal APCs and epithelial cells (Fig. 2a and Extended Fig. 8a and b) by flow cytometry. GCN2−/− mice exhibited significantly higher levels of ROS compared to littermate controls, indicating enhanced oxidative stress in the colon (Fig. 2a) and small intestine (Extended Fig. 8a and b). We also analyzed the levels of mitochondrial ROS in the large and small intestine using Mitosox, a flurogenic dye that specifically detects mitochondrial superoxide20. GCN2−/− mucosal cells produced excess mitochondrial ROS in comparison to the littermate controls in the colon (Fig. 2a) and small intestine (Extended Fig. 8a and b). To determine if autophagy regulated mitochondrial ROS we analyzed superoxide levels in colonic cells isolated from Atg5ΔAPC and the Atg7ΔAPC mice after DSS treatment. As in the GCN2−/− strain, there was higher production of mitochondrial ROS in Atg5ΔAPC and the Atg7ΔAPC mice compared to littermate controls (Fig. 2b). Furthermore, blockade of ROS via administration of the antioxidant N-acetyl-L-cysteine (NAC) in vivo led to reduced disease severity, and reduction of Th17 responses in GCN2−/− mice (Fig. 2c-f). Thus, these data demonstrate a key role for ROS in mediating the enhanced inflammation observed in GCN2−/−.
Figure 2. GCN2 suppresses ROS activity and intestinal inflammation.
(a) Histograms and MFI quantification of ROS and mitochondrial ROS in colonic APC subsets and epithelial cells isolated from wild type and GCN2−/− mice after 5 days of DSS. (b) Atg5ΔAPC and the Atg7ΔAPC compared to littermate before and after 5 days of DSS. NAC protects the GCN2−/− mice from weight loss (c), colon length (d), decreased pathology (e) and reduced colonic Th17 frequencies (f), induced by DSS. Data are representative of three experiments (n=5). *P < 0.05; **P < 0.005, ***P < 0.0005. Error bars indicate mean ±SEM.
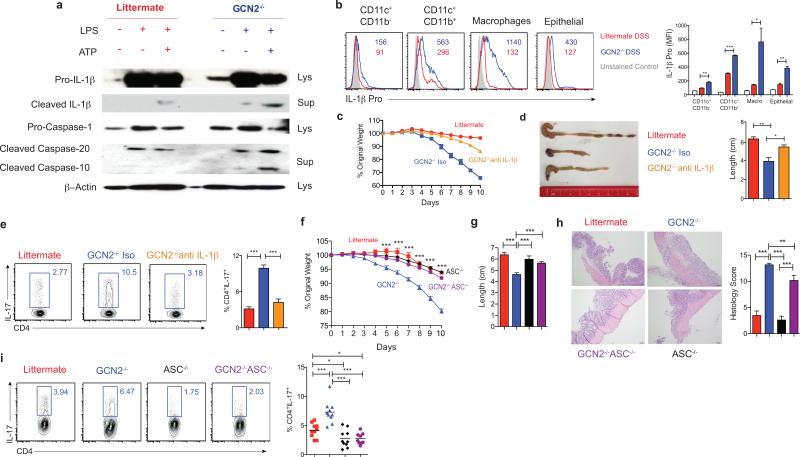
Oxidative mitochondrial stress is known to be involved in the activation of the inflammasome pathway1,15. We therefore hypothesized that excess ROS enhanced inflammasome activation in the GCN2−/− cells under inflammatory conditions. GCN2−/− DCs produced excess amounts of cleaved IL-1β and cleaved caspases when subjected to amino acid starvation (Fig. 3a). Additionally, there was higher production of pro-IL-1β in the colonic macrophages and DCs isolated from the DSS-treated GCN2−/− mice in the large (Fig. 3b) and small intestine (Extended Fig 8b). In vivo blockade of IL-1β with a neutralizing antibody in GCN2−/− mice ameliorated the deleterious effects of DSS (Fig. 3c and d, Extended Fig 8c), and significantly reduced intestinal Th17 response (Fig. 3e). However, there were no detectable effects on histopathology, possibly due to incomplete neutralization of IL-1β (Extended Fig. 8c). Additionally, we observed that increased inflammation and Th17 responses in the GCN2−/− mice were negated by the deletion of inflammasome adaptor protein apoptosis-associated speck-like protein containing a CARD (ASC) (Fig. 3f-i), demonstrating a clear role for inflammasome activation in mediating the enhanced inflammation in GCN2−/− mice.
Figure 3. Enhanced intestinal inflammation in GCN2−/− mice is dependent on inflammasome activation.
(a) Western blot analysis of pro-IL-1β, pro-caspase, cleaved IL-1β (p17) and cleaved caspase (p20) in lysate and culture supernatants of BMDC cultures of wildtype and GCN2−/− treated with LPS alone or LPS + Adenosine tri phosphate (ATP) (Potassium efflux agent that triggers inflammasomes) under amino acid starvation condition. (b) Quantification of MFIs of pro-IL-1β in colonic APC subsets in GCN2−/− and littermates following DSS. (c-e) Body weight (c), colon length, and colonic Th17 responses (e) in DSS treated GCN2−/− mice treated with anti-IL-1β antibody or isotype control. (f-i) Comparison of body weight (f), colon length (g), histology (h) and Th17 frequencies between littermates, GCN2−/−, ASC−/− and GCN2−/− ASC−/− mice subjected to DSS induced colitis. Data are from one experiment representative of three separate experiments n=(4-5). *P < 0.05; **P < 0.005, ***P < 0.0005. Error bars indicate mean ±SEM.
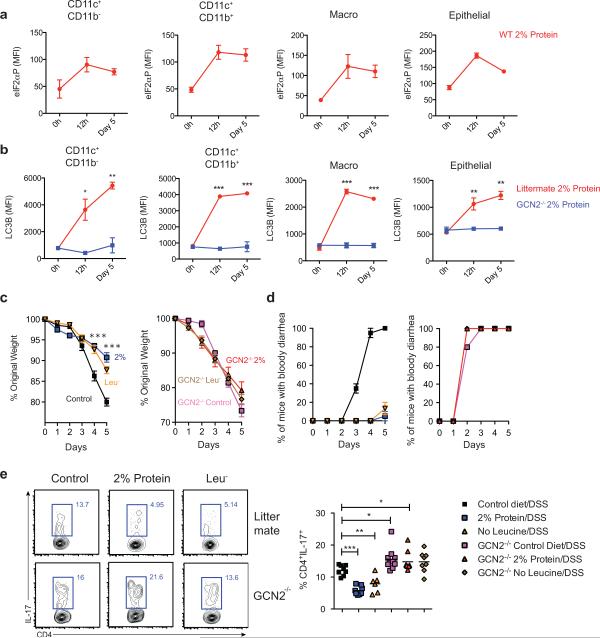
Given the importance of GCN2 in sensing amino acid starvation, we hypothesized that mice fed an amino acid deprived diet might display enhanced activation of ISR in intestinal cells, resulting in dampened inflammation. Therefore we fed mice a reduced amino acid diet (2% protein/weight versus 16% in control mice) and observed rapid activation of p-eIF2α on intestinal APCs and epithelial cells (Fig. 4a). Intestinal cells isolated from wild type mice that were on low protein diet rapidly up regulated autophagy in comparison to those from a GCN2−/− deficient mice (Fig. 4b). Consistent with this, mass spectrometric analysis of free cytosolic amino acids revealed reduced levels of specific amino acids in colonic epithelial cells and APCs isolated from mice on 2% low protein diet, relative to the corresponding cell types from control mice, as well as in mice on DSS (data not shown).
Figure 4. Dietary restriction of amino acids can partially protect against DSS induced colitis.
(a) Expression of p-eIF2α on APC subsets and epithelial cells from wild type mice on 2% protein diet (b) Kinetics of LC3B-GFP expression after 2% protein diet in colonic APC subsets and epithelial cells isolated from GCN2−/− LC3-GFP and LC3-GFP mice. (C) Mice on modified protein diet are protected from DSS induced colitis. (c) Weight loss (d) percent of animals having bloody diarrhea and (e) colonic Th17 responses, in 3% DSS induced wild type or GCN2−/− mice that were on protein modified diets (2% protein diet or leucine deficient diet) compared to control diet (16%). Data are from of two separate experiments that were then pooled. *P < 0.05; **P < 0.005, ***P < 0.0005. Error bars indicate mean ±SEM.
Interestingly, diets lacking in selective amino acids can also preferentially activate the GCN2 pathway21-23. We next asked whether lowering of proteins (2% protein) or selective depletion of individual essential amino acid like leucine (Leu−) impacted intestinal inflammation (Fig. 4). Thus wild type or GCN2−/− mice were fed amino acid restricted or control diets (16% protein) and subsequently challenged with 3% DSS in their drinking water (Fig. 4c-e). 3% DSS was administered in order to induce enhanced inflammation in wild type mice, so as to be able to reveal the putative protective effects of amino acid starvation on inflammation. Mice on protein restricted diets and normal diets had similar weights prior to DSS (Data not shown). Following DSS, wild type mice on protein-restricted diets weighed significantly less than those on control diet (Fig. 4c), but this was not the case in GCN2−/− mice, indicating that GCN2 protected against gut inflammation (Fig. 4c). The colon lengths and histopathology (epithelial integrity, cellular infiltration, crypt loss) were similar (Extended data Fig. 8e & data not shown). In contrast, mice on protein-modified diets showed a reduced incidence of “bloody diarrhea,” compared to control diet mice (Fig. 4d). Remarkably, the frequencies of colonic Th17 cells were significantly lower in wild type mice on modified diet compared to mice on control diets (Fig. 4e). In contrast, there were no significant differences in the Th1 responses or regulatory T cells indicating that amino acid restricted diets selectively impair Th17 responses (Extended Fig. 8f). Notably, there were no differences in the Th17 frequencies among GCN2−/− mice on various diets indicating that this effect is GCN2 dependent (Fig. 4 e). Together these data demonstrate that amino acid starvation protects the symptoms of colitis and limits Th17 cells, via a GCN2-dependent mechanism.
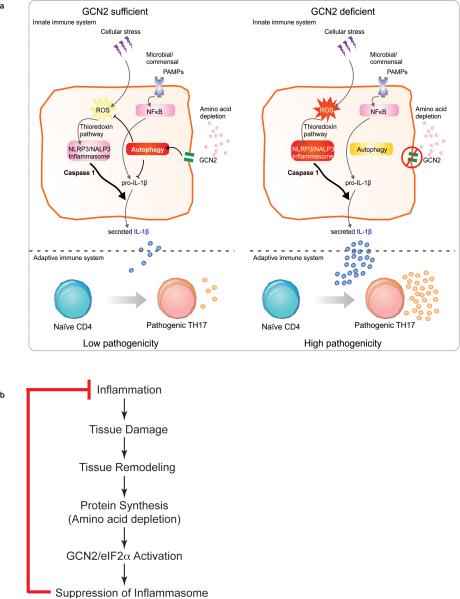
In this study we demonstrate that GCN2 suppresses intestinal inflammation and Th17 responses via a mechanism dependent on autophagy and sequestration of ROS, which is a trigger for inflammasome (Extended Fig. 9a). GCN2−/− mice displayed enhanced ROS and inflammasome activation, leading to increased inflammation and Th17 responses (Figs. 1 - 3). Thus blockade of ROS and IL-1β led to lower inflammation and Th17 responses in GCN2−/− mice (Figs. 2 & 3). In addition, GCN2−/− mice were deficient in autophagy, which sequesters ROS, and consistent with this there was enhanced ROS and Th17 inflammation in Atg5ΔAPC and Atg7ΔAPC mice (Fig 1 & Extended Fig. 7). Future studies aimed at the functional reconstitution of a constitutively active autophagy pathway specifically in intestinal APCs and epithelial cells in GCN2−/− mice should provide greater insight into the extent to which the observed phenotype in GCN2−/− mice are due to impaired autophagy. Consistent with these results it is known that halofuginone, a compound that activates the amino acid starvation response (AAR), selectively inhibits mouse and human Th17 differentiation24. Remarkably, we observed that low protein diet that activates the AAR pathway reduces the symptoms of colitis and colonic Th17 responses. Although prolonged protein deficiency impairs critical immune functions25, short term protein restriction can enhance immunity to pathogens26-28 and cancer29. Also, pharmacological activation of GCN2 protected mice against ischemia reperfusion injury30.
It is tempting to speculate on the evolutionary significance of coupling amino acid starvation with control of inflammation. Tissue injury and cell death, which occur during inflammation, inevitably, result in tissue regeneration. Tissue regeneration, in turn, is accompanied by protein synthesis, which could lead to amino acid depletion in the cytosol. The consequent activation of GCN2 will suppress inflammasome activation through the mechanisms described herein, in effect representing a negative feedback mechanism that limits the inflammation (Extended Fig. 9b). In summary, our results show a role for GCN2 in protecting mice against intestinal inflammation. Thus targeting the GCN2 pathway may provide new strategies for the pharmacological intervention for the amelioration of IBD other inflammatory disorders.
Materials and Methods
Mice
GCN2−/− mice31 were provided by Dr. David Ron. The GCN2 floxed and PERK floxed mice32 were obtained from Jackson Laboratories, and bred on-site. To specifically delete GCN2 or PERK in APCs, floxed GCN2 mice (GCN2fl/fl) were crossed with CD11c-cre or villin-cre mice that express the cre enzyme under the control of CD11c promoter33 or villin-promotor34, respectively, generating GCN2ΔAPC, GCN2Δvillin, PERKΔAPC and PERKΔvillin mice. eIF2α-Ser51Ala Tg (eIF2α floxed) mice were provided by Dr. Randal J Kaufman35, and crossed to CD11c cre and villin cre mice to obtain the conditional expression of nonphosphorylatable Ser51Ala mutant eIF2α in APCs or IECs. Successful cre-mediated deletion was confirmed by PCR and protein expression (FACS or Western blot) (Extended data Fig 10). LC3-GFP mice were generated by Dr. Noboru Mizushima, Tokyo Medical and Dental University, Japan36 and provided by Dr. Herbert Virgin, University of Washington, in St. Louis MO. These mice were crossed with GCN2−/− mice to generate GCN2−/− LC3-GFP mice.
Animal studies were conducted using age matched littermate controls for each experiment. Both male and female mice were used and were between 8-14 weeks of age at the time of experiments. Mice were maintained under specific pathogen-free conditions in the Emory Vaccine Center vivarium. All animal protocols were reviewed and approved by the Institute Animal Care and Use Committee of Emory University.
Histology
Formalin-fixed and paraffin-embedded murine intestinal tissue was sectioned (4 microns) and standard haematoxylin and eosin (H&E) stains were carried out to assess DSS-induced damage. Paraffin-embedded sections were subjected to deparaffinization in xylene, rehydration in graded series of ethanol, and rinsing with distilled water. The resident pathologist at Yerkes performed all histopathology analyses in a blinded manner.
Immunohistochemistry was performed by using labeled anti-mouse/anti-Rabbit/anti-goat biotin, antibody followed by streptavidin–alkaline phosphatase using a multistep staining protocol. All reactions were detected by development of the chromogen (Warp Red, Biocare Medical). Appropriate positive and negative controls were run in parallel. Post rehydration, slides were treated with a target retrieval solution (DIVA decloaker, Biocare Medical) and then steamed for antigen retrieval for 20 minutes and cooled for 20 minutes. The following primary antibodies were used for Immunohistochemical staining: Ki67 (#12202, Cell Signaling Technology, 1:200), Lysozyme (Sc-27956, Santa Cruz, 1:50), Chromagranin A (ab15160, Abcam, 1:200). Nuclei were counter stained using Gill's hematoxylin. Human sections from naive or inflamed colons (Pantomics, Cat No-COLO1& COLO2) were stained in a similar fashion with following primary antibodies: PERK (#T980, Cellsignaling Technology, 1:200), Phospho-GCN2 (ab32026,Abcam, 1:200),PKR(ab32036,Abcam,1:200), anti-IL-1β (ab9722, Abcam, 1:200).
Isolation of intestinal APCs and lymphocytes
For epithelial and lamina propria (LP) lymphocyte isolation, mice were euthanized and the intestine was washed, cleaned of fat tissue and Peyer's patches, and longitudinally cut and suspended in 1× HBSS with 20 mM HEPES, 1 mM DTT and 5 mM EDTA for 30 min at 37°C. After washing with 1X HBSS, pieces were digested with collagenase VIII (Sigma) (1 U ml−1 in RPMI with 2% FCS) for 30 min at 37 °C with shaking (150 r.p.m.). Tissue was processed through a 100-μm-cell strainer, and the resulting suspension was pelleted. For lymphocyte isolation, cells derived following collagenase were resuspended in 7 ml of 40% Percoll and layered on top of 2 ml of 70% Percoll (GE Amersham). After centrifugation for 15 min at 1,500 r.p.m without brakes, the middle layer was removed, washed in 2% FBS in RPMI and the lymphocytes were obtained. For LP DCs and macrophages, the collagenase-digested cells were filtered through a 100-μm strainer and pelleted and stained. For cell sorting, APCs in this preparation were enriched with CD11c+ and CD11b+ magnetic beads according to the manufacturer's instructions (Miltenyi Biotec) and sorted on FACS Aria at the Emory Vaccine Center flow cytometer core (BD Biosciences). For flow cytometry, cells were stained with a combination of the following fluorescence-conjugated monoclonal antibodies: phycoerythrin (PE)–Texas red conjugated anti-CD11b (Invitrogen), PE-Cy7 conjugated anti-F4/80 (eBioscience), allophycocyanin (APC) conjugated anti-CD3 (eBioscience), Pac Blue conjugated anti-CD11c (eBioscience), eFluor650NC conjugated anti-CD45 (eBioscience), PerCP-Cy5.5 conjugated anti-CD4 (eBioscience). For studying the levels of pro-IL-1β, cells were stained intracellular with antibody from affymetrix eBioscience (12-7114). Dead cells were excluded from analysis through the use of a LIVE/DEAD Fixable Aqua Dead Cell Stain kit (Invitrogen). Samples were acquired on an LSR II (BD Biosciences) and were analyzed with FlowJo software (v9.2; TreeStar).
In vivo intestinal barrier function assays
Naive or 3 day-DSS treated wild type or GCN2−/− mice were fasted overnight, and FITC-dextran (0.6 mg/g; Sigma) diluted in PBS was gavaged the following day. Fluorescence intensity of plasma samples was measured (excitation 485 nm/emission 535 nm) 4 h after gavage.
In vitro lymphocyte co-culture
FACS sorted LP APC subsets (1×10⁵) were co-cultured with naive CD4+CD62L+ OT-II CD4+ Transgenic T cells (1×10⁵) and OVA peptide (ISQVHAAHAEINEAGR; 2 μg/ml) in a total volume of 200 μl RPMI complete medium. The culture supernatants were analyzed after 72 h and cells were harvested and restimulated for 6 h with plate-bound antibodies against CD3 (10 μg/ml; 145.2C11 from Becton Dickinson) and CD28 (2 μg/ml; 37.51 from Becton Dickinson), in the presence of brefeldin A (Becton Dickinson) for intracellular cytokine detection (IL-17A and IFN-γ). For analysis of IL-17A and IFN-γ responses from freshly isolated LP, the percoll-purified lymphocytes from colon or small intestine were stimulated with PMA (100ng/ml) and ionomycin (1000ng/ml) for 4 h in the presence of GolgiPlug and then stained for intracellular IL-17A and IFN-γ for FACS analysis.
Phospho-eIF2α staining by flow cytometry
Mice were orally gavaged with 2% DSS in 200μl volume. The LP cells were isolated and immediately fixed using the BD fixation solution for 10 minutes. Fixed cells were stained for intracellular p-eIF2α using a monoclonal antibody from Cell Signaling (3398). Cells were then stained with anti –Rabbit IgG-PE (Jackson labs, Cat No-111-116-144) at a 1:400 dilution.
Gene Expression Analysis
Total RNA was extracted from gut samples using Qiagen RNeasy mini kit (cat# 74104) according to manufacture's recommended protocol with on the column DNase- RNase free treatment. Extracted RNA was reverse transcribed with SuperScript Vilo cDNA synthesis kit (cat# 11754050) according the manufacture's protocol. An aliquot (10ng) of cDNA was used to quantitate Ang4 ((Mm03647554_g1), Lyz (Mm00727183_s1) and Reg3γ (Mm00441127_m1) on the ABI7900 system. GADPH (Mm99999915_g1) was used as the reference gene. The comparative gene expression method was used to determine the relative quantitation.
ROS and mitosox staining by flow cytometry
For detecting the ROS levels, the LP preparations were incubated with CM-H2DCFDA (10 mM; C6827, Life Technologies), a cell permeable indicator for ROS. Following incubation the levels of fluorescence were measured by flow cytometry. For mitosox staining the LP preparation was incubated with mitosox (M36008, Life technologies) for 15 minutes (manufacturers instructions). Cells were then surface stained and analyzed by flow cytometry.
N-acetyl cysteine and anti-IL-1β treatment in vivo
For in vivo treatment, NAC (Sigma) was injected into mice i.p. (275mg/kg) in phosphate-buffered saline solution, pH 7.4, every other day at days 1, 3, 5 and 7 post DSS. For in vivo IL-1β neutralizing experiments, 300 μg/mouse of anti-mouse IL-1β (BioXcell, Cat No-BE0246) was injected i.p. on days 1, 3, 5 and 7 post DSS. Control mice received 300μg isotype control antibody (Hamster IgG, BioXcell BE0091) i.p.
Detection of LC3-GFP
Mice were euthanized, and intestines were fixed (3.7% formaldehyde for 3 min) and promptly washed with PBS. The tissue was fixed in formalin for an additional 12–18 h. Fixed tissue was embedded in OCT and sectioned on a cryotome into 6 μm sections. Slides were washed with PBS and mounted with Prolong Gold Antifade reagent with DAPI (Invitrogen). Images of the sections were collected using LSM510 META confocal microscopy (Carl Zeiss). The z stack images were collected and the GFP signals were analyzed through the sections. Each individual crypt was analyzed in three dimension to reveal the number of LC3-GFP positive crypts using an Imaris 7 3D/4D an image processing and analysis software (Bitplane). Multiple crypts (5-7) were chosen from 3 different animals per group and the average mean LC3-GFP counts quantified per crypt using Imaris software 7 (Bitplane).
In vivo autophagy flux
In order to study autophagy flux we used choloroquine was used as a mode of inhibiting degradation of the components of the autophagosomes. Accumulated versus steady state form of the autophagosomes in wild type and GCN2−/− mice following oral administration of DSS (200 μl of 3% DSS) was compared. Chloroquine (10mg/kg) or saline was administered i.p. 2 hrs following DSS gavage and mice were sacrificed at 12 hours and 24 hours post DSS treatment. The colons were cleaned, collagenase treated and the lamina propria preparation was quickly stained for various APC surface markers (CD11c, CD45, Epcam, MHC-II, CD11b) and intracellular levels of p62 (1:150) (H00008878-M01PE) and LC3B (1:150) (NB100-220F) to study the levels of intracellular autophagosomes. Intracellular staining was performed using BD perm buffer (BD Bioscience-554723) following fixation with the BD Cytofix/Cytoperm solution (BD Bioscience-554714). In some instances the lamina propria was treated with digitonin (200μg/ml) for 10 min before undergoing intracellular staining.
Cytokine ELISA detection
IL-17, and IL- 1β in culture supernatants were quantitated by ELISA according to product protocol (R&D Systems Cat # DY42; BD Biosciences, Cat # 559603).
Dextran sodium sulfate induced colitis
Acute colitis was induced by adding 2% DSS (MW 36,000–50,000; MP Biomedicals, Solon, OH) to drinking water ad libitum for 7 consecutive days. Following the treatment mice were kept in normal drinking water for 3 more days. Mice were sacrificed and tissues analyzed for immune and histo-analysis. In addition, mice were orally gavaged with 200 μl of 2% DSS, thus minimizing the variation within a group owing to differences in the consumption of the drinking water. In the experiment involving protein restriction diets, mice wild type (littermate) or GCN2−/− mice were fed with 3% DSS to induce colitis in the wild type mice. 3%, rather than 2% DSS was used to induce intestinal inflammation in wild type mice, in order to be able to detect any effect of a low protein diet in these mice.
Low protein mouse diet
The mice were fed with either test diet 5CC7 (1812281), baker amino acid defined diet (16% protein) or diet 5CC7 modified with 2% defined protein or no leucine (Test Diet Land O’ Lakes Purina Feed, St. Louis, MO).
Generation of murine bone marrow derived dendritic cells
Mice tibiae and femurs were flushed with ice-cold PBS through a 70μm cell strainer. Cells were pelleted and plated at a density of 5-7 × 10⁶ bone marrow cells per 10 cm petri dish in (RPMI complete) in the presence of GM-CSF (20ng/ml, peprotech) and IL-4 (5ng/ml). At day 3, the cultures were supplemented with another 10 ml of RPMI complete + GM-CSF. At day 6, BMDCs were harvested by gently flushing the cells from the plate.
In vitro activation of DCs
The BMDCs purified from wild type or GCN2−/− mouse tibia cultures were plated in 96 well microculture plates (1×10⁵ cells/well) and primed for 8h with 100ng/ml LPS (InvivoGen, LPSSM) in RPMI 1640 (US Biological; R8999-04A) plus 1% dialyzed FBS (Gibco 26400-036). Cultures were further stimulated for 1hr with ATP (5mM) (InvivoGen, tlrl-atp). Following the stimulation, cell supernatants were collected and assayed for IL-1β by ELISA or Western blot. Cell pellets were lysed and assayed for the presence of pro-IL-1β and pro-Caspase 1.
Western Blotting
Purified DCs (1×10⁶) were lysed with 100-μl protein extraction reagent (89900, Thermo Scientific) containing protease inhibitor (5872S, Cell Signaling). Equal amounts of protein (lysate) or supernatants were run on an SDS-PAGE and transferred onto nitrocellulose membranes following electro blotting. After blocking with 5% fat-free milk, the membranes were incubated at 4°C overnight with the following primary antibodies: anti mouse pro & cleaved IL-1β (Cell Signaling, 12507), pro-caspase-1 (Abcam, ab108362), Caspase-p20 & 10 (Adipogen-AG-20B-0042) as per manufacturer's instructions. The membranes were then washed was incubated with Horseradish peroxidase–conjugated secondary antibody (Cell Signaling). Proteins were visualized with SuperSignal West Pico chemiluminescent substrate (34078, Thermo Scientific).
Statistical Analysis
To assess the significance of a difference between groups, a two-sample, unpaired t test was performed using Graph Prism software. A P value less than 0.05 (*) was considered to be significant, a P value less than 0.01 (**) was considered to be very significant, and a P value less than 0.001 (***) was considered to be extremely significant.
Extended Data
Extended data Fig 1. eIF2α kinases are expressed in human and murine gut cells.
(a) Analysis of p-eIF2α expression in APCs and epithelial cells in large intestine of naïve and 2% DSS treated mice by flow cytometer. (b) Comparison of immunohistological analysis of phosphorylated PKR, PERK, eIF2α and GNC2 in healthy and inflamed human colon tissue (n=1). (c) Expression levels of HRI, PKR, PERK and GCN2 in human organs quantified based on information from a public database (www.ebi.ac.uk). (d) Expression intensity of various eIF2α kinases plotted from known published microarray data from colonic biopsies of patients with either Ulcerative colitis or Crohn's compared to healthy controls. Data are from one experiment representative of three separate experiments. *P < 0.05; **P < 0.005, ***P < 0.0005. Error bars indicate mean ±SEM.
Extended data Fig 2. GCN2 deficiency does not affect the proliferation or differentiation of IECs.
Immunohistology analysis (a-c) and quantification (d) of colons and ileums from GCN2−/− and wild type (littermate) mice for (a) chromagranin A, (b) Ki67 and (c) Lysozme. Data are from one experiment representative of three separate experiments (n=3). *P < 0.05; **P < 0.005, ***P < 0.0005. Error bars indicate mean ±SEM.
Extended data Fig 3. GCN2 expression protects mice from DSS-induced colitis.
(a) H&E staining of colon sections before and after DSS in Wildtype vs GCN2−/− mice, GCN2flox/flox vs GCN2ΔVillin and GCN2flox/flox vs GCN2ΔAPC. IL-17 levels in (b) large intestineal and (c) small intestinal CD4+ T cells measured by flow cytometry; (d) GCN2−/− mice show increased intestinal permeability following DSS treatment evidenced by higher levels of FITC-dextran in the serum. (e) Expression of antimicrobial defensins in wild type and GCN2−/− mice via qPCR. (f) IL-17 production by flow cytometry and ELISA of OTII-CD4 T cells after culturing with different large intestinal APC subsets. Data are from one experiment representative of three separate experiments (n=4-5). *P < 0.05; **P < 0.005, ***P < 0.0005. Error bars indicate mean ±SEM.
Extended data Fig 4. PERK expression in epithelial cells plays only minor role in controlling mucosal homeostasis following DSS challenge.
(a-d) The body weight (a), colon length (b), histology by H&E (c) and Th17 responses (d) both in the colon (LI) and small intestine (SI) of PERKΔvillin and control wild type littermates treated with DSS. (e-h) The body weight (e), colon length (f), histology by H&E and histology score (g) and Th17 responses (h) both in the colon (LI) and small intestine (SI) of PERKΔAPC and control wild type littermates treated with DSS. (Data are representative of two separate experiments (n=5). Data are representative of two separate experiments. *P < 0.05; **P < 0.005, ***P < 0.0005. Error bars indicate mean ±SEM.
Extended data Fig 5. eIF2α expression in epithelial cells and antigen presenting cells controls weight loss and partially Th17 responses following DSS challenge.
(a-e) The body weight (a), colon length (b), histology by H&E and histology score (c) and Th17 responses in both the colon (LI) (d) and small intestine (SI) (e) of eIF2α Δvillin and control wild type littermates treated with DSS. (f-j) The body weight (f), colon length (g), histology by H&E and histology score (h) and Th17 responses in both the colon (LI) (i) and small intestine (SI) (j) of eIF2α ΔAPC and control wild type littermates treated with DSS. Data are representative of three separate experiments (n=5). *P < 0.05; **P < 0.005, ***P < 0.0005. Error bars indicate mean ±SEM.
Extended data Fig 6. Intestinal APCs and epithelial cells reveal high expression of LC3.
(a) Expression of LC3-GFP in APC subsets and epithelial cells of naive LC3-GFP mice by flow cytometry (n=3). Data is from a single experiment. (b) Kinetic Mean fluorescence Intensity (MFI) comparison of LC3B and p62 expression with and without chloroquine on individual APC subsets and epithelial cells by flow cytometry after 12 and 24 h of single DSS administration (c) Western blot detection of LC3-I and II on lamina propria APCs before and after digitonin (d) LC3B staining of individual APCs and epithelial cells 12 hrs after they were treated with DSS. The portion of the lamina propria cells were subjected to digitonin before intracellular staining with the LC3B antibody. Data are representative of two separate experiments (n=4-5). *P < 0.05; **P < 0.005, ***P < 0.0005. Error bars indicate mean ±SEM.
Extended data Fig 7. ATG5 and ATG7 expression in antigen presenting cells partially protects mice from DSS challenge.
(a-c) Colon length (a), histology by H&E and histology score (b) and Th17 responses (c) in both the colon (LI) and small intestine (SI) of Atg5ΔAPC and control wild type littermates treated with DSS. (d-f) Colon length (d), histology by H&E and histology score (e) and Th17responses (f) in both the colon (LI) and small intestine (SI) of Atg7ΔAPC and control wild type littermates treated with DSS Data are representative of three separate experiments (n=5). Data are representative of two separate experiments (n=5). *P < 0.05; **P < 0.005, ***P < 0.0005. Error bars indicate mean ±SEM.
Extended data Fig 8. GCN2 induced autophagy protects the intestinal tissue from the effects of excess oxidation and inflammation.
GCN2−/− and littermate wild type mice were treated with 2% DSS in the drinking water for 5 days. (a) MFIs of ROS and mitochondrial ROS (MitoSox) in individual APC subsets and epithelial cells of the small intestine isolated from wild type, and GCN2−/− were analyzed by flow cytometry (n=5). (b) MFIs of pro-IL-1β in individual APC subsets and epithelial cells of the small intestine isolated from wild type or GCN2−/− mice (Day 5 post DSS) were analyzed by flow cytometry (n=3). (c) Histology analysis of GCN2 mice that were treated with neutralizing antibody. (d) Effects of low protein diet on DSS induced colitis (e) Colon length. (f) Frequencies of CD4+, CD4+IFNγ+ and CD4+Foxp3+ T cells. Data are from one experiment representative of two or three separate experiments. *P < 0.05; **P < 0.005, ***P < 0.0005. Error bars indicate mean ±SEM.
Extended data Fig 9. Mechanisms by which GCN2 contributes to protection in the gut against acute colitis.
(a) Amino acid starvation induced by an inflamed colon activates GCN2 that triggers autophagy which is important in inhibiting oxidative stress and pro-IL-1β levels of IL-1β dictate the magnitude of IL-17A producing CD4 T cells in the colon. (b) A hypothetical model for the evolutionary significance of coupling amino acid starvation with control of inflammation.
Extended data Fig 10. Mouse phenotyping by flow cytometry and western blot.
In addition to molecular genotyping via tail DNA we analyzed the protein levels in various mucosal subsets by flow cytometry in various APC (a) and epithelial (b) specific conditional knockouts (c) Western blot to show selective depletion in APC populations in the Atg5flox/flox CD11c cre (Atg5ΔAPC) and the Atg7flox/flox CD11c cre (Atg7ΔAPC).
Acknowledgments
This work was supported by grants from the U.S. National Institutes of Health (grants R37 DK057665, R37 AI048638, U19 AI090023, U19 AI057266) and from the Bill & Melinda Gates Foundation to B.P. RJK grant support: R01 DK088227-06, R37 DK042394-16, R01 HL052173-18 and CCFA Senior Fellow Award 3800. We thank B. Cervasi and K. P. Gill for help with sorting and D. Levesque, D. Hampton, S. Weismann and colleagues for animal husbandry and veterinary support. The data presented in this manuscript are tabulated in the main paper and the supplementary materials. We also thank the Center for AIDS Research (CFAR) core at Yerkes primate research center for help with qPCR (Grant-P30-AI-50409) and the Integrated Cellular Imaging Center at Winship Cancer Center, Emory University for help with confocal microscopy. We also thank the Yerkes Pathology Core for performing the immunofluorescence and histology analysis. We thank Skip Virgin (Washington University, St. Louis) for his advice and review of the autophagy experiments.
Footnotes
Author Contributions
R.R, J.L and B.P. designed experiments and wrote the manuscript. R.R, J.L, N.K, D.K.M, B.L conducted the experiments. H.I.N and L.G performed the bioinformatics analysis of the public databases. P.H and Y.C.W genotyped mice. P.S performed the histology analysis. R.J.K provided reagents and edited the manuscript.
References
- 1.Zhou R, Yazdi AS, Menu P, Tschopp J. A role for mitochondria in NLRP3 inflammasome activation. Nature. 2011;469:221–225. doi: 10.1038/nature09663. doi:10.1038/nature09663. [DOI] [PubMed] [Google Scholar]
- 2.Kawai T, Akira S. Toll-like receptors and their crosstalk with other innate receptors in infection and immunity. Immunity. 2011;34:637–650. doi: 10.1016/j.immuni.2011.05.006. doi:10.1016/j.immuni.2011.05.006. [DOI] [PubMed] [Google Scholar]
- 3.Pulendran B. The Varieties of Immunological Experience:Of Pathogens, Stress, and Dendritic Cells. Annual Review of Immunology. 2015 Apr;33 doi: 10.1146/annurev-immunol-020711-075049. [DOI] [PubMed] [Google Scholar]
- 4.Donnelly N, Gorman AM, Gupta S, Samali A. The eIF2alpha kinases: their structures and functions. Cellular and molecular life sciences : CMLS. 2013;70:3493–3511. doi: 10.1007/s00018-012-1252-6. doi:10.1007/s00018-012-1252-6. [DOI] [PMC free article] [PubMed] [Google Scholar]
- 5.Han AP, et al. Heme-regulated eIF2alpha kinase (HRI) is required for translational regulation and survival of erythroid precursors in iron deficiency. EMBO J. 2001;20:6909–6918. doi: 10.1093/emboj/20.23.6909. doi:10.1093/emboj/20.23.6909. [DOI] [PMC free article] [PubMed] [Google Scholar]
- 6.Querec TD, et al. Systems biology approach predicts immunogenicity of the yellow fever vaccine in humans. Nature immunology. 2009;10:116–125. doi: 10.1038/ni.1688. doi:10.1038/ni.1688. [DOI] [PMC free article] [PubMed] [Google Scholar]
- 7.Ravindran R, et al. Vaccine activation of the nutrient sensor GCN2 in dendritic cells enhances antigen presentation. Science. 2014;343:313–317. doi: 10.1126/science.1246829. doi:10.1126/science.1246829. [DOI] [PMC free article] [PubMed] [Google Scholar]
- 8.Funke B, et al. Functional characterisation of decoy receptor 3 in Crohn's disease. Gut. 2009;58:483–491. doi: 10.1136/gut.2008.148908. doi:10.1136/gut.2008.148908. [DOI] [PubMed] [Google Scholar]
- 9.Kugathasan S, et al. Loci on 20q13 and 21q22 are associated with pediatric-onset inflammatory bowel disease. Nat Genet. 2008;40:1211–1215. doi: 10.1038/ng.203. doi:10.1038/ng.203. [DOI] [PMC free article] [PubMed] [Google Scholar]
- 10.Kleene SJ, Toews ML, Adler J. Isolation of glutamic acid methyl ester from an Escherichia coli membrane protein involved in chemotaxis. The Journal of biological chemistry. 1977;252:3214–3218. [PubMed] [Google Scholar]
- 11.Harding HP, Zhang Y, Ron D. Protein translation and folding are coupled by an endoplasmic-reticulum-resident kinase. Nature. 1999;397:271–274. doi: 10.1038/16729. doi:10.1038/16729. [DOI] [PubMed] [Google Scholar]
- 12.Back SH, et al. Translation attenuation through eIF2alpha phosphorylation prevents oxidative stress and maintains the differentiated state in beta cells. Cell metabolism. 2009;10:13–26. doi: 10.1016/j.cmet.2009.06.002. doi:10.1016/j.cmet.2009.06.002. [DOI] [PMC free article] [PubMed] [Google Scholar]
- 13.Cao SS, et al. Phosphorylation of eIF2alpha is dispensable for differentiation but required at a posttranscriptional level for paneth cell function and intestinal homeostasis in mice. Inflamm Bowel Dis. 2014;20:712–722. doi: 10.1097/MIB.0000000000000010. doi:10.1097/MIB.0000000000000010. [DOI] [PubMed] [Google Scholar]
- 14.Tattoli I, et al. Amino acid starvation induced by invasive bacterial pathogens triggers an innate host defense program. Cell Host Microbe. 2012;11:563–575. doi: 10.1016/j.chom.2012.04.012. doi:10.1016/j.chom.2012.04.012. [DOI] [PubMed] [Google Scholar]
- 15.Saitoh T, et al. Loss of the autophagy protein Atg16L1 enhances endotoxin-induced IL-1beta production. Nature. 2008;456:264–268. doi: 10.1038/nature07383. doi:10.1038/nature07383. [DOI] [PubMed] [Google Scholar]
- 16.Mizushima N, Kuma A. Autophagosomes in GFP-LC3 Transgenic Mice. Methods Mol Biol. 2008;445:119–124. doi: 10.1007/978-1-59745-157-4_7. doi:10.1007/978-1-59745-157-4_7. [DOI] [PubMed] [Google Scholar]
- 17.Martinez J, et al. Molecular characterization of LC3-associated phagocytosis reveals distinct roles for Rubicon, NOX2 and autophagy proteins. Nature cell biology. 2015;17:893–906. doi: 10.1038/ncb3192. doi:10.1038/ncb3192. [DOI] [PMC free article] [PubMed] [Google Scholar] [Retracted]
- 18.Damiani CR, et al. Oxidative stress and metabolism in animal model of colitis induced by dextran sulfate sodium. Journal of gastroenterology and hepatology. 2007;22:1846–1851. doi: 10.1111/j.1440-1746.2007.04890.x. doi:10.1111/j.1440-1746.2007.04890.x. [DOI] [PubMed] [Google Scholar]
- 19.Brubacher JL, Bols NC. Chemically de-acetylated 2′,7′-dichlorodihydrofluorescein diacetate as a probe of respiratory burst activity in mononuclear phagocytes. J Immunol Methods. 2001;251:81–91. doi: 10.1016/s0022-1759(01)00308-8. [DOI] [PubMed] [Google Scholar]
- 20.Julian D, April KL, Patel S, Stein JR, Wohlgemuth SE. Mitochondrial depolarization following hydrogen sulfide exposure in erythrocytes from a sulfidetolerant marine invertebrate. J Exp Biol. 2005;208:4109–4122. doi: 10.1242/jeb.01867. doi:10.1242/jeb.01867. [DOI] [PubMed] [Google Scholar]
- 21.Zhang P, et al. The GCN2 eIF2alpha kinase is required for adaptation to amino acid deprivation in mice. Mol Cell Biol. 2002;22:6681–6688. doi: 10.1128/MCB.22.19.6681-6688.2002. [DOI] [PMC free article] [PubMed] [Google Scholar]
- 22.Hao S, et al. Uncharged tRNA and sensing of amino acid deficiency in mammalian piriform cortex. Science. 2005;307:1776–1778. doi: 10.1126/science.1104882. doi:10.1126/science.1104882. [DOI] [PubMed] [Google Scholar]
- 23.Anthony TG, et al. Preservation of liver protein synthesis during dietary leucine deprivation occurs at the expense of skeletal muscle mass in mice deleted for eIF2 kinase GCN2. J Biol Chem. 2004;279:36553–36561. doi: 10.1074/jbc.M404559200. doi:10.1074/jbc.M404559200. [DOI] [PubMed] [Google Scholar]
- 24.Sundrud MS, et al. Halofuginone inhibits TH17 cell differentiation by activating the amino acid starvation response. Science. 2009;324:1334–1338. doi: 10.1126/science.1172638. doi:10.1126/science.1172638. [DOI] [PMC free article] [PubMed] [Google Scholar]
- 25.Kau AL, Ahern PP, Griffin NW, Goodman AL, Gordon JI. Human nutrition, the gut microbiome and the immune system. Nature. 2011;474:327–336. doi: 10.1038/nature10213. doi:10.1038/nature10213. [DOI] [PMC free article] [PubMed] [Google Scholar]
- 26.Hu JF, et al. Repression of hepatitis B virus (HBV) transgene and HBV-induced liver injury by low protein diet. Oncogene. 1997;15:2795–2801. doi: 10.1038/sj.onc.1201444. doi:10.1038/sj.onc.1201444. [DOI] [PubMed] [Google Scholar]
- 27.Ariyasinghe A, et al. Protection against malaria due to innate immunity enhanced by low-protein diet. J Parasitol. 2006;92:531–538. doi: 10.1645/GE-551R1.1. doi:10.1645/GE-551R1.1. [DOI] [PubMed] [Google Scholar]
- 28.Oarada M, et al. Beneficial effects of a low-protein diet on host resistance to Paracoccidioides brasiliensis in mice. Nutrition. 2009;25:954–963. doi: 10.1016/j.nut.2009.02.004. doi:10.1016/j.nut.2009.02.004. [DOI] [PubMed] [Google Scholar]
- 29.Li C, et al. Immunopotentiation of NKT cells by low-protein diet and the suppressive effect on tumor metastasis. Cell Immunol. 2004;231:96–102. doi: 10.1016/j.cellimm.2004.12.005. doi:10.1016/j.cellimm.2004.12.005. [DOI] [PubMed] [Google Scholar]
- 30.Peng W, et al. Surgical stress resistance induced by single amino acid deprivation requires Gcn2 in mice. Science translational medicine. 2012;4:118ra111. doi: 10.1126/scitranslmed.3002629. doi:10.1126/scitranslmed.3002629. [DOI] [PMC free article] [PubMed] [Google Scholar]
- 31.Harding HP, et al. Regulated translation initiation controls stress-induced gene expression in mammalian cells. Mol Cell. 2000;6:1099–1108. doi: 10.1016/s1097-2765(00)00108-8. [DOI] [PubMed] [Google Scholar]
- 32.Zhang P, et al. The PERK eukaryotic initiation factor 2 alpha kinase is required for the development of the skeletal system, postnatal growth, and the function and viability of the pancreas. Mol Cell Biol. 2002;22:3864–3874. doi: 10.1128/MCB.22.11.3864-3874.2002. [DOI] [PMC free article] [PubMed] [Google Scholar]
- 33.Caton ML, Smith-Raska MR, Reizis B. Notch-RBP-J signaling controls the homeostasis of CD8- dendritic cells in the spleen. J Exp Med. 2007;204:1653–1664. doi: 10.1084/jem.20062648. doi:10.1084/jem.20062648. [DOI] [PMC free article] [PubMed] [Google Scholar]
- 34.Madison BB, et al. Cis elements of the villin gene control expression in restricted domains of the vertical (crypt) and horizontal (duodenum, cecum) axes of the intestine. J Biol Chem. 2002;277:33275–33283. doi: 10.1074/jbc.M204935200. doi:10.1074/jbc.M204935200. [DOI] [PubMed] [Google Scholar]
- 35.Back SH, et al. Translation attenuation through eIF2alpha phosphorylation prevents oxidative stress and maintains the differentiated state in beta cells. Cell Metab. 2009;10:13–26. doi: 10.1016/j.cmet.2009.06.002. doi:10.1016/j.cmet.2009.06.002. [DOI] [PMC free article] [PubMed] [Google Scholar]
- 36.Mizushima N, Yamamoto A, Matsui M, Yoshimori T, Ohsumi Y. In vivo analysis of autophagy in response to nutrient starvation using transgenic mice expressing a fluorescent autophagosome marker. Mol Biol Cell. 2004;15:1101–1111. doi: 10.1091/mbc.E03-09-0704. doi:10.1091/mbc.E03-09-0704. [DOI] [PMC free article] [PubMed] [Google Scholar]


