Abstract
Background
Body composition changes with aging lead to increased adiposity and decreased muscle mass, making the diagnosis of obesity challenging. Conventional anthropometry, including body mass index (BMI), while easy to use clinically may misrepresent adiposity. We determined the diagnostic accuracy of BMI using dual energy x-ray absorptiometry (DEXA) in assessing the degree of obesity in older adults.
Methods
The National Health and Nutrition Examination Surveys 1999–2004 were used to identify adults aged ≥60years with DEXA measures. They were categorized (yes/no) as having elevated body fat by gender (men≥25%; females ≥35%) and by body mass index (BMI) ≥25 and ≥30kg/m2. The diagnostic performance of BMI was assessed. Metabolic characteristics were compared in discordant cases of BMI/body fat. Weighting and analyses were performed per NHANES guidelines.
Results
We identified 4,984 subjects (men:2,453; female:2,531). Mean BMI and % body fat was 28.0kg/m2 and 30.8% in men, and 28.5kg/m2 and 42.1% in females. A BMI ≥30kg/m2 had a low sensitivity and moderately high specificity (men:32.9% and 80.8%, concordance index 0.66; females:38.5% and 78.5%, concordance 0.69) correctly classifying 41.0 and 45.1% of obese subjects. A BMI ≥25kg/m2 had a moderately high sensitivity and specificity (men:80.7% and 99.6%, concordance 0.81;females:76.9% and 98.8%, concordance 0.84) correctly classifying 80.8 and 78.5% of obese subjects. In subjects with BMI<30kg/m2 body fat was considered elevated in 67.1% and 61.5% of males and females, respectively. For a BMI≥30kg/m2, sensitivity drops from 40.3 to 14.5% and 44.5 to 23.4%, while specificity remains elevated (>98%),in males and females, respectively in those 60–69.9years to subjects aged ≥80years. Correct classification of obesity using a cutoff of 30kg/m2 drops from 48.1 to 23.9% and 49.0 to 19.6%, in males and females in these two age groups.
Conclusions
Traditional measures poorly identify obesity in the elderly. In older adults, BMI may be a suboptimal marker for adiposity.
Keywords: obesity, diagnostic accuracy, body mass index, body fat, epidemiology
INTRODUCTION
Obesity is a global public health crisis1 associated with considerable health risks that increase the risk of coronary artery disease, stroke, cancer and premature mortality2, 3. The importance of identifying obesity as a disease in a clinical care setting is critical to the management of such patients4. Accurate diagnosis of obesity in older adults is an essential first step in delivering effective treatment to older adults most at risk.
Body mass index (BMI) is the most common method to diagnose obesity in primary care and subspecialty settings. Population-based studies have proven the metabolic consequences of having a BMI≥25kg/m2 and the mortality risk of a BMI ≥30kg/m22, 3. These guidelines have been incorporated in public health campaigns and have become common practice. Other anthropometric measures have been suggested for use, including waist circumference, as they additionally place individuals at high overall cardiometabolic risk, independent of BMI5. However, they have not been fully recommended to be used in recent national guidelines4.
While BMI may reasonably predict adverse outcomes in global population-based adult studies, recent studies have demonstrated that traditional BMI cutoffs may in fact misrepresent the degree of adverse outcomes in older populations5, 6. This is partly explained by the changes observed in body composition occurring with aging7 including the gradual increase in fat mass, the decrease in muscle mass and quality or sarcopenia, and the degree of underlying systemic inflammation. Identifying the predictive validity and diagnostic accuracy of BMI in this older subpopulation is critically important to provide reasonable recommendations to front-line clinicians. The purpose of this study was to determine the diagnostic performance of BMI to identify obesity based on body fat in elderly subjects using established cutoffs for overweight and obesity. We also determined the differences in underlying metabolic abnormalities in those with varying degrees of body fat content using body composition measurements but not otherwise classified as having obesity.
METHODS
The National Health and Nutrition Examination Surveys are cross-sectional surveys conducted by the Centers for Disease Prevention and Control since 1971. The survey samples non-institutionalized adults of the United States and oversamples minorities and elderly adults. It is a complex stratified multistage probability sampling design allowing generalizability of the results to the rest of the population. All of the survey contents and procedures are available online at http://www.cdc.gov/nchs/nhanes.htm (accessed February 2015). Data for this analysis were limited to the 1999–2004 datasets. The survey has been approved by an internal Institutional Review Board, and was exempt from local review because of the de-identified nature of the results.
Of the 38,077 total participants screened, 31,125 were interviewed, and 29,402 were examined in a standardized mobile examination center. We limited our analysis to those aged 60 and older as the relationship between obesity and BMI is less clear in an elderly population. In the cohort aged ≥60years, 7,729 were screened, 5,607 (72.5%) were interviewed, and 4,984 (64.5%) were examined. All subjects included in our analysis had body composition data obtained by dual-energy X-ray absorptiometry (DEXA). There were 4,984 participants fulfilling these criteria and were classified by race (non-Hispanic White, non-Hispanic Black, Hispanic, and Other), and by age group, where applicable (60–69.9, 70–79.9, and ≥80years). All baseline demographic characteristics were assessed using a self-report questionnaire.
Measurements were all performed on the right side of the body to the nearest 0.1cm, except where casts, amputations and other factors prevented such assessment. Height was measured using a stadiometer after deep inhalation, and weight was measured using an electronic digital scale, calibrated in kilograms. Body mass index was calculated as weight (kg) divided by height (m) squared. Waist circumference was measured in the standing position at the iliac crest, crossing the mid-axillary line, with the measuring tape placed around the trunk. Blood pressure was measured in the mobile examination center by a trained examiner following the latest recommendations of the American Heart Association Human Blood Pressure Determination by a mercury sphygmomanometer8. Determinations were recorded directly onto a computerized data collection form and the blood pressure reported to the examinee is that reported in this study. All DEXA data were obtained using a QDR-4500, Hologic scanner (Bedford, MA) by trained technicians. The procedure lasted roughly 3 minutes. DEXA exclusions consisted of subjects who were ≥192.5cm or weighed ≥136.4kg in this subgroup. Metal objects, except false dentition and hearing aids, were removed. Overall fat mass, muscle mass, bone measurements, appendicular skeletal muscle mass of all limbs, and bone mineral content were assessed. Total body fat percent and lean mass percent were subsequently calculated. These techniques were similar in all NHANES cycles.
Detailed specimen collection and processing instructions are discussed in the NHANES Laboratory/Medical Technologists Procedures Manual located on the NHANES website (http://www.cdc.gov/nhanes). Vials were stored under appropriate frozen (−20°C) conditions until they were shipped for testing. Non-fasting routine biochemistries, including glucose, triglycerides were performed with a Hitachi Model 704 multichannel analyzer (Boehringer Mannheim Diagnostics, Indianopolis, IN). Total cholesterol, HDL, triglycerides, and LDL cholesterol were shipped to Johns Hopkins University Lipoprotein Analytical Laboratory for testing. Blood specimens for fasting glucose, insulin, were processed, stored, and shipped to the University of Missouri-Columbia for analysis, and C-reactive protein was performed at the University of Washington. The homeostatic assessment model-1 was determined using published equations to determine insulin resistance and β-cell function9. HOMA-IR was calculated as: (fasting insulin × fasting glucose (mg/dL))/405. Homa-B was calculated as (360 × insulin)/(glucose-63), represented as a percentage.
Statistical Analysis
All data were merged and analyzed according to the policies and procedures outlined by NHANES. Baseline characteristics are presented as weighted means with standard errors for all continuous variables, and weighted percentages for categorical determinations. Because of the known differences in body composition7, baseline characteristics were stratified by sex. The gold standard assessment was considered body fat percent based on DEXA-obtained adiposity to determine the diagnostic performance of BMI. Obesity diagnosis based on fat content measured with DEXA was defined as having body fat equal or greater than 25% for males, and 35% for females10, based on values recommended by the American Association for Clinical Endocrinology and those used in our previous studies5, 6, 11. Subjects were also classified according to standard BMI cutoffs of 25kg/m2 and 30kg/m2 representing overweight and obesity.
Diagnostic performance was assessed by determining sensitivity, specificity, positive and negative predictive values, and positive and negative likelihood ratios. Receiver operating characteristics curves were constructed for BMI to detect BF%-defined obesity for all subjects separately by sex and ethnicity. We additionally report the distribution of individuals with a normal BMI but elevated body fat and differences in metabolic variables in subjects whose BMI <30kg/m2 with differing sex-specific cutpoints of body fat and separately demonstrating cumulative distribution functions of percent body fat by BMI cutoff (30kg/m2) in both sexes. T-tests of unequal variances compared metabolic variables between these two groups in each sex. Replicates and data review were performed for quality assurance. All analyses were conducted using STATA v13 (College Station, TX) accounting for strata, primary sampling unit, and weighting. Separate weights were used for the fasting morning subsample. Interview weights were used according to NHANES procedures to account for the unequal probabilities of selection, participant non-response, non-reponse to the in-home interview and mobile center examination, and also were post-stratified to match estimates of the US non-institutionalized adult population. A P value <0.05 was considered statistically significant and Bonferroni multiple comparison adjustments were performed when necessary.
RESULTS
Our final dataset consisted of 2,531 men and 2,453 females aged over 60 years, as indicated in Table 1. Mean BMI was 28.0 and 28.5kg/m2 in men and females, respectively, with 28.9% and 34.3% of older adults classified as having obesity based on BMI. Based on body fat, 87.5 and 89.1% of men and females are classified as having obesity. In those aged ≥80years, a BMI ≥30kg/m2 had a very low sensitivity, negative predictive value, and concordance rates as compared to younger cohorts. Notably, both lean mass and appendicular skeletal mass were higher in men than females.
Table 1.
Baseline Characteristics – National Health and Nutrition Examination Surveys 1999–2004
| Counts | Height cm |
Weight Kg |
BMI kg/m2 |
% BMIa obese |
Waist Circumference cm |
Body Fat % |
% BF obeseb |
Lean Mass % |
ASM kg |
|
|---|---|---|---|---|---|---|---|---|---|---|
| Men | ||||||||||
| ≥60years | 2,531 | 173±0.26 | 83.0±0.46 | 28.0±0.10 | 28.9% | 103.7±0.33 | 30.8±0.12 | 87.5% | 66.6±0.01 | 23.9±0.14 |
| 60–69.9years | 1,061 | 174.6±0.34 | 88.0±0.68 | 28.9±0.16 | 35.1% | 105.1±0.49 | 30.6±0.23 | 86.5% | 66.9±0.01 | 25.4±0.19 |
| 70–79.9years | 857 | 172.3±0.46 | 82.6±0.77 | 27.7±0.17 | 27.2% | 103.6±0.52 | 31.1±0.23 | 88.4% | 66.2±0.01 | 23.2±0.21 |
| 80+ | 535 | 170.1±0.42 | 75.2±0.68 | 27.7±0.17 | 17.9% | 99.7±0.58 | 30.6±0.27 | 88.2% | 66.6±0.01 | 21.0±0.15 |
| Females | ||||||||||
| ≥60years | 2,453 | 158.9±0.18 | 72.0±0.39 | 28.5±0.15 | 34.3% | 96.9±0.32 | 42.1±0.13 | 89.1% | 55.8±0.01 | 16.3±0.11 |
| 60–69.9years | 1,115 | 160.6±0.26 | 76.2±0.59 | 29.5±0.22 | 40.9% | 98.2±0.51 | 42.6±0.17 | 91.7% | 55.2±0..01 | 17.3±0.14 |
| 70–79.9years | 778 | 158.4±0.33 | 71.3±0.76 | 28.4±0.27 | 34.2% | 97.4±0.56 | 42.4±0.28 | 90.9% | 55.4±0.01 | 16.0±0.18 |
| 80+ | 638 | 155.8±0.26 | 63.6±0.75 | 26.2±0.27 | 18.9% | 93.0±0.52 | 40.3±0.25 | 80.7% | 57.5±0.01 | 14.7±0.18 |
All values presented are designated as means ± standard errors, or weighted prevalence rates
Abbreviations: ASM – appendicular skeletal muscle; BF – body fat; BMI – body mass index; WC – waist circumference
BMI classified as having obesity was based as ≥30kg/m2
BF obese is classified as having a body fat ≥25% for men and ≥35% for females
Table 2A represents the diagnostic performance for a BMI of 25 and 30kg/m2. As the cutoff for BMI increases from 25 to 30kg/m2, the sensitivity drops, and the specificity increases in both sexes. Correct classification of obesity drops markedly with age with both cutoffs, but is markedly lower using a BMI≥30kg/m2. The ideal BMI to identify obesity in men and females is 24.91 and 24.1kg/m2, respectively (Figure 1). Table 2B represents using standard WC cutoffs and Figure 2 Represents the receiver operator curves noting the optimal thresholds are 97.6 and 87.4cm, respectively. In Table 3, we present data on metabolic variables in the subset of subjects in each sex with a BMI <30kg/m2 and a low WC stratified by body fat. Across both non-fasting and fasting samples, a number of indicators suggest the heterogeneity of those with a BMI<30kg/m2 with regard to cardiometabolic dysfunction. These differences were not observed in females with a low WC. Cumulative distribution functions are presented in Figure 3. We present in Figure 4, the distribution and weighted prevalence in those with a BMI<30kg/m2 and body fat. The line designates the standard body fat cutoff for obesity (men: 25%; females: 35%). Lastly, Table 4 represents the adjusted correlation coefficients between BMI and body fat, lean mass and appendicular skeletal mass, both by sex, and by age-group.
Table 2.
| A: Diagnostic Performance for Body Mass Index using cutoffs of ≥25kg/m2 and ≥30kg/m2 by Age Group and Sex | ||||||||||||||||
|---|---|---|---|---|---|---|---|---|---|---|---|---|---|---|---|---|
| BMI≥25kg/m2 | BMI≥30kg/m2 | |||||||||||||||
| Sensitivity | Specificity | Correctly Classified |
PPV | NPV | +LR | −LR | C- index |
Sensitivity | Specificity | Correctly Classified |
PPV | NPV | + LR | −LR | C- index |
|
| Men | ||||||||||||||||
| ≥60years | 80.7 | 81.4 | 80.8 | 96.9 | 37.0 | 4.34 | 0.24 | 0.81 | 32.9 | 99.6 | 41.0 | 99.8 | 17.2 | 79.7 | 0.67 | 0.66 |
| 60–69.9years | 87.2 | 76.3 | 85.7 | 96.0 | 47.6 | 3.68 | 0.17 | 0.82 | 40.3 | 99.2 | 48.1 | 99.7 | 20.2 | 51.8 | 0.60 | 0.70 |
| 70–79.9years | 79.5 | 87.3 | 80.4 | 98.0 | 35.4 | 6.25 | 0.24 | 0.83 | 30.9 | 100.0 | 38.7 | 100.0 | 15.7 | --- | 0.69 | 0.65 |
| 80+ years | 63.2 | 86.9 | 65.8 | 97.5 | 22.4 | 4.80 | 0.42 | 0.75 | 14.5 | 100.0 | 23.9 | 100.0 | 12.7 | --- | 0.86 | 0.57 |
| Females | ||||||||||||||||
| ≥60years | 76.9 | 91.6 | 78.5 | 98.7 | 32.2 | 9.10 | 0.25 | 0.84 | 38.5 | 98.8 | 45.1 | 99.9 | 88.5 | 233.4 | 0.62 | 0.69 |
| 60–69.9years | 79.7 | 91.3 | 80.7 | 99.1 | 28.3 | 9.12 | 0.22 | 0.86 | 44.5 | 99.5 | 49.0 | 99.9 | 13.6 | 96.8 | 0.56 | 0.72 |
| 70–79.9years | 78.8 | 92.2 | 80.0 | 99.0 | 30.4 | 10.1 | 0.23 | 0.85 | 37.7 | 100.0 | 43.4 | 100.0 | 13.9 | --- | 0.62 | 0.69 |
| 80+ years | 65.7 | 91.3 | 70.8 | 96.9 | 39.4 | 7.59 | 0.38 | 0.79 | 23.4 | 100.0 | 38.4 | 100.0 | 24.1 | --- | 0.77 | 0.62 |
| B: Diagnostic Performance for Waist Circumference for Diagnosing Obesity using sex-specific cutoffs by Age Group and Sex | |||||||||
|---|---|---|---|---|---|---|---|---|---|
| Waist Circumference ≥102cm in Males or ≥88cm in Females | |||||||||
| Sensitivity | Specificity | Correctly Classified |
PPV | NPV | +LR | −LR | C-index | ||
| Men | |||||||||
| ≥60years | 59.7 | 95.5 | 64.2 | 98.9 | 74.4 | 13.11 | 0.42 | 0.78 | |
| 60–69.9years | 64.9 | 96.0 | 69.1 | 99.0 | 69.7 | 16.2 | 0.37 | 0.80 | |
| 70–79.9years | 59.8 | 92.6 | 63.7 | 98.4 | 76.4 | 8.03 | 0.43 | 0.76 | |
| 80+ years | 44.0 | 100 | 50.3 | 100.0 | 81.3 | --- | 0.56 | 0.72 | |
| Females | |||||||||
| ≥60years | 80.5 | 85.5 | 81.0 | 97.9 | 65.7 | 5.54 | 0.23 | 0.83 | |
| 60–69.9years | 80.6 | 89.6 | 81.4 | 98.9 | 70.7 | 7.77 | 0.22 | 0.85 | |
| 70–79.9years | 82.1 | 85.5 | 82.4 | 98.3 | 67.6 | 5.65 | 0.21 | 0.84 | |
| 80+ years | 77.0 | 81.2 | 77.8 | 100.0 | 83.7 | 4.08 | 0.28 | 0.79 | |
All sensitivity, specificity, correctly classified values and predictive values represent percentages
Abbreviations: C-index: concordance index; BMI: body mass index; C-index: concordance index; +LR: positive likelihood ratio; -LR: negative likelihood ratio
Figure 1.
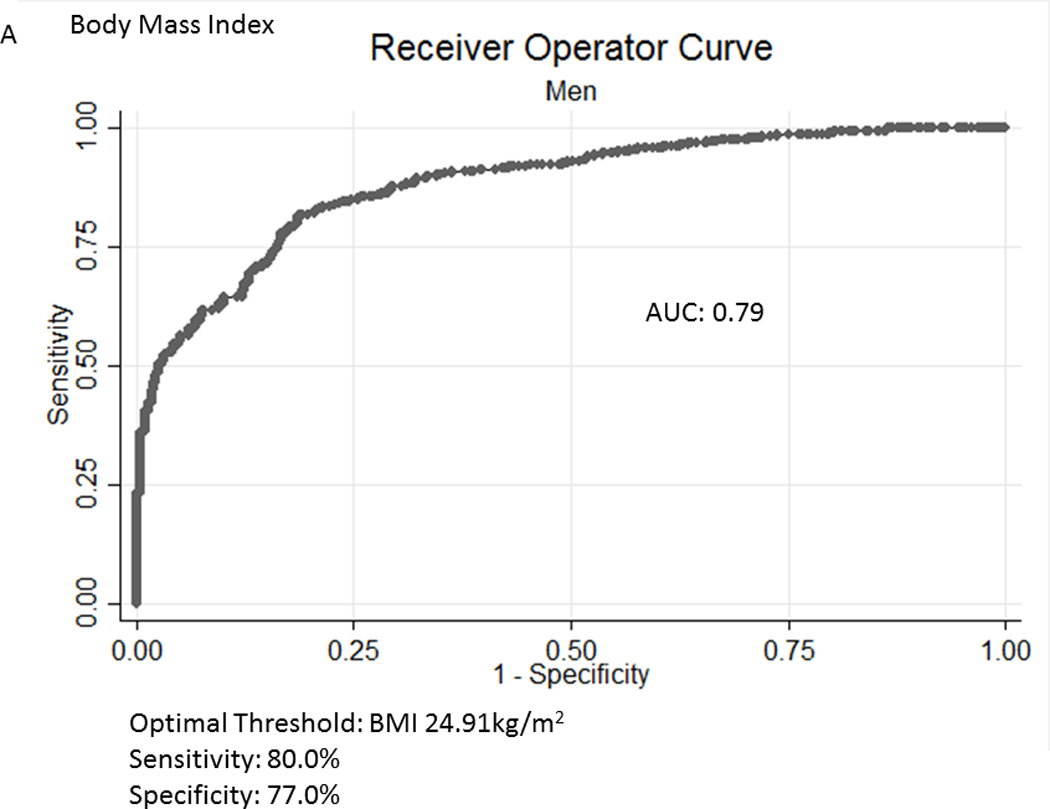
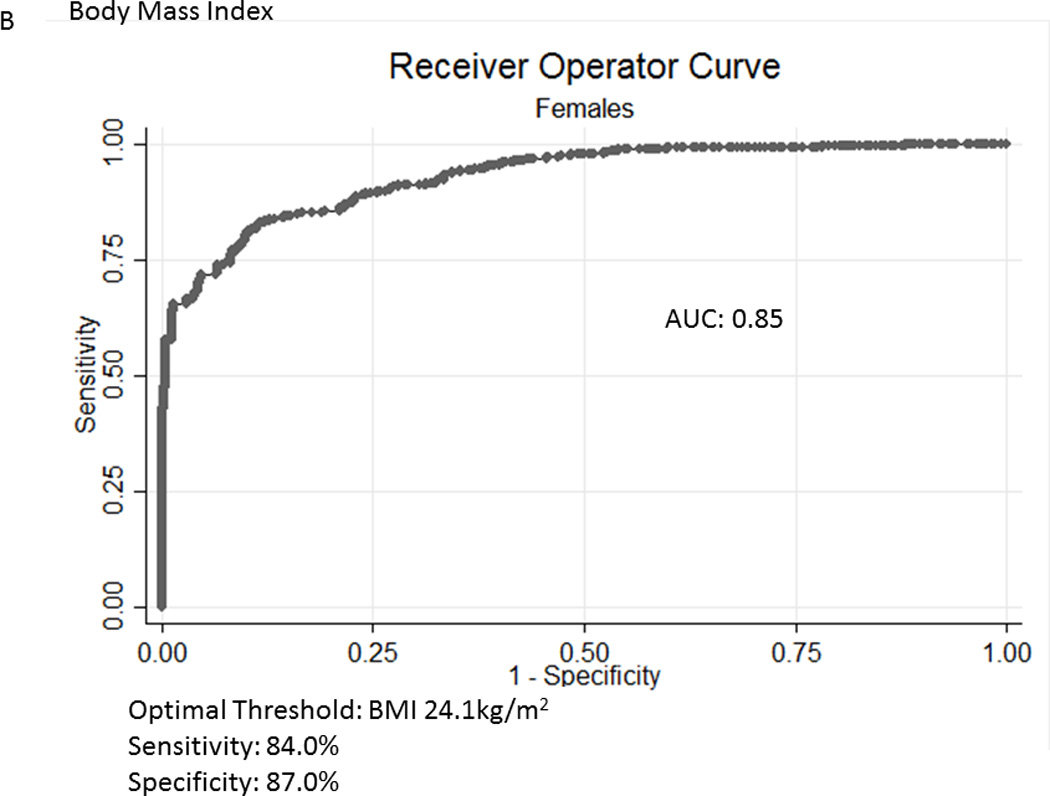
A, B Receiver Operator Curves for body mass index (BMI) for all subjects aged ≥60years in the National Health and Nutrition Examination Survey 1999-2004 sample included in this analysis to detect body fat percentage by sex. Men - Figure a; Females – Figure b.
Figure 2.
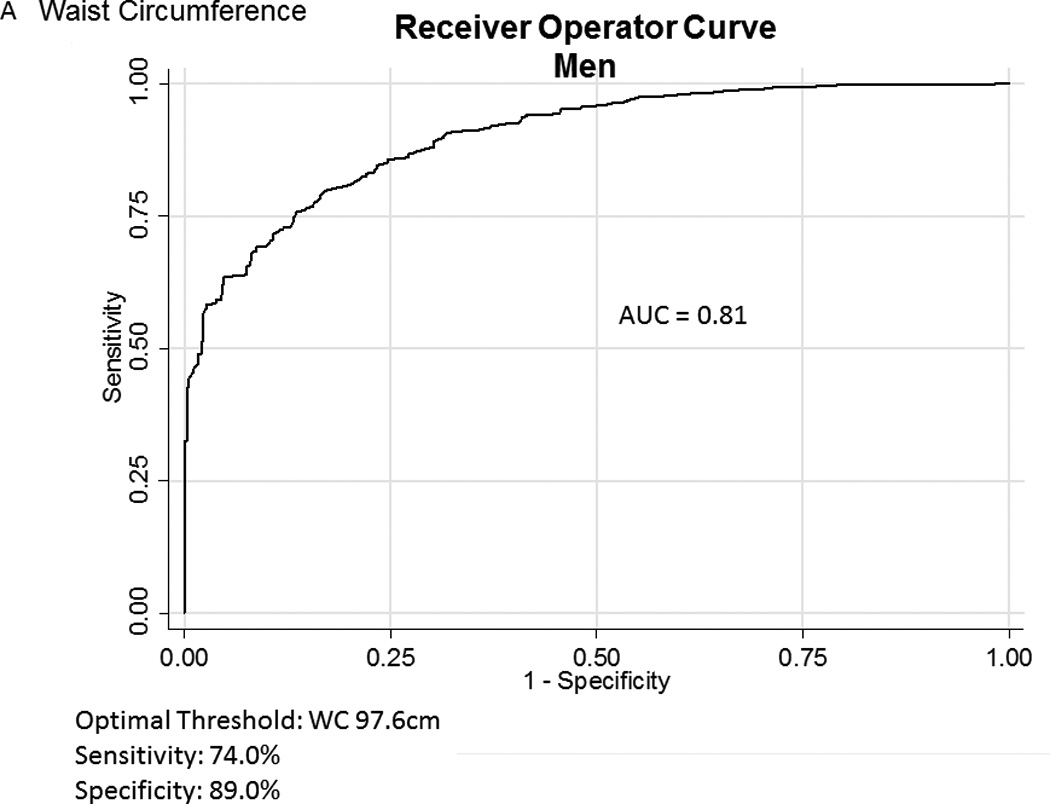
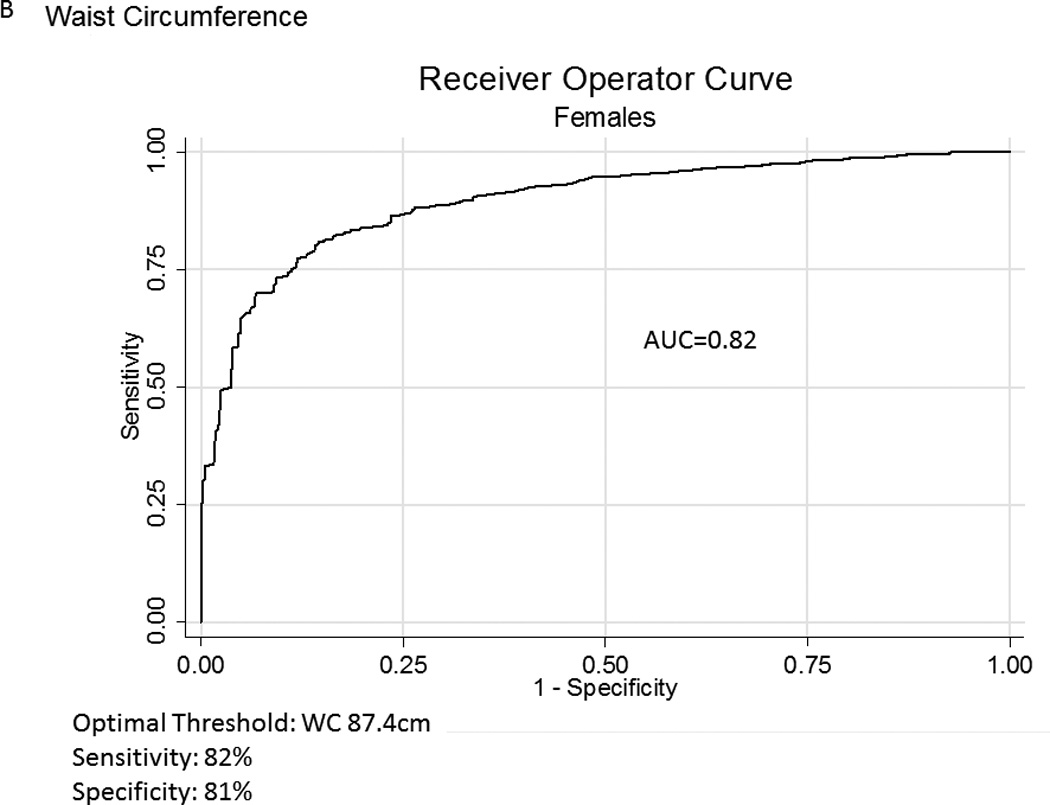
A, B Receiver Operator Curves for waist circumference (WC) for all subjects aged ≥60years in the National Health and Nutrition Examination Survey 1999–2004 sample included in this analysis to detect body fat percentage by sex. Men - Figure a; Females – Figure b
Table 3.
Metabolic Differences Based on Body Fat Content among Men and Women with a BMI <30 kg/m2
| BMI<30kg/m2 | Waist Circumference <102cm (Men); <88cm (Females) | |||||||||||
|---|---|---|---|---|---|---|---|---|---|---|---|---|
| Men | Females | Men | Females | |||||||||
| BF<25% | BF≥25% | p- value†- |
BF<35% | BF≥35% | p- value†- |
BF<25% | BF≥25% | p- value†- |
BF<35% | BF≥35% | p- value†- |
|
| Non-Fasting | N=1,352 | N=624 | 1,285 | N=833 | N=296 | N=777 | n=198 | N=375 | ||||
| Glucose, mg/dL |
105.5±1.35 | 112.0±1.90 | 0.009 | 100.7±1.31 | 108.9±2.22 | 0.005 | 102.4±2.7 | 104.5±1.4 | 0.46 | 98.1±5.1 | 95.7±1.8 | 0.21 |
| Triglycerides, mg/dL |
152.1±5.89 | 167.6±4.50 | 0.005 | 148.6±4.10 | 167.6±3.78 | <0.001 | 121.0±6.1 | 144.7±7.9 | 0.028 | 120.4±5.9 | 127.8±4.2 | 0.19 |
| HDL mg/dL | 48.1±0.69 | 44.7±0.56 | <0.001 | 60.3±0.63 | 53.2±0.61 | <0.001 | 53.7±1.1 | 49.1±1.0 | 0.002 | 67.2±2.2 | 65.1±1.0 | 0.31 |
| CRP, mg/dL | 0.51±0.04 | 0.50±0.04 | 0.88 | 0.51±0.05 | 0.74±0.03 | <0.001 | 0.40±0.06 | 0.52±0.05 | 0.13 | 0.40±0.04 | 0.58±0.15 | 0.24 |
| Systolic Blood Pressure, mmHg |
135.6±0.98 | 134.4±1.16 | 0.40 | 141.7±0.87 | 141.9±1.04 | 0.05 | 133.7±1.5 | 135.6±1.18 | 0.34 | 142.7±2.2 | 137.7±1.6 | 0.10 |
| Diastolic blood pressure, mmHg |
68.1±0.87 | 71.5±0.70 | <0.001 | 67.6±0.56 | 68.8±0.71 | 0.19 | 69.7±1.1 | 67.4±1.1 | 0.11 | 66.2±1.5 | 67.3±0.7 | 0.47 |
| TChol, mg/dL | 201.4±1.93 | 198.6±1.49 | 0.29 | 221.8±1.21 | 218.2±2.12 | 0.15 | 199.0±3.3 | 200.4±2.5 | 0.12 | 215.0±4.2 | 220.6±1.8 | 0.27 |
| Fasting Subsample* | N=124 | N=361 | N=92 | N=171 | ||||||||
| Glucose, mg/dL |
110.9±1.52 | 122.2±4.35 | 0.02 | 106.2±2.07 | 114.2±2.89 | 0.007 | 103.6±1.88 | 110.1±1.9 | 0.026 | 96.5±1.6 | 96.7±1.3 | 0.91 |
| Triglycerides | 155.5±4.90 | 169.6±8.98 | 0.18 | 158.3±4.21 | 168.5±5.60 | 0.08 | 114.2±7.3 | 142.9±5.0 | <0.001 | 135.1±9.5 | 141.2±5.7 | 0.65 |
| Insulin μU/mL | 10.8±0.30 | 20.6±1.81 | <0.001 | 10.2±0.33 | 16.1±0.86 | <0.001 | 6.93±0.44 | 9.50±0.29 | <.001 | 6.68±0.36 | 7.63±0.39 | 0.08 |
| LDL- Cholesterol |
122.9±1.56 | 117.2±2.55 | 0.03 | 129.8±1.72 | 131.8±2.76 | 0.47 | 119.5±3.5 | 123.7±2.1 | 0.36 | 122.0±3.6 | 128.9±2.2 | 0.06 |
| HOMA IR | 3.04±0.11 | 6.44±0.79 | <0.001 | 2.82±0.13 | 4.80±0.36 | <0.001 | 1.83±0.13 | 2.66±0.12 | <0.001 | 1.63±0.11 | 1.86±0.10 | 0.12 |
| Homa-β | 94.0±3.99 | 120.5±22.2 | 0.24 | 95.2±2.83 | 126.1±6.54 | <0.001 | 66.8±4.0 | 86.5±5.1 | 0.005 | 75.7±3.4 | 86.4±6.2 | 0.18 |
All values represent means ± standard errors. P-values test the difference in means between subjects with a high and low body fat content
- represents a subsample of subjects in NHANES with a morning fasting sample of these variables
Abbreviations: CRP: C-reactive protein; HDL: high density lipoprotein; HOMA – homeostatic model assessment; IR – insulin resistance; LDL – low density lipoprotein; TChol – Total cholesterol;
Normal Waist Circumference is defined in males as <102cm and females <88cm
adjusted for multiple comparisons (Bonferroni adjustment) – a p-value of 0.05/4=0.0125 is considered significant
Figure 3.
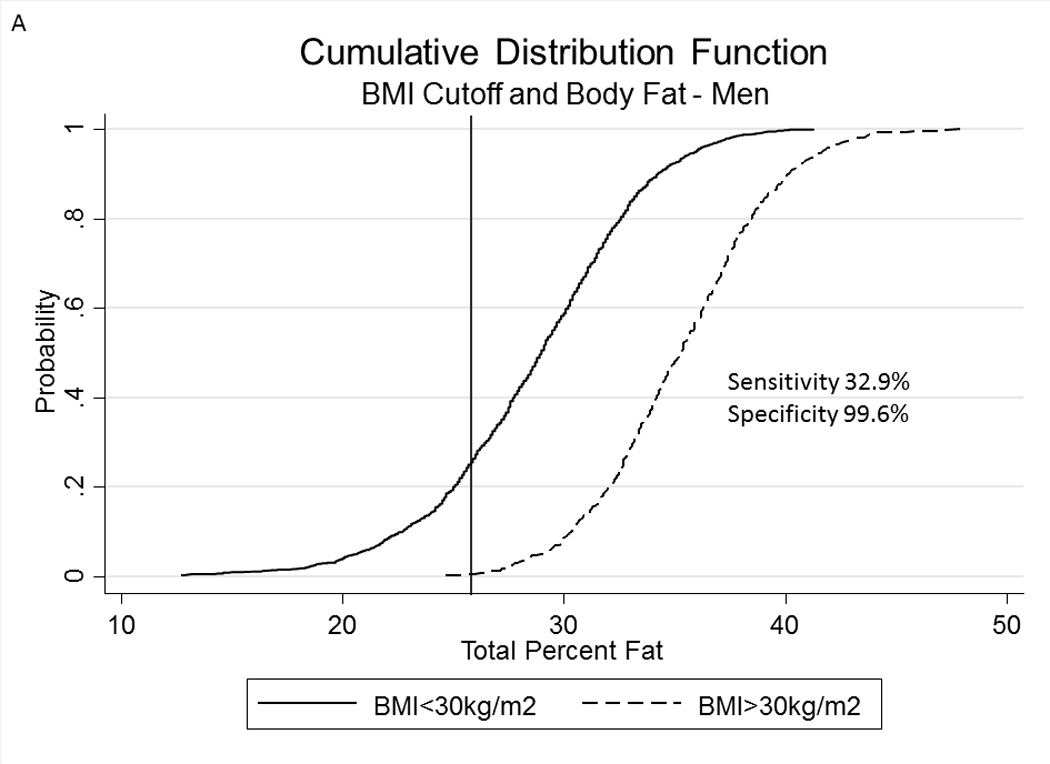
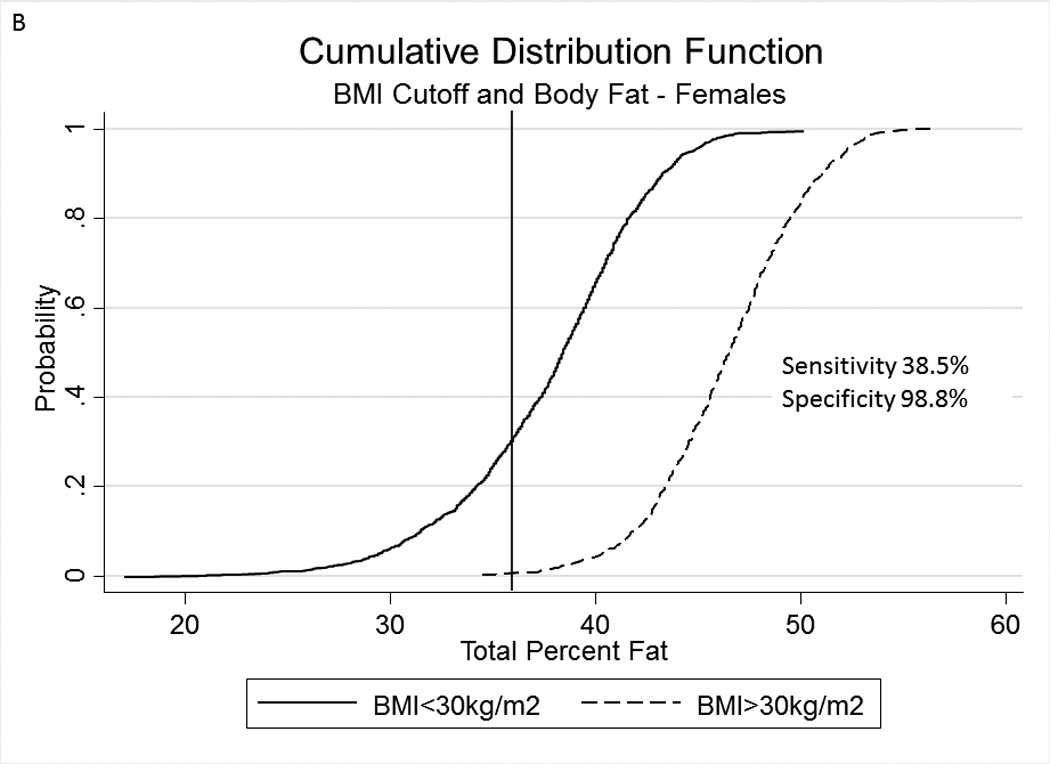
A, B Cumulative Distribution Functions of percent body fat in men (panel A) and females (panel B) in subjects with a body mass index ≥30kg/m2 and <30kg/m2. Vertical lines represent percent body fat cutoffs for males (25%) and females (35%).
Figure 4.
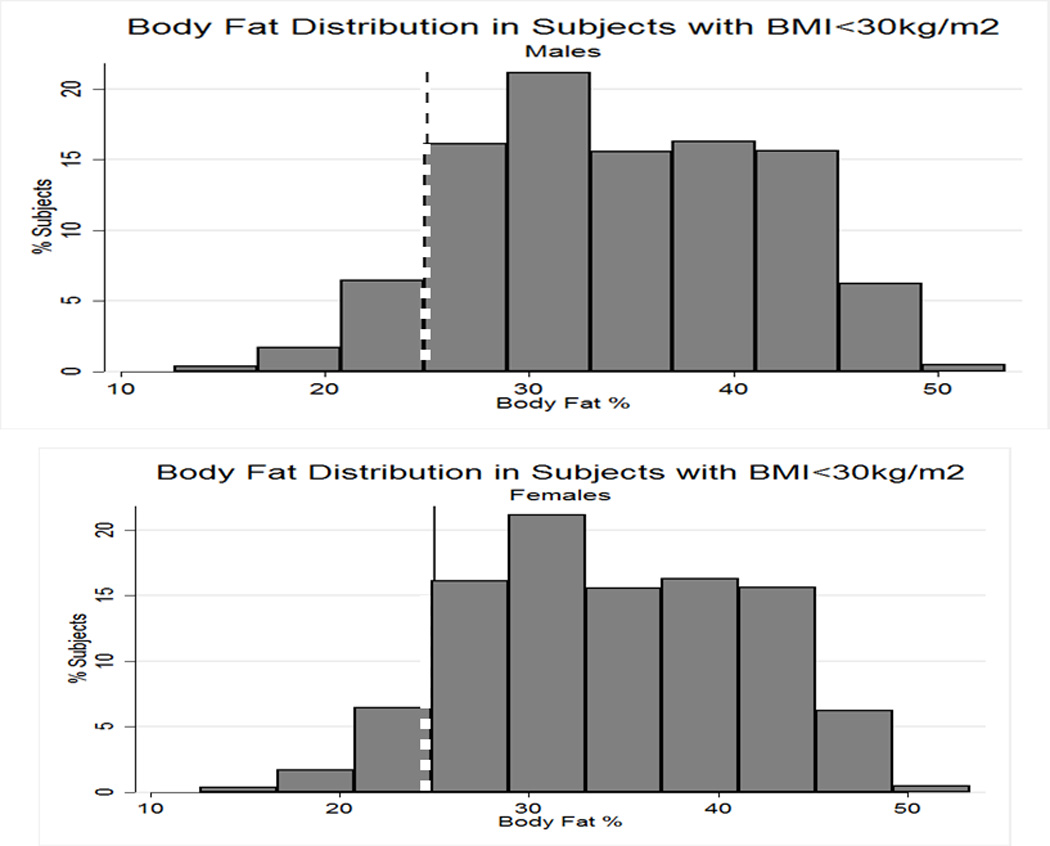
Variations in percent body fat in men (panel a) and females (panel B) in subjects with a body mass index <30kg/m2). Line represents body fat cutoffs for each sex (≥25% in men; ≥35% in females)
Table 4.
Adjusted Correlation Coefficients between BMI, BF% Lean Mass, and ASM by Sex and Age Group
| Men | BMI-BF% Adjusted ρ |
BMI-LM (kg) Adjusted ρ |
BMI-ASM (kg) Adjusted ρ |
WC-BF% Adjusted ρ |
WC-LM (kg) Adjusted ρ |
WC-ASM (kg) Adjusted ρ |
|---|---|---|---|---|---|---|
| ≥60 yearsa | 0.74* | 0.77* | 0.71* | 0.78* | 0.76* | 0.67* |
| 60–69.9year | 0.74* | 0.79* | 0.73* | 0.79* | 0.78* | 0.70* |
| 70–79.9years | 0.75* | 0.72* | 0.66* | 0.76* | 0.72* | 0.63* |
| 80+ years | 0.73* | 0.74* | 0.70* | 0.75* | 0.71* | 0.66* |
| Females | ||||||
| ≥60 yearsa | 0.76* | 0.79* | 0.76* | 0.69* | 0.77* | 0.72* |
| 60–69.9year | 0.78* | 0.81* | 0.79* | 0.71* | 0.81* | 0.75* |
| 70–79.9years | 0.75* | 0.76* | 0.74* | 0.68* | 0.81* | 0.69* |
| 80+ years | 0.74* | 0.75* | 0.71 | 0.68* | 0.73* | 0.64* |
Abbreviations: ASM – appendicular skeletal mass; BF – body fat; BMI – body mass index
P<0.001
additionally adjusted for age
DISCUSSION
Our study highlights the challenges with utilizing BMI as the most widely used and accepted method to diagnose obesity in clinical care setting, particularly in older adults. With the changes observed in body composition in this patient population, our data provides an opportunity to caution clinicians in solely relying on this anthropometric measure for counseling patients on reducing their weight and lowering their cardiovascular risk.
To our knowledge, this is the first analysis using nationally representative data to determine the diagnostic performance of BMI using DEXA as the gold standard and that focuses specifically on older adults. Previous studies using DEXA data from NHANES have focused on those with and without physical limitations12. These authors noted excellent specificity but poor sensitivity, in addition to considerable misclassification based on body fat percent. Flegal’s analysis using differing anthropometric indices, including BMI, WC, waist hip circumference, and waist to stature ratio, focused predominantly on correlation coefficients and agreement between metrics13, rather than focusing on diagnostic accuracy using our the methods utilized in this analysis. Our group has explored this relationship previously14 in a systematic review that demonstrated BMI≥30kg/m2 had an overall pooled sensitivity of 50% and specificity of 90%. A specific analysis that used bioelectrical impedance demonstrated the changes observed in diagnostic accuracy in the general population using similar cutoffs, albeit in a general population11. In this study, sensitivity of a BMI≥30kg/m2 for obesity peaked in the 40–49.9year age group at 44% in men, and in the 50–59.9years at 54% in females. This dropped to 27% and 43% in the 70–79year age group, respectively. Specificity remained high in both sexes (>90%), although negative predictive value dropped with age from 70% and 69% in males and females in the 20–29year age group, to 51% in both sexes in the 70–79year group. For all subjects, area under the curve was 0.88 with an ideal BMI of 25.5kg/m2 (sensitivity 83%, specificity 76%). However, BIA is highly inaccurate in older adults and can be influenced by food consumption, exercise, ethnicity and certain medical conditions. As body water content differs in older adults, this may also influence its precision and accuracy. Others have used body-plethysmography and have observed similar results15. DEXA-scanning does not have these limitations and has less bias than BIA16 and in older adults could be a better modality for the ascertainment of body fat. Our results are similar to others that have demonstrated the poor discrimination between body fat % in populations with coronary artery disease17. In an Australian study, one group suggested the importance of gender and age-specific thresholds when using BMI to indicate adiposity18. Notably, BMI is even inaccurate in assessing adiposity in pediatric populations19.
Our analysis proves that the diagnostic accuracy of BMI is markedly poor in both sexes with increased age, reflected by the lower concordance indices. The ideal cutpoint for BMI in this population-based cohort is ~25kg/m2 in both sexes, a cutoff markedly lower than the current criterion to diagnose obesity. A BMI of 25kg/m2 is associated with the lowest mortality point in a number of longitudinal studies. In fact, our results, coupled with those linking a BMI ~26–27kg/m2 with the lowest mortality, suggest that traditional BMI cutoffs are likely inaccurate and conceivably should be revisited. While the degree of correlation was satisfactory between BMI, body fat and measures of muscle mass, we believe that the interplay between muscle mass and fat is likely to not only impact the degree of functional capacity in older adults, but may obscure the adequacy of using BMI as a simple measure of adiposity. Additionally, the majority of subjects with a BMI>25kg/m2 have obesity based on body fat.
We believe that while BMI has its shortcomings, it still may be a useful measure to use. For instance, in older adults, previous studies have predicted a direct relationship between obesity, disability and mortality2, 20. Recent consensus statements from the Foundation for the National Institutes of Health Sarcopenia Project21 have indeed incorporated BMI in grip strength cutoffs for clinical identification of at risk subjects for weakness. However, its utility in clinical practice for obesity alone should be used with great caution informed by our study findings. Two major initiatives rely on BMI in an older adult population, including the Physician Quality reporting measures22, and the Medicare Obesity Benefit23. Our data proves the limitations of using this measure, but also demonstrate that the majority of older people in the United States population that have obesity based on body composition, may otherwise be classified as not having obesity based on a BMI<30kg/m25. We purposefully presented discordant cases in Table 3 to determine the difference in metabolic profiles in those with a non-obese BMI but different body fat composition. This subset analysis proves that subjects with obesity mischaracterized by BMI (BMI<30kg/m2) have differing metabolic profiles and there may be sex-specific differences based on central obesity. Additionally, there are certain populations where an elevated BMI may lead to improved outcomes, a phenomenon known as the obesity paradox24. Strongly encouraging the sole use of BMI in practice-based settings may target inappropriate populations or outcomes and other measures including WC should be considered. In older adults, adiposity localized centrally, and WC may be a possible alternative for adiposity assessment. While DEXA may be widely available for measurement of body composition, in the United States, it is not a reimbursable procedure for this indication and hence the need to consider alternative anthropometrics. Physical function and quality of life are important patient-specific outcomes in older adults and targeted outcomes of primary care obesity interventions in this population should alter the focus from weight or BMI to such measures as advocated by others23, 25.
As with any cross-sectional study, we acknowledge the intrinsic methodological limitations of NHANES. While there is oversampling of older adults, we are limited by the number of subjects in the older age categories. Additionally, our results can only be extrapolated to community-based adults, and not institutionalized adults. While body fat % is considered the gold standard in defining obesity, the cutoffs appear to be arbitrary. While other authors have repeatedly used these cutoffs and inadvertently referred to the 1995 WHO Technical Report26, there remains no scientific rationale for using such cutoffs other than expert opinion27–29. Future validation threshold studies by age, gender and race are critically needed.
A disadvantage of categorizing a continuous variable into categories is not only the loss of study power, but values slightly above the threshold may have only incremental and modest long-term risk, potentially resulting in overdiagnosis30. Misclassification is possible as well, and this has implications for public health in the identification and management of higher risk populations. While DEXA scanning is a reasonably inexpensive modality to routinely assess body composition, it is performed for unrelated clinical indications and not for this sole purpose. Future research and advocacy would provide more accurate assessments of obesity status, than present anthropometric measures. Its accuracy in older adults is superior to that of bioelectrical impedance, in that the latter may underestimate truncal obesity and is highly dependent on water content, making it suboptimal for use in older adults.
Our study confirms using DEXA-based body composition measures that BMI suboptimally identifies adiposity. While gold-standard methods such as CT and MRI may provide accurate whole-body and regional assessment of fat and muscle31, these are clinically impractical and costly for routine assessment. We suggest that accurate measurements of adiposity be considered using DEXA in older adults, particularly when this test is performed for other indications, such as osteoporosis screening or monitoring. This can eliminate the challenges observed with using BMI as a clinical tool and its lack of diagnostic accuracy. Future studies should evaluate the added cost-burden compared to the information that this modality can provide to a clinician.
Acknowledgments
Drs. Batsis & Mackenzie had full access to all the data in the study and takes responsibility for the integrity of the data and the accuracy of the data analysis.
Dr. Batsis – conception, design, acquisition, analysis, interpretation of data, drafted manuscript, statistical analysis, and material support, obtaining funding.
Dr. Mackenzie - conception, design, acquisition, analysis, interpretation of data, critical revision of the manuscript for important intellectual content, statistical analysis, and supervision
Dr. Bartels – conception, design, interpretation of data, critical revision of the manuscript for important intellectual content, administrative, technical or material support, supervision
Dr. Sahakyan – interpretation of data, critical revision of the manuscript for important intellectual content, administrative, technical or material support
Dr. Somers – interpretation of data, critical revision of the manuscript for important intellectual content, administrative, technical or material support, supervision
Dr. Lopez-Jimenez – conception, design, analysis, interpretation of data, critical revision of the manuscript for important intellectual content, administrative, technical or material support, supervision
Support was also provided by the Dartmouth Health Promotion and Disease Prevention Research Center supported by Cooperative Agreement Number U48DP005018 from the Centers for Disease Control and Prevention. The findings and conclusions in this journal article are those of the authors and do not necessarily represent the official position of the Centers for Disease Control and Prevention.
FINANCIAL DISCLOSURE
Dr. Batsis receives funding from Health Resources Services Administration (UB4HP19206-01-00) for medical geriatric teaching, the Junior Faculty Career Development Award, the Department of Medicine, Dartmouth-Hitchcock Medical Center, and the Dartmouth Centers for Health and Aging
Dr. Bartels receives funding from the National Institute of Mental Health (K12 HS0217695 (AHRQ), NIMH: T32 MH073553, R01 MH078052, R01 MH089811; R24 MH102794 CDC U48DP005018
Dr. Somers receives funding from NHLBI: R01 HL114676-02; R01 HL114024-03; R01 HL065176-12
Dr. Lopez-Jimenez: n/a
Dr. Mackenzie/Sahakyan: n/a
Footnotes
Work to be presented at the 2015 Gerontological Society of America Conference, Orlando, Florida
There are no conflicts of interest pertaining to this manuscript
Supplementary information is available at IJO’s website.
REFERENCES
- 1.Ogden CL, Carroll MD, Kit BK, Flegal KM. Prevalence of childhood and adult obesity in the United States, 2011–2012. JAMA. 2014;311(8):806–814. doi: 10.1001/jama.2014.732. [DOI] [PMC free article] [PubMed] [Google Scholar]
- 2.Flegal KM, Graubard BI, Williamson DF, Gail MH. Excess deaths associated with underweight, overweight, and obesity. JAMA. 2005;293(15):1861–1867. doi: 10.1001/jama.293.15.1861. [DOI] [PubMed] [Google Scholar]
- 3.Gregg EW, Cheng YJ, Cadwell BL, Imperatore G, Williams DE, Flegal KM, et al. Secular trends in cardiovascular disease risk factors according to body mass index in US adults. JAMA. 2005;293(15):1868–1874. doi: 10.1001/jama.293.15.1868. [DOI] [PubMed] [Google Scholar]
- 4.Jensen MD, Ryan DH, Apovian CM, Ard JD, Comuzzie AG, Donato KA, et al. 2013 AHA/ACC/TOS Guideline for the Management of Overweight and Obesity in Adults: A Report of the American College of Cardiology/American Heart Association Task Force on Practice Guidelines and The Obesity Society. Circulation. 2013 [Google Scholar]
- 5.Batsis JA, Sahakyan KR, Rodriguez-Escudero JP, Bartels SJ, Somers VK, Lopez-Jimenez F. Normal weight obesity and mortality in United States subjects >/=60 years of age (from the Third National Health and Nutrition Examination Survey) Am J Cardiol. 2013;112(10):1592–1598. doi: 10.1016/j.amjcard.2013.07.014. [DOI] [PubMed] [Google Scholar]
- 6.Batsis JA, Singh S, Lopez-Jimenez F. Anthropometric measurements and survival in older americans: results from the third national health and nutrition examination survey. J Nutr Health Aging. 2014;18(2):123–130. doi: 10.1007/s12603-013-0366-3. [DOI] [PubMed] [Google Scholar]
- 7.Gallagher D, Visser M, Sepulveda D, Pierson RN, Harris T, Heymsfield SB. How useful is body mass index for comparison of body fatness across age, sex, and ethnic groups? Am J Epidemiol. 1996;143(3):228–239. doi: 10.1093/oxfordjournals.aje.a008733. [DOI] [PubMed] [Google Scholar]
- 8.Perloff D, Grim C, Flack J, Frohlich ED, Hill M, McDonald M, et al. Human blood pressure determination by sphygmomanometry. Circulation. 1993;88(5 Pt 1):2460–2470. doi: 10.1161/01.cir.88.5.2460. [DOI] [PubMed] [Google Scholar]
- 9.Matthews DR, Hosker JP, Rudenski AS, Naylor BA, Treacher DF, Turner RC. Homeostasis model assessment: insulin resistance and beta-cell function from fasting plasma glucose and insulin concentrations in man. Diabetologia. 1985;28(7):412–419. doi: 10.1007/BF00280883. [DOI] [PubMed] [Google Scholar]
- 10.Dickey R, Bartuska C, Bray G, Callaway W, Davidson EFS, et al. AACE/ACE Position statement on the prevention, diagnosis, and treatment of obesity (1998 revision) Endocrine Practice. 1998;4(5):300. [Google Scholar]
- 11.Romero-Corral A, Somers VK, Sierra-Johnson J, Thomas RJ, Collazo-Clavell ML, Korinek J, et al. Accuracy of body mass index in diagnosing obesity in the adult general population. Int J Obes (Lond) 2008;32(6):959–966. doi: 10.1038/ijo.2008.11. [DOI] [PMC free article] [PubMed] [Google Scholar]
- 12.Peterson MD, Al Snih S, Stoddard J, Shekar A, Hurvitz EA. Obesity misclassification and the metabolic syndrome in adults with functional mobility impairments: Nutrition Examination Survey 2003–2006. Prev Med. 2014;60:71–76. doi: 10.1016/j.ypmed.2013.12.014. [DOI] [PMC free article] [PubMed] [Google Scholar]
- 13.Flegal KM, Shepherd JA, Looker AC, Graubard BI, Borrud LG, Ogden CL, et al. Comparisons of percentage body fat, body mass index, waist circumference, and waist-stature ratio in adults. Am J Clin Nutr. 2009;89(2):500–508. doi: 10.3945/ajcn.2008.26847. [DOI] [PMC free article] [PubMed] [Google Scholar]
- 14.Okorodudu DO, Jumean MF, Montori VM, Romero-Corral A, Somers VK, Erwin PJ, et al. Diagnostic performance of body mass index to identify obesity as defined by body adiposity: a systematic review and meta-analysis. Int J Obes (Lond) 2010;34(5):791–799. doi: 10.1038/ijo.2010.5. [DOI] [PubMed] [Google Scholar]
- 15.Gomez-Ambrosi J, Silva C, Galofre JC, Escalada J, Santos S, Millan D, et al. Body mass index classification misses subjects with increased cardiometabolic risk factors related to elevated adiposity. Int J Obes (Lond) 2012;36(2):286–294. doi: 10.1038/ijo.2011.100. [DOI] [PubMed] [Google Scholar]
- 16.Pateyjohns IR, Brinkworth GD, Buckley JD, Noakes M, Clifton PM. Comparison of three bioelectrical impedance methods with DXA in overweight and obese men. Obesity (Silver Spring) 2006;14(11):2064–2070. doi: 10.1038/oby.2006.241. [DOI] [PubMed] [Google Scholar]
- 17.Romero-Corral A, Somers VK, Sierra-Johnson J, Korenfeld Y, Boarin S, Korinek J, et al. Normal weight obesity: a risk factor for cardiometabolic dysregulation and cardiovascular mortality. Eur Heart J. 2010;31(6):737–746. doi: 10.1093/eurheartj/ehp487. [DOI] [PMC free article] [PubMed] [Google Scholar]
- 18.Pasco JA, Nicholson GC, Brennan SL, Kotowicz MA. Prevalence of obesity and the relationship between the body mass index and body fat: cross-sectional, population-based data. PLoS One. 2012;7(1):e29580. doi: 10.1371/journal.pone.0029580. [DOI] [PMC free article] [PubMed] [Google Scholar]
- 19.Taylor RW, Jones IE, Williams SM, Goulding A. Body fat percentages measured by dual-energy X-ray absorptiometry corresponding to recently recommended body mass index cutoffs for overweight and obesity in children and adolescents aged 3–18 y. Am J Clin Nutr. 2002;76(6):1416–1421. doi: 10.1093/ajcn/76.6.1416. [DOI] [PubMed] [Google Scholar]
- 20.Schaap LA, Koster A, Visser M. Adiposity, Muscle Mass, and Muscle Strength in Relation to Functional Decline in Older Persons. Epidemiol Rev. 2012 doi: 10.1093/epirev/mxs006. [DOI] [PubMed] [Google Scholar]
- 21.Studenski SA, Peters KW, Alley DE, Cawthon PM, McLean RR, Harris TB, et al. The FNIH sarcopenia project: rationale, study description, conference recommendations, and final estimates. J Gerontol A Biol Sci Med Sci. 2014;69(5):547–558. doi: 10.1093/gerona/glu010. [DOI] [PMC free article] [PubMed] [Google Scholar]
- 22.Services CfMM, editor. PQRS Measures Codes, Centers for Medicare & Medicaid Services. Centers for Medicare & Medicaid Services; 2015. [Google Scholar]
- 23.Batsis JA, Huyck KL, Bartels SJ. Challenges with the Medicare obesity benefit: practical concerns & proposed solutions. J Gen Intern Med. 2015;30(1):118–122. doi: 10.1007/s11606-014-3031-6. [DOI] [PMC free article] [PubMed] [Google Scholar]
- 24.McAuley PA, Artero EG, Sui X, Lee DC, Church TS, Lavie CJ, et al. The obesity paradox, cardiorespiratory fitness, and coronary heart disease. Mayo Clin Proc. 2012;87(5):443–451. doi: 10.1016/j.mayocp.2012.01.013. [DOI] [PMC free article] [PubMed] [Google Scholar]
- 25.Villareal DT, Apovian CM, Kushner RF, Klein S American Society for N, Naaso TOS. Obesity in older adults: technical review and position statement of the American Society for Nutrition and NAASO, The Obesity Society. Obes Res. 2005;13(11):1849–1863. doi: 10.1038/oby.2005.228. [DOI] [PubMed] [Google Scholar]
- 26.Physical status: the use and interpretation of anthropometry. Report of a WHO Expert Committee. World Health Organ Tech Rep Ser. 1995;854:1–452. [PubMed] [Google Scholar]
- 27.Grundy SM. Obesity, metabolic syndrome, and cardiovascular disease. J Clin Endocrinol Metab. 2004;89(6):2595–2600. doi: 10.1210/jc.2004-0372. [DOI] [PubMed] [Google Scholar]
- 28.Lavie CJ, Milani RV, Ventura HO, Romero-Corral A. Body composition and heart failure prevalence and prognosis: getting to the fat of the matter in the "obesity paradox". Mayo Clin Proc. 2010;85(7):605–608. doi: 10.4065/mcp.2010.0333. [DOI] [PMC free article] [PubMed] [Google Scholar]
- 29.Oreopoulos A, Ezekowitz JA, McAlister FA, Kalantar-Zadeh K, Fonarow GC, Norris CM, et al. Association between direct measures of body composition and prognostic factors in chronic heart failure. Mayo Clin Proc. 2010;85(7):609–617. doi: 10.4065/mcp.2010.0103. [DOI] [PMC free article] [PubMed] [Google Scholar]
- 30.Batsis JA, Lopez-Jimenez F. Cardiovascular risk assessment--from individual risk prediction to estimation of global risk and change in risk in the population. BMC Med. 2010;8:29. doi: 10.1186/1741-7015-8-29. [DOI] [PMC free article] [PubMed] [Google Scholar]
- 31.Cruz-Jentoft AJ, Baeyens JP, Bauer JM, Boirie Y, Cederholm T, Landi F, et al. Sarcopenia: European consensus on definition and diagnosis. Age and Ageing. 2010;39(4):412–423. doi: 10.1093/ageing/afq034. [DOI] [PMC free article] [PubMed] [Google Scholar]


