Abstract
Increases in the acoustic startle response (ASR) of animals have been reported following experimental manipulations to induce tinnitus, an auditory disorder defined by phantom perception of sound. The increases in ASR have been proposed to signify the development of hyperacusis, a clinical condition defined by intolerance of normally tolerable sound levels. To test this proposal, the present study compared ASR amplitude to measures of sound-level tolerance (SLT) in humans, the only species in which SLT can be directly assessed. Participants had clinically normal/near-normal hearing thresholds, were free of psychotropic medications, and comprised people with tinnitus and without. ASR was measured as eyeblink-related electromyographic activity in response to a noise pulse presented at a range of levels and in two background conditions (noise and quiet). SLT was measured as loudness discomfort level (LDL), the lowest level of sound deemed uncomfortable, and via a questionnaire on the loudness of sounds in everyday life. Regardless of tinnitus status, ASR amplitude at a given stimulus level increased with decreasing LDL, but showed no relationship to SLT self-reported via the questionnaire. These relationships (or lack thereof) could not be attributed to hearing threshold, age, anxiety, or depression. The results imply that increases in ASR in the animal work signify decreases in LDL specifically and may not correspond to the development of hyperacusis as would be self-reported by a clinic patient.
Keywords: acoustic reflex, sound-level tolerance, hyperacusis
INTRODUCTION
The acoustic startle response (ASR) is muscular activity produced reflexively in response to a sudden loud sound. The ASR is evolutionarily conserved across mammals (Braff et al. 2001) but is measured in various ways, depending on the species. In non-human animals, it is typically quantified by means of the whole-body response to a brief high-level sound pulse, whereas in humans it is commonly measured by the strength of the eyeblink response to the sound pulse. The ASR and measurement paradigms based on the ASR (such as those measuring prepulse inhibition) have been a mainstay of studies on a range of brain-based disorders in human and non-human animals (e.g., Geyer and Braff 1987; Davis et al. 1993; Grillon et al. 1996; Grillon 2002; Meincke et al. 2004; Ludewig et al. 2005; Gallo et al. 2008; Madsen et al. 2014). In the auditory field, increased ASR amplitude has been hypothesized to be a marker of hyperacusis (Ison et al. 2007; Turner and Parrish 2008; Sun et al. 2009, 2012; Chen et al. 2013; Hickox and Liberman 2014; Salloum et al. 2014), that is, diminished tolerance of moderate to high-level sounds (Anari et al. 1999; Baguley 2003; Schecklmann et al. 2014). This hypothesis arises from work in rodents showing increases in ASR following systemic salicylate administration or excessive exposure to sound (Ison et al. 2007; Turner and Parrish 2008; Sun et al. 2009; Chen et al. 2013; Hickox and Liberman 2014). As yet, there has been no direct test of the hypothesized relationship between ASR amplitude and hyperacusis. However, it is a test well-worth performing as it would establish whether or not ASR amplitude can be used as an objective read-out of hyperacusis in animals unable to report their tolerance of sound and in clinical trials of interventions aimed at reversing hyperacusis in patients suffering from the condition.
While there has been no direct and controlled examination of the ASR in relation to behaviorally verified hyperacusis, there are related studies in the literature on tinnitus, a condition defined by phantom perception of sound that often occurs along with hyperacusis (Anari et al. 1999; Baguley 2003). Specifically, Fournier and Hébert (2013) reported generally greater ASR amplitude in people with tinnitus compared to control subjects without tinnitus. In a separate report, the same team found reduced loudness discomfort levels (LDL), a behavioral indication of reduced sound tolerance, in tinnitus subjects compared to controls (Hébert et al. 2013). Taken together, the ASR and LDL studies are consistent with a relationship between increased ASR amplitude and reduced sound tolerance as measured by LDL. On the other hand, the ASR elevations reported by Fournier and Hébert could have instead been related to tinnitus, or possibly greater anxiety among those with tinnitus, as pointed out by the investigators. Furthermore, even if elevated ASR amplitude corresponded to reduced LDL, it is unknown whether it also corresponded to self-recognized reductions in sound tolerance based on daily life experience. LDL and self-reported sound tolerance are not necessarily correlated, so one cannot be assumed to predict the other (Filion and Margolis 1992; Anari et al. 1999).
The present study, in humans, directly compared the ASR to sound tolerance assessed via two measures: LDL and self-report via a brief inventory. The wording of the inventory was designed to assess tolerance deriving from the level of sound (loudness hyperacusis in the terminology of Tyler et al. 2014), as opposed to other sound characteristics, or other forms of hyperacusis: fear of sound (phonophobia or fear hyperacusis), or dislike of sound (misophonia or annoyance hyperacusis; Baguley 2003; Tyler et al. 2014). Thus, both sound-tolerance measures (LDL and self-report) were directed at measuring what our group has previously termed “sound-level tolerance” (SLT; e.g., Gu et al. 2010). To enable any relationships between ASR and SLT to be decoupled from relationships between ASR and tinnitus, there were two participant groups, one with tinnitus and one without, each comprising people with different (overlapping) degrees of SLT. Testing included a battery of psychological and other inventories, so effects of anxiety and other non-auditory factors potentially related to ASR amplitude could be removed from the comparisons of ASR and SLT.
METHODS
Participants and Assessments
The present report is based on 52 participants (34 men; 34–63 years; 23 with tinnitus) recruited for this study by means of advertisements and through Massachusetts Eye & Ear Infirmary clinics. Informed consent was obtained prior to participation. The study was approved by the Human Studies Committee of the Massachusetts Eye & Ear Infirmary. People reporting current use of psychotropic medications or supplements (including benzodiazepines, antidepressants, stimulants, anti-seizure medications) were excluded because of possible effects on the ASR (see Davis et al. 1993 for review).
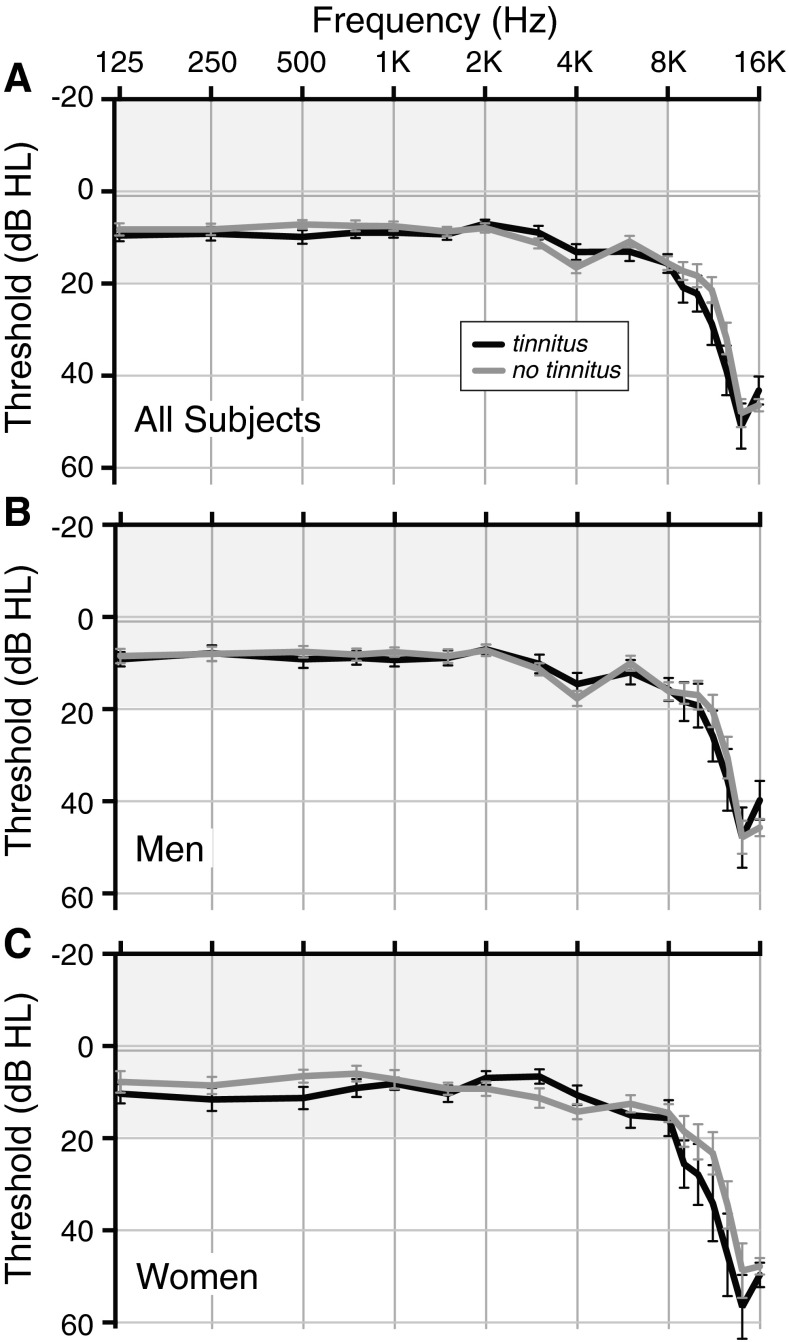
All participants had clinically normal to near-normal audiograms: 36 of the 52 had thresholds ≤ 25 dB HL at octave intervals from 250 to 8000 Hz in both ears, while the remaining 16 participants met the same criteria, except for thresholds of 30 or 35, and in one case 40, dB at either 4000 or 8000 Hz in one or both ears. Mean audiograms for participants, divided according to tinnitus status and sex, are shown in Figure 1A.
FIG. 1.
Mean audiograms for subjects with tinnitus (black) and without (gray). A All participants in session 1. B Men only. C Women only. Gray shading indicates the range of clinically normal hearing over the frequency range of standard clinical testing. Error bars indicate ± one SEM.
Testing Sessions
Participants were invited for two test sessions both involving behavioral measurements, questionnaire evaluations, and ASR testing. The behavioral and questionnaire data are given in Tables 1 and 2.
TABLE 1.
Subject characteristics
| Subject | Age | Handedness | Noise LDLa (dB SPL) | 500-Hz LDLa (dB SPL) | SLTQb (range: 0–1) | State Anxiety (max = 80) | Trait Anxiety (max = 80) | Depression (max = 84) |
|---|---|---|---|---|---|---|---|---|
| No Tinnitus, men | ||||||||
| 8 | 50 | R | 101 | 104 | 1.00 | 24 | 28 | 4 |
| 191 | 42 | R | 110 | 114 | 1.00 | 20 | 21 | 2 |
| 335 | 44 | R | >116 | >126 | 0.93 | 32 | 30 | 2 |
| 338 | 46 | R | 91 | 96 | 1.00 | 20 | 28 | 0 |
| 340 | 38 | R | 95 | 102 | 0.65 | 34 | 48 | 16 |
| 344 | 38 | L | >116 | 111 | 0.93 | 30 | 32 | 11 |
| 348 | 41 | L | 114.8 | >126 | 0.98 | 20 | 25 | 6 |
| 349 | 47 | R | >116 | 117 | 0.83 | 31 | 40 | 11 |
| 386 | 54 | L | >116 | >126 | 0.78 | 23 | 22 | 16 |
| 397 | 51 | R | 106 | >120 | 0.63 | 24 | 35 | 17 |
| 402 | 53 | L | >115 | 117 | 0.77 | 20 | 31 | 5 |
| 403 | 50 | R | 93.5 | 92 | 0.12 | 33 | 35 | 22 |
| 404 | 36 | R | 95 | 97 | 0.38 | 33 | 34 | 14 |
| 409 | 43 | R | >116 | 125 | 0.70 | 35 | 35 | 12 |
| 413 | 52 | R | 95 | 107 | 0.07 | 20 | 21 | 11 |
| 421 | 44 | L | 108.5 | 102 | 0.60 | 22 | 30 | 2 |
| 435 | 40 | L | 95 | 96 | 1.00 | 23 | 26 | 2 |
| 439 | 44 | L | 91 | 107 | 1.00 | 26 | 32 | 14 |
| 440 | 53 | L | 110 | 121 | 0.98 | 30 | 38 | 18 |
| No tinnitus, women | ||||||||
| 341 | 42 | R | >116 | >126 | 0.99 | 21 | 22 | 1 |
| 350 | 52 | R | 91 | 99 | 0.70 | 20 | 20 | 7 |
| 353 | 36 | R | 96 | 97 | 1.00 | 30 | 30 | 6 |
| 380 | 52 | R | 107 | 121 | 0.67 | 23 | 22 | 2 |
| 389 | 47 | R | 115 | >124 | 1.00 | 24 | 28 | 0 |
| 391 | 49 | R | 108.5 | 121 | 0.67 | 23 | 21 | 7 |
| 394 | 55 | R | 108.5 | 97 | 1.00 | 23 | 22 | 2 |
| 395 | 55 | R | 111 | 116 | 1.00 | 20 | 22 | 11 |
| 415 | 47 | R | 92 | 97 | 0.33 | 50 | 52 | 6 |
| 420 | 38 | R | 97 | 100 | 0.73 | 20 | 23 | 3 |
| Tinnitus, men | ||||||||
| 299 | 36 | R | 113.5 | 126 | 0.43 | 21 | 34 | 8 |
| 301 | 35 | R | 66 | 97 | 0.43 | – | 29c | 9c |
| 322 | 41 | R | 107.3 | 103.5 | 0.77 | 22 | 36 | 3 |
| 328 | 52 | L | 68.5 | 87 | 0.67 | – | 30c | 3c |
| 347 | 34 | R | 76 | 76 | 0.63 | – | 34c | 6c |
| 360 | 59 | L | 111 | >126 | 0.83 | 29 | 27 | 8 |
| 361 | 61 | R | 91 | 116 | 0.50 | 27 | 49 | 32 |
| 366 | 49 | R | 112 | >125 | 1.00 | 25 | 43 | 11 |
| 369 | 40 | R | >116 | >126 | 1.00 | 30 | 38 | 7.5 |
| 370 | 51 | – | 100 | 105 | 0.57 | – | – | – |
| 372 | 58 | R | 110 | >126 | 0.42 | 26 | 41 | 15 |
| 373 | 58 | R | 103.5 | >126 | 0.67 | – | 22c | 4c |
| 378 | 43 | R | 95 | 101 | 0.95 | 27 | 50 | 23 |
| 381 | 34 | R | 116 | 115 | 0.57 | – | 30c | 11c |
| 427 | 43 | L | 111 | >125 | 0.43 | 24 | 30 | 7 |
| Tinnitus, women | ||||||||
| 321 | 49 | R | 88.5 | 89 | 0.50 | 32 | 39 | 12 |
| 354 | 37 | R | 103.5 | >125 | 0.80 | 20 | 32 | 15 |
| 356 | 54 | R | 80 | 77 | 0.78 | 20 | 31 | 15 |
| 364 | 63 | R | 103.5 | 115 | 0.83 | 23 | 25 | 8 |
| 377 | 45 | R | >115 | >126 | 0.27 | 30 | 38 | 19 |
| 379 | 62 | R | >116 | 120 | 1.00 | 30 | 34 | 6 |
| 424 | 54 | R | 92 | 92 | 0.50 | 22 | 24 | 6 |
| 431 | 41 | R | 112 | 124 | 0.97 | 22 | 26 | 15 |
–not available
aAverage of left ear and right ear LDLs. “>” indicates that the value contributed to the average by one or both ears was a lower bound on LDL
bScore from session 1
cDepression and trait anxiety scores are from a visit for a different study within 6 weeks of Session 1
TABLE 2.
Tinnitus characteristics
| Subject | Tinnitus duration (years) | Tinnitus location | Tinnitus quality | Somatic modulation | Tinnitus Pitch L, R (kHz) | Tinnitus Loudness L, R (dB SL) | Minimum Masking Level (dB SL) | Tinnitus Handicap Inventory: in last week (max = 100) | Tinnitus Handicap Inventory: ever (max = 100) | Residual Inhibition |
|---|---|---|---|---|---|---|---|---|---|---|
| Men | ||||||||||
| 299 | ~10 | Both ears, equally | Ringing | Yes | 10, 1.5 | 30, 25 | 35 | 0 | 6 | No |
| 301 | 17 | Both ears, R worse | Buzzing, ringing | – | – | – | – | – | – | – |
| 322 | 20 | R ear, occasional L eara | Ringing, tonal | Yes | –,10.7 | –, 15 | 70 | 0 | 10 | No |
| 328 | 2 | Both ears, equally and in head | Hissing, ringing, whooshing | Yes | – | – | – | 6 | 31 | – |
| 347 | ~15 | Intermittantb, both ears, R worse | Ringing | – | – | – | – | 0 | 16 | – |
| 360 | 5 | Both ears, equally | Ringing | Yes | 8, 11.2 | 10, 0 | 35 | 2 | 7 | Yes |
| 361 | ~7 | L ear | Cricket-like, hissing, tonal, whooshing | Yes | 8, − | 10, − | 65 | 40 | 42 | – |
| 366 | 27 | Both ears, R worse | Hissing, humming, pulsing, ringing, whistling | Yes | 14, 13 | 25, 20 | 35 | 0 | 40 | No |
| 369 | 0.25 | In head, not strongly to either side | Ringing | – | 1.5, 1.5 | 35, 40 | 35 | 10 | 7 | Yes |
| 370 | 1 | Both ears, equally | Hissing | – | – | – | – | – | – | – |
| 372 | 20 | R ear, occasional L eara | Tonal | – | –, 1.5 | –, 25 | 35 | 6 | 12 | Yes |
| 373 | 6 | R ear | Ringing | Yes | –, 12.5 | –, 30 | 85 | 4 | 12 | – |
| 378 | 0.5 | Both ears, equally | Hissing | – | 9.5, 12.5 | 5, 15 | 55 | 0 | 8 | No |
| 381 | <1 | Both ears, L worse | Buzzing, humming | – | 0.125, 0.25 | 10, 15 | 15 | – | 60 | No |
| 427 | ~0.5 | Both ears, equally | Ringing, whistling | – | 6, 6 | 5, 15 | 50 | 4 | 13 | No |
| Women | ||||||||||
| 321 | 1.5 | Both ears, equallyb | Ringing | – | – | – | – | 2 | 6 | – |
| 354 | 0.5 | Both ears, equally | Tonal | – | 8, 8 | 20, 25 | 25 | 5 | 16 | No |
| 356 | >42 | Both ears, R worse | Steam whistle | – | 10, 11.2 | 15, 10 | 35 | 6 | 24 | No |
| 364 | 0.1 | Both ears, R worse | Humming | – | –, 11.2 | –, 15 | 35 | 0 | 2 | Yes |
| 377 | 4 | Both ears equally, and in head | Pulsing, roaring, rushing, ringing, whooshing | Yes | 4, 4 | 50, 60 | 70 | 27 | 47 | No |
| 379 | 1.5 | L ear, occasional R earc | Pulsing, roaring, rushing, whooshing | – | 8, − | 10, − | 30 | 0 | 10 | Yes |
| 424 | “As long as I can remember” | Both ears, R worse | Buzzing, cricket-like | – | 8, 8 | 20, 25 | >65 | 9 | 10 | – |
| 431 | 8.5 | R ear | Tonal | – | –, 1.5 | –, 15 | 20 | 3 | 6 | Yes |
–Not available or not applicable
aSubject has occasional left-ear tinnitus that was not heard during testing
bSubject’s tinnitus is intermittent and not experienced during testing
cSubject has occasional right-ear tinnitus that was not heard during testing
In session 1: (1) Pure-tone thresholds were obtained with an Interacoustics AC40 audiometer and TDH-39P headphones at half-octave intervals from 125 to 8000 Hz, and with Sennheiser HDA200 headphones at 9, 10, 11.2, 12.5, 14, and 16 kHz. (2) Loudness discomfort levels (LDL) were measured (described below under “Measures of Sound-Level Tolerance: Loudness Discomfort Level”). (3) Participants completed questionnaires assessing SLT (Tyler et al. 2003), medications and supplements and, for those with tinnitus, a questionnaire on tinnitus perceptual characteristics and history. (4) ASR measurements were collected in two conditions used in the animal literature: continuous background noise and quiet (described under “Acoustic Startle Reflex Measurement”). The continuous noise condition is standard in the human ASR literature (Blumenthal et al. 2005; Swerdlow et al. 2007).
In session 2: (1) For participants with tinnitus, measurements were made of tinnitus loudness and pitch, minimum masking level with broadband noise, and residual inhibition of tinnitus after broadband noise. (2) Questionnaires were completed to assess: SLT (again), depression (Inventory of Depressive Symptomatology, Rush et al. 1996), anxiety (Spielberger 1983), medications, and supplements (again). Participants with tinnitus also completed the tinnitus handicap inventory (THI, Newman et al. 1996). (3) The ASR was measured in continuous background noise.
A majority of participants provided data for session 2 as well as session 1, but 10 did not. Reasons for the lack of session 2 data are as follows: (1) the ASR stimuli were too aversive for two participants (301 and 347); (2) two (373, 381), not on psychotropic medications for session 1, were taking them in session 2, so the session 2 data were excluded; (3) the session 2 ASR data were too noisy to use (403), (4) an initial version of the session 2 protocol was used that was subsequently revised (340, 353, 321); and (4) the participant did not return for unknown reasons (328, 370).
Because the ASR is sensitive to cortisol levels, which follow a circadian cycle (Miller and Gronfier 2006), all testing took place at a similar time of day: during the afternoon or early evening when cortisol levels tend to be lowest, resulting in a higher ASR.
Measures of Sound-Level Tolerance: Loudness Discomfort Level
Loudness discomfort level (LDL) for both broadband noise and a 500-Hz warble tone were measured for each ear as follows (Cox et al. 1997; Gu et al. 2010). Monaural noise (or monaural 500-Hz warble tone) was presented for about 2 s per stimulus over headphones at progressively higher levels in 5-dB steps beginning at approximately 15 dB above threshold (5 dB above threshold for the 500-Hz warble tone). For each level, subjects rated (that is, reported orally) the perceived loudness on a scale from 1 (very soft) to 7 (uncomfortably loud). Four consecutive runs were completed for each ear, and each run was terminated when the subject reached a 7, or a maximum tested level of 117 dB SPL (126 dB SPL for the 500-Hz warble tone), whichever came first. Average sound level at 7 for the last two runs was the LDL for the stimulated ear in dB SPL (Table 1). If the subject did not reach 7, a lower bound on the LDL was the average of the highest level reached for the last two runs. Finally, LDL (or lower bound) for the ears was averaged to give the LDL values in Table 1 and used in analyses of the ASR.
Measures of SLT: Sound-Level Tolerance Questionnaire
The sound-level tolerance (SLT) questionnaire (SLTQ) asked subjects to rate agreement with the following statements about sound perception in everyday life: (1) Many everyday sounds are unbearably loud to me; (2) Sounds that others believe are moderately loud are too loud for me; (3) I hear very soft sounds that others with normal hearing do not hear. Ratings were averaged across statements and normalized to yield an SLTQ score between 0 (low tolerance) and 1 (high tolerance).
Acoustic Startle Reflex Measurement
The acoustic startle reflex (ASR) was measured in each subject by means of a commercial setup (SR-HLab, San Diego Instruments, San Diego, CA), which included hardware and software to both produce and deliver the acoustic stimulus, and record the electromyogram (EMG) of the eyeblink response. During measurement of the acoustic startle reflex (ASR), subjects were seated in a sound-attenuated booth. Silver chloride electrodes coated with a layer of conductive electrode gel (Parker SignaGel) were applied to the skin by means of adhesive electrode washers (Grass Technologies) after the skin was cleaned with water. Two EMG recording electrodes were positioned under the left eye on the skin over the orbicularis oculi muscle, about 1–2 cm apart, as recommended by Blumenthal et al. (2005). A third electrode that served as the signal ground was attached to the middle of the forehead. The electrode wires were loosely bound together to help cancel noise artifacts. The EMG signal for natural eyeblinks was visually and qualitatively assessed via the software interface for a good signal-to-noise ratio before starting the ASR measurements.
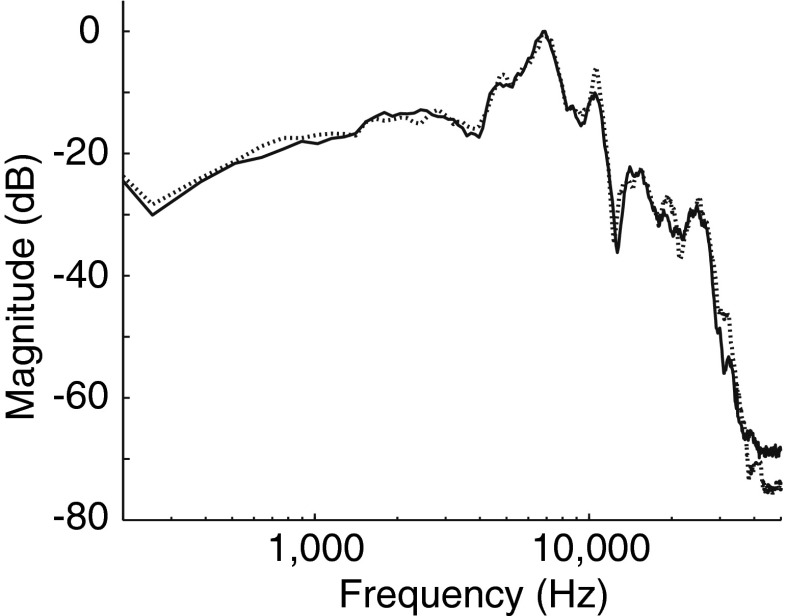
Subjects listened to six consecutive runs, each comprising a 2-min acclimation period followed by a series of ASR stimuli presented at ascending sound levels in 5-dB steps and separated by 11–19 s. The ASR stimuli were 40-ms pulses of broadband noise delivered binaurally (stimulus spectra in Fig. 2). During the first three runs, a continuous background of binaural broadband noise (70 dB SPL after A-weighting) underlay both the acclimation period and the ASR stimuli (background noise condition). These runs were followed by three more runs without background noise (quiet condition; session 1 only). The intensity of the pulses ranged from 75 to 110 dB SPL (after A-weighting) for runs in the noise background and 50–110 dB SPL (after A-weighting) in the quiet background. Having subjects rate the loudness of each ASR stimulus (as described previously for LDL measurement) ensured that they remained awake and moreover ensured that no subject was exposed to a sound level above their tolerance limit: A run was terminated if the subject rated a pulse “uncomfortably loud.” Subjects were asked to remain still and as relaxed as possible during the measurements, with their gaze centered on a copy of the loudness rating scale that was attached to the wall of the booth at about eye level. All sound stimuli (ASR stimuli and background noise during the noise condition) were presented through Sony MDR-V6 headphones.
FIG. 2.
Spectrum of the noise gated by a 40-ms pulse to form ASR stimuli and presented continuously during the noise background condition. The output of the Sony MDR-V6 headphones used for ASR stimulus and background noise delivery was measured using an artificial ear (Larson Davis). The Fourier transform of the right and left headphone outputs (A-weighted) is plotted with solid and dotted lines, respectively. Magnitude is in dB re maximum.
ASR Quantification
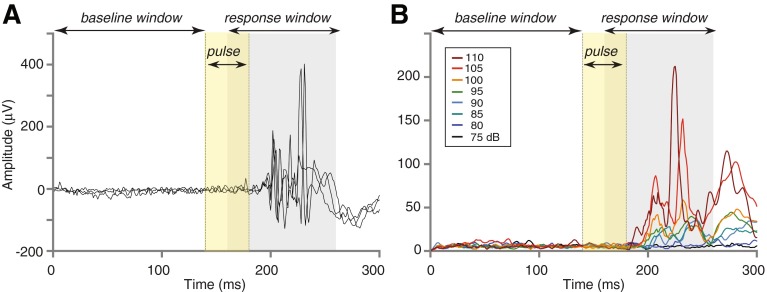
The EMG recordings were first visually inspected for spontaneous eyeblink activity during the 140-ms baseline preceding ASR stimulus onset. Recordings free of baseline eyeblink activity were rectified and then smoothed by a moving average with a 6-ms window. ASR amplitude was computed as a difference: the root-mean square of the 100-ms interval beginning 20 ms after ASR stimulus onset (response window in Fig. 3) and the root-mean-square of the 140-ms baseline preceding the ASR stimulus (baseline window). Amplitudes for trials with the same stimulus level and background condition were then averaged across runs. ASR threshold was defined as the lower of the first two consecutive levels where ASR amplitude ≥5 μV in the level series. If ASR amplitude only reached 5 μV at the highest tested level, that level served as the ASR threshold. In some individuals, ASR amplitude never reached 5 μV even at the highest stimulus level, so ASR threshold was unknown, and the highest stimulus level served as the lower bound.
FIG. 3.
Representative ASR in one subject (322). A Three trials of the raw EMG produced by an ASR stimulus lasting 40 ms and embedded in continuous background noise. ASR stimulus level: 105 dB SPL after A-weighting. B ASR at eight stimulus levels after averaging the raw EMG across trials, rectifying, and smoothing. ASR amplitude at each level was calculated as the root-mean-square over a 100-ms response window (gray shading) minus the root-mean-square over a 140-ms pre-stimulus baseline window. Session 1 data.
Statistical analysis was carried out by means of MATLAB® (The Mathworks, Natick, MA) and Graphpad Prism (San Diego, CA). Error is reported as the standard error of the mean.
RESULTS
Overview of ASR Data
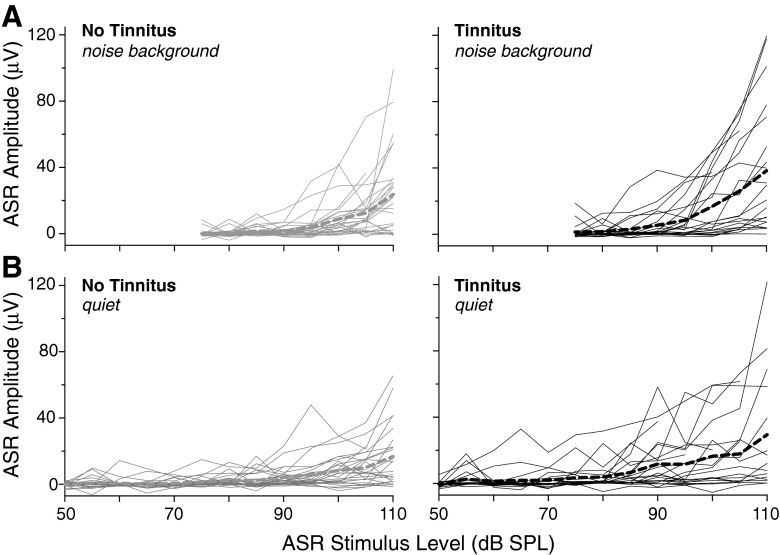
Figure 4 provides an overview of the ASR data obtained in session 1. The amplitude of the ASR, as measured by eyeblink EMG, showed an overall increase with increasing ASR stimulus level in the majority of subjects in both the noise (Fig. 4A) and quiet (4B) background conditions. This trend was apparent in individual subjects and on average (thin solid and thick dashed curves, respectively, in each panel) regardless of tinnitus status (compare left and right panels of Fig. 4A, B). Amplitude varied greatly across individuals, ranging from 0 (no response) to approximately 120 μV at the highest stimulus level in both noise and quiet background conditions. ASR threshold for some participants was below the minimum tested sound level. In others showing no response at any level, ASR threshold presumably exceeded the maximum tested stimulus level. All subjects are included in the following analyses, even if ASR threshold was below or above the range of ASR stimulation levels used.
FIG. 4.
ASR amplitude vs. ASR stimulus level for subjects without tinnitus (left) and with tinnitus (right). Mean amplitude vs. level (thick dashed lines) is superimposed on individual subject data (thin solid lines). Data are shown for both background conditions: continuous noise (A) and quiet (B). Session 1 data.
Relationship Between ASR and Loudness Discomfort Level
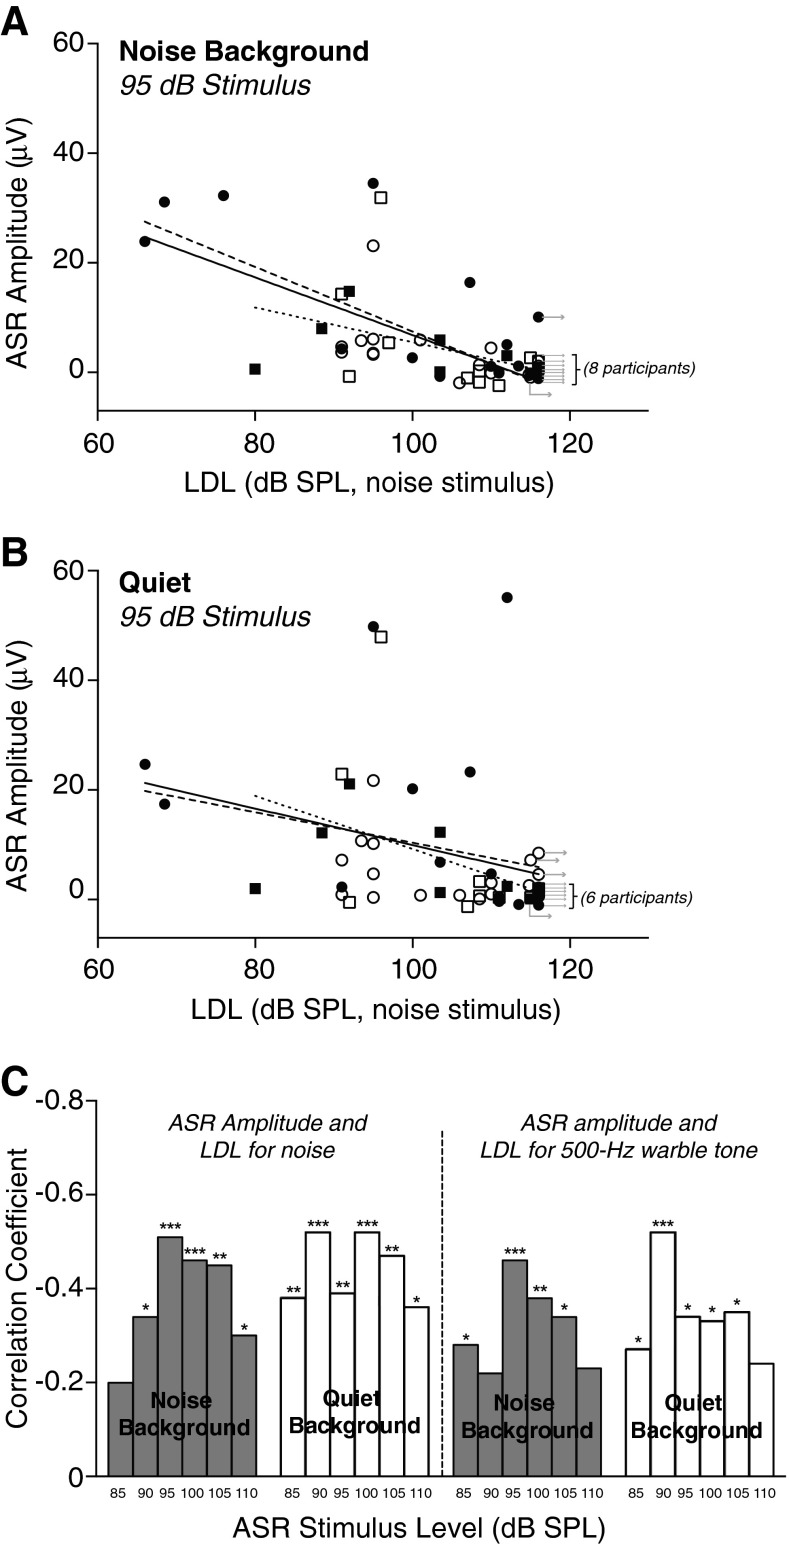
ASR amplitude, measured in either background noise or quiet conditions, showed negative correlations with LDL (Fig. 5A–C; session 1 data). This was the case regardless of LDL stimulus (500 Hz warble tone or broadband noise). Whether or not they had tinnitus, individuals with the highest LDLs had a low or non-existent ASR, whereas subjects with lower LDLs generally had larger ASR amplitudes (Fig. 5A, B). Correlation between ASR amplitude and LDL was significant for most ASR stimulus levels above 80 dB SPL (Fig. 5C).
FIG. 5.
ASR amplitude increased with decreasing LDL. A ASR amplitude at 95 dB SPL (after A-weighting) vs. LDL for the noise stimulus. The ASR was recorded in the noise background condition. Each symbol corresponds to a subject. Filled symbols: tinnitus. Open symbols: no tinnitus. Circles: men. Squares: women. Rightward arrows indicate that the value plotted horizontally is a lower bound on LDL, meaning that the subject did not reach a maximum loudness rating in one or both ears, even at the highest stimulus level used during LDL testing. Regression lines are for all subjects (solid line), for men only (dashed lines), and for women only (dotted lines). Symbols with arrows were not included in the fits. B Same as (A), but for ASR recorded in quiet. C Correlation between ASR amplitude and LDL (for noise and 500-Hz warble stimuli), for both noise and quiet ASR conditions (shaded and white bars, respectively) and ASR stimulus levels from 85 to 110 dB SPL. Correlation coefficients were calculated with the arrowed symbols included. Session 1 data.
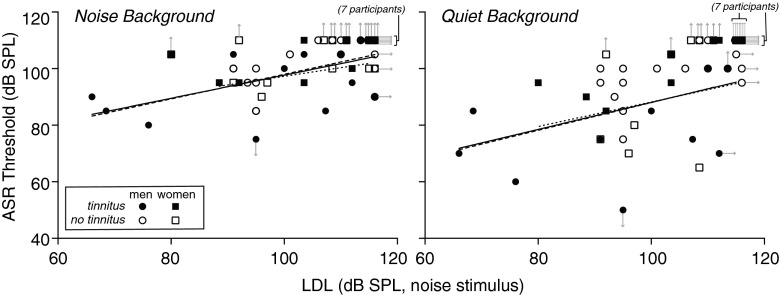
In keeping with the relationship between ASR amplitude and LDL, ASR threshold tended to be lower in subjects with lower LDLs. This trend can be seen for individuals with tinnitus (filled symbols) and for those without tinnitus (open) in Figure 6, which shows ASR threshold plotted vs. LDL for the noise stimulus in both noise and quiet background conditions. Correlation between ASR threshold and LDL for the noise stimulus was significant (noise background: r(50) = 0.53, p < 0.0001; quiet: r(50) = 0.68, p < 0.0001), as was the correlation between ASR threshold and LDL for the 500-Hz warble stimulus (noise background: r(50) = 0.49, p = 0.0002; quiet: r(50) = 0.58, p < 0.0001).
FIG. 6.
ASR threshold measured in noise (left) and quiet (right) background conditions, decreased with decreasing LDL. Each symbol corresponds to a subject. Filled symbols: tinnitus. Open symbols: no tinnitus. Circles: men. Squares: women. Rightward arrows indicate that the value plotted horizontally is a lower bound on LDL. Upward arrows indicate that ASR threshold was higher than the highest ASR stimulus level tested. Downward arrow indicates that ASR threshold was below the lowest ASR stimulus level tested. Regression lines are a fit to the data for all subjects (solid line), for men only (dashed lines), and for women only (dotted lines). Data points with arrows were not included in regression fits. ASR threshold was significantly correlated with LDL whether or not the arrowed symbols were included (noise background: r(50) = 0.53, p < 0.0001; quiet: r(50) = 0.68, p < 0.0001; Spearman) or excluded (noise background: r(29) = 0.53, p = 0.0022; quiet: r(27) = 0.40, p = 0.032).
To test whether the relationships between ASR and LDL might arise because of a co-dependence on hearing threshold, LDL and ASR amplitude were also compared after re-expressing LDL in dB SL and converting ASR stimulus level from dB SPL to dB SL. ASR stimuli were converted by subtracting the subject’s audiometric threshold for broadband noise from each stimulus level and rounding to the nearest 5 dB. All trends, or lack thereof, described in this paper held true when the data were converted to dB SL.
No Relationship Between ASR and SLTQ Score
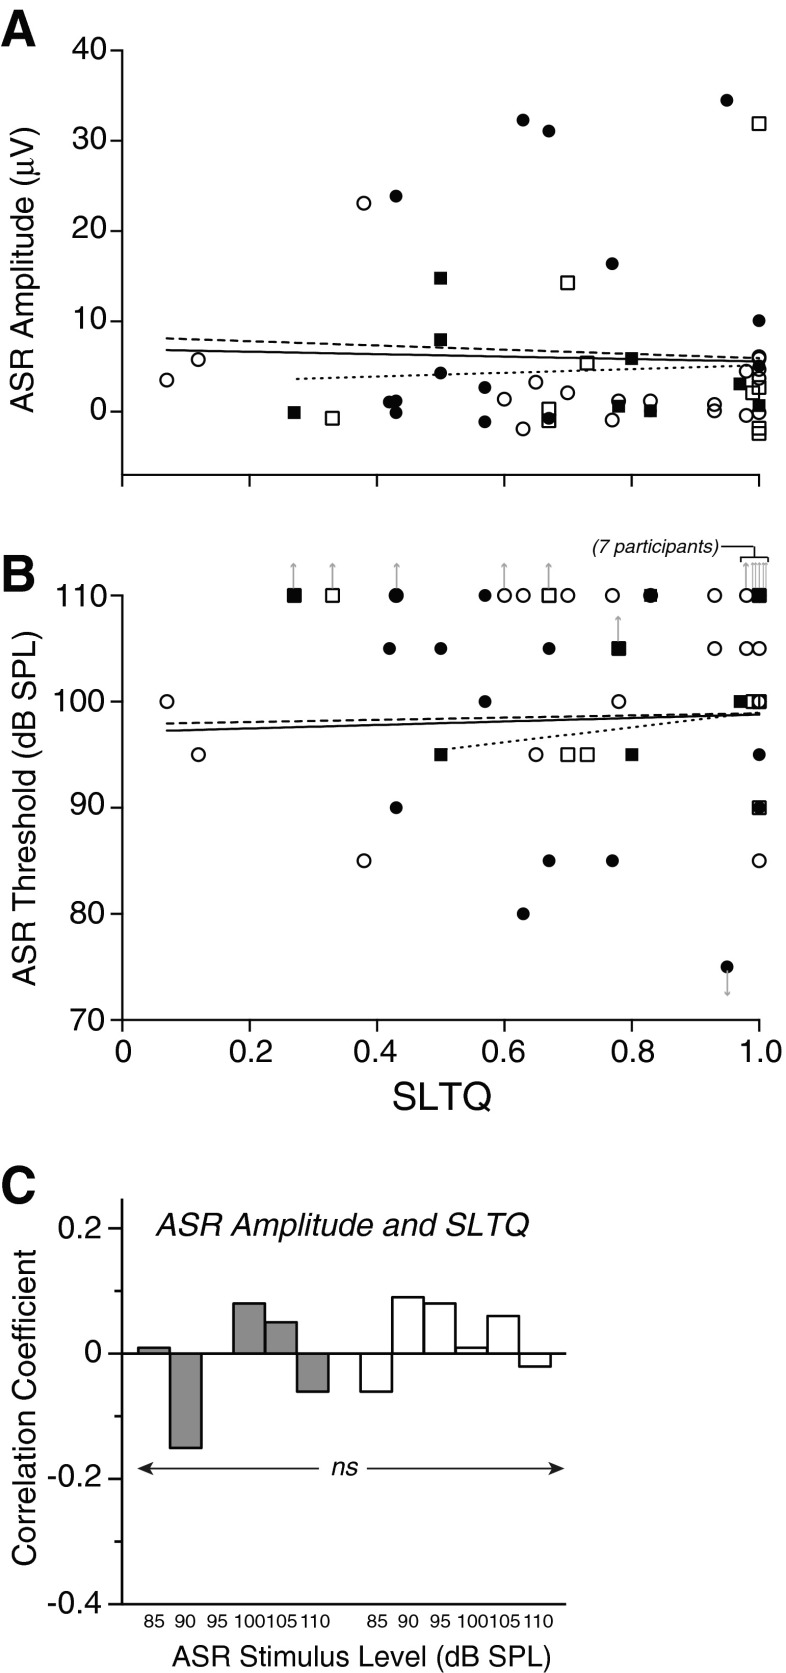
In contrast to LDL, self-report of SLT as measured by SLTQ score was not correlated with either ASR amplitude or ASR threshold (Fig. 7; session 1 data). This was the case for ASR data taken in either the noise or quiet background conditions, across ASR stimulus levels (85–110 dB SPL; r(37–50) p ≥ 0.13), and for both tinnitus and no tinnitus groups (Fig. 7C).
FIG. 7.
Lack of correlation between ASR measures and SLTQ. ASR amplitude at 95 dB SPL after A-weighting (A) and ASR threshold (B), both in the noise background condition, plotted vs. SLTQ. Each symbol corresponds to a subject. Filled symbols: tinnitus. Open symbols: no tinnitus. Circles: men. Squares: women. Upward arrows indicate that ASR threshold was higher than the highest ASR stimulus level tested. Downward arrow for the lowest point in (B) (corresponding to subject 378) indicates that ASR threshold was below the lowest ASR stimulus level tested. Regression lines are for all subjects (solid), men only (dashed), and women only (dotted) and were fit with the arrowed symbols excluded. C Correlation coefficients between SLTQ and ASR amplitude were small and not significant (|r|(37–50) ≤ 0.088, p ≥ 0.29) at any stimulus level, in both noise and quiet ASR measurement conditions (gray and white bars, respectively).
Relationships Between ASR and Tinnitus
In order to test for relationships between ASR amplitude and tinnitus, the dependence of amplitude on LDL was removed via linear regression for each stimulus level and background condition (for example, see regression lines in Fig. 5A, B). A single regression based on the combined data (tinnitus and no-tinnitus) was used. Individuals in whom only a lower bound on LDL was known (symbols with right-pointing arrows in Fig. 5A, B) were excluded from the fit so as not to artificially bias the slopes or intercepts. Dependencies on LDL for the noise stimulus were regressed out for the results that follow, but the same main results were obtained using LDL for the 500 Hz warble tone. ASR threshold was analyzed in the same manner as ASR amplitude, but showed no significant difference between tinnitus and no-tinnitus groups with LDL regressed out and will not be considered further.
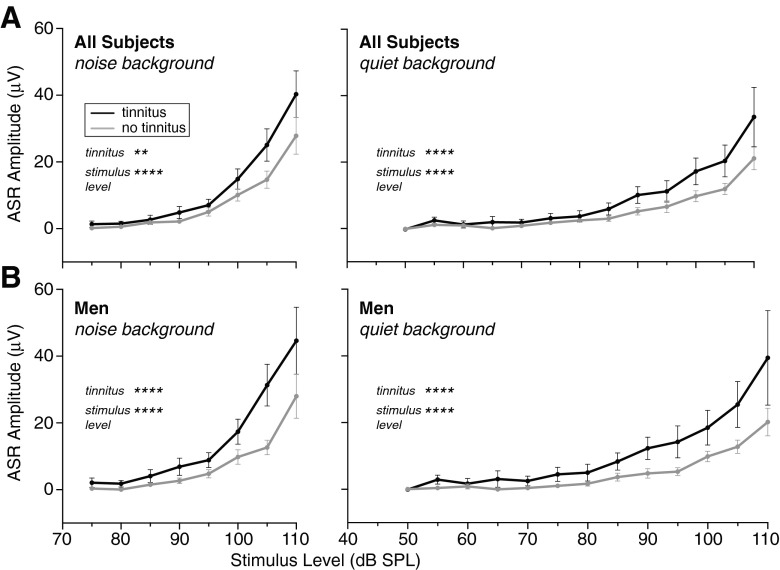
Figure 8A shows mean ASR amplitude vs. level for the tinnitus and no-tinnitus groups after regressing out the effects of LDL for the noise stimulus. Mean ASR amplitude was greater for the tinnitus group at all but the lowest levels where mean ASR amplitude was near zero for both subject groups. A two-way ANOVA (tinnitus × stimulus level) showed a significant effect of tinnitus as well as an effect of stimulus level for both noise and quiet background conditions (in noise: tinnitus effect: F[1392] = 10.9, p = 0.0010; stimulus effect: F[7392] = 37.0, p < 0.0001; in quiet: tinnitus effect F[1602] = 20.8, p < 0.0001; stimulus effect: F[12,602] = 26.4, p < 0.0001). Greater ASR amplitude in the tinnitus group was not attributable to hearing threshold since mean audiometric thresholds for the tinnitus and no-tinnitus groups were closely matched (Fig. 1A; no significant differences at any frequency; t-tests, t(50) ≤ 1.7, p > 0.087), nor was it attributable to age, which was also closely matched (mean ± SEM: 48 ± 2 years for tinnitus and 46 ± 1 for no tinnitus).
FIG. 8.
Mean ASR amplitude ± SEM for tinnitus (black) and no-tinnitus (gray) subjects after removing the effects of LDL for the noise stimulus via linear regression. Results for two-way ANOVA for tinnitus x stimulus level were significant for both factors for all subjects (A) and men only (B) in both the noise and quiet background conditions (left and right panels, respectively). **p < 0.01, ****p < 0.0001. Session 1 data.
Separate Examination of Men and Women
To examine whether the ASR relates to SLT and tinnitus similarly in the two sexes, the ASR data were re-analyzed separately for male and female subjects. With respect to SLT, men and women independently showed the same trends as the overall subject cohort: (1) ASR amplitude increased, while ASR threshold decreased, with decreasing LDL (dashed and dotted regression lines in Figs. 5 and 6) and (2) ASR amplitude and threshold showed no correlation with SLTQ. Thus, there was no sex difference in the relationships between ASR and SLT.
It is less clear whether or not there was a sex difference in the relationship between ASR and tinnitus. Regressing out the effects of LDL for the noise stimulus revealed elevated ASR amplitude in tinnitus men compared to no-tinnitus men, which was significant (Fig. 8B; two-way ANOVA tinnitus × stimulus level, in noise: tinnitus effect F[1250] = 17.9, p < 0.0001; in quiet: tinnitus effect F[1387] = 30.2, p < 0.0001). However, after the same analysis of the data for women, ASR amplitude in women did not show a significant relationship to tinnitus and the non-significant difference was opposite that seen in the men. Compared to the men, the tinnitus and no-tinnitus women were fewer (8 and 10, respectively, compared to 15 and 19) and less well matched in mean audiogram and age (compare Fig. 1B, C; mean age ± SEM: 51 ± 3 years for tinnitus and 47 ± 2 for no tinnitus compared to 46 ± 3 and 46 ± 1). Thus, in the end, the data raise the possibility that women differ from men in not showing a relationship between ASR and tinnitus, but do not allow a firm conclusion.
Test of Replication: Session 2 Data
The ASR data from session 2 enabled a test of replication of the trends described so far. For session 2 data: (1) ASR amplitude was negatively correlated with LDL for all levels, and significantly so at the higher levels (noise, stimulus level 100 dB SPL: Spearman r(36) = −0.38, p = 0.019; stimulus level 105 dB SPL: r(40) = −0.34, p = 0.028; 500-Hz warble tone, stimulus level 110 dB SPL: r(36) = −0.32, p = 0.047). (2) There was no correlation between ASR amplitude or threshold and SLTQ score. (3) After the effects of LDL for the noise stimulus were regressed out, mean ASR amplitude for the tinnitus group was greater than that of the no-tinnitus group (two-way ANOVA, tinnitus × stimulus level). This was the case for all subjects (effect of tinnitus: F(1305) = 6.8, p = 0.0097) and for men alone (F(1184) = 6.4, p = 0.013). In other words, the major relationships between ASR and LDL/tinnitus apparent in the session 1 data were replicated in session 2, as was the lack of relationship between ASR and SLTQ.
Lack of Relationship to Anxiety or Depression
Given previously reported relationships between ASR and anxiety (see Grillon 2002 for a review), the present data were examined for possible relationships to either state anxiety scores (anxiety related to the immediate term) or trait anxiety scores (anxiety over the longer term) from the anxiety inventory (scores given in Table 1). First, to determine whether LDL correlated with ASR because it served as a proxy for anxiety, state and trait anxiety were tested for possible correlations with LDL. No correlations were found for either LDL stimulus (noise or 500 Hz warble) in any subject group: all subjects, men only, women only (|r|(16–50) ≤ 0.10, p ≥ 0.48).
Second, the ASR data were tested directly for correlations with anxiety scores. Given the short-term nature of the state anxiety score, and the fact that the anxiety inventory was administered in session 2, state anxiety scores were compared to ASR data taken in session 2 only, while trait anxiety scores were compared to ASR data from both sessions. Analyses were done on ASR threshold and ASR amplitude (LDL regressed out) at stimulus levels high enough to routinely elicit a response (85–110 dB SPL). The results are as follows. State anxiety scores showed no correlation with either ASR amplitude or ASR threshold (session 2 data, ASR in noise background: |r|(36–40) ≤ 0.27, p ≥ 0.085, Spearman test). Trait anxiety also showed no correlation with either ASR amplitude or ASR threshold (session 1, noise or quiet background: |r|(16–50) ≤ 0.11, p ≥ 0.43; session 2, noise background: |r|(11–40) ≤ 0.28, p ≥ 0.069), except at one isolated ASR stimulus level in session 2 (90 dB SPL; correlation dominated by one outlier). In summary, there was little or no indication of a relationship between anxiety and ASR in the present data.
A similar analysis was carried out to compare depression scores with ASR amplitude and threshold. The depression scores of almost all subjects fell in the range of mild to no depression (≤25; Table 1). One subject fell in the moderate range (26–38), and no subjects fell in the severe to very severe range (>49). Neither ASR amplitude nor threshold showed correlations with depression (|r|(11–49) ≤ 0.33, p ≥ 0.19), with an isolated exception in the session 2 data (ASR amplitude at one stimulus level, 90 dB SPL). Thus, there was little or no indication of a relationship between depression and ASR.
Lack of Relationship to Tinnitus Variables
Finally, ASR amplitude and threshold in noise and quiet backgrounds (LDL regressed out) were tested for correlations to tinnitus variables: score on the THI, tinnitus loudness assessed via loudness match, and tinnitus MML. No significant correlations were found (|r|(11–19) ≤ 0.48, p ≥ 0.064, uncorrected for multiple comparisons).
DISCUSSION
The results demonstrate a correlation between reduced LDL and both elevated ASR amplitude and reduced ASR threshold, whereas they provide no indication of a relationship between ASR and a second measure of SLT, SLTQ score. The correlations between ASR and LDL were robust in that they were seen for ASR measurements in both noise and quiet background conditions and for both men and women separately. Moreover, they were not attributable to any other factor measured in this study, including audiometric threshold, age, or anxiety. While the ASR showed some relationship to tinnitus, the relationship was not sufficient to overshadow the relationship between ASR and LDL, which was demonstrable in all subjects combined, as well as tinnitus and no-tinnitus subjects alone.
The difference between LDL and SLTQ in relation to ASR is reasonable given previous comparisons between LDL and questionnaires on sound tolerance, which have generally described poor or inconsistent correlation between these two types of measures (Filion and Margolis 1992; Anari et al. 1999; Jastreboff and Jastreboff 2004; however, see Bläsing et al. 2010; note also the low and barely significant correlation between LDL and SLTQ scores of Table 1: noise LDL, r(50) = 0.30, p = 0.031; 500-Hz LDL r(50) = 0.13, p = 0.37). One possible reason for a lack of concordance between LDL and SLTQ is that the two measures reflect tolerance of different types of sound. The SLTQ asks subjects to rate their tolerance of sounds experienced in everyday life, but these may bear little spectral or temporal resemblance to the 500 Hz warble tone or broadband noise used here as LDL stimuli. Another possibility is that recognition of, or reaction to a given reduction in LDL may differ across individuals in the same way awareness of, and distress related to tinnitus differs across individuals with similar tinnitus loudness (Anari et al. 1999; Tyler et al. 2014). In other words, there is the auditory perceptual deficit (reduced LDL) and superimposed neocortical processes that determine whether or not the deficit is problematic to the individual (reflected in SLTQ score). Following this line of thinking, the ASR mirrors the perceptual deficit, without the “higher level” overlay that converts this deficit into a self-recognized problem and, in the extreme, into clinical hyperacusis.
Revised Interpretation of Elevated ASR in Animals
The present results bear on the interpretation of previous animal data in which elevations in ASR amplitude following various manipulations have been proposed, or implied (e.g., through use of the term hyperacusis-like) to be related to hyperacusis (Ison et al. 2007; Turner and Parrish 2008; Sun et al. 2009; Sun et al. 2012; Hickox and Liberman 2014; Chen et al. 2013; Salloum et al. 2014). The present human data indicate that ASR elevation reflects only one of the multiple dimensions comprising the complex clinical condition that is hyperacusis (Anari et al. 1999; Tyler et al. 2014). There are of course differences between the animal and human ASR work, including species and the particular muscular response being measured (whole body response vs. eye-blink). However, the most straightforward conclusion to draw is that the elevations in ASR seen in experimental animals do not reflect hyperacusis in toto, but rather reflect one aspect of hyperacusis, namely reduced LDL.
ASR as an Objective Indicator of LDL
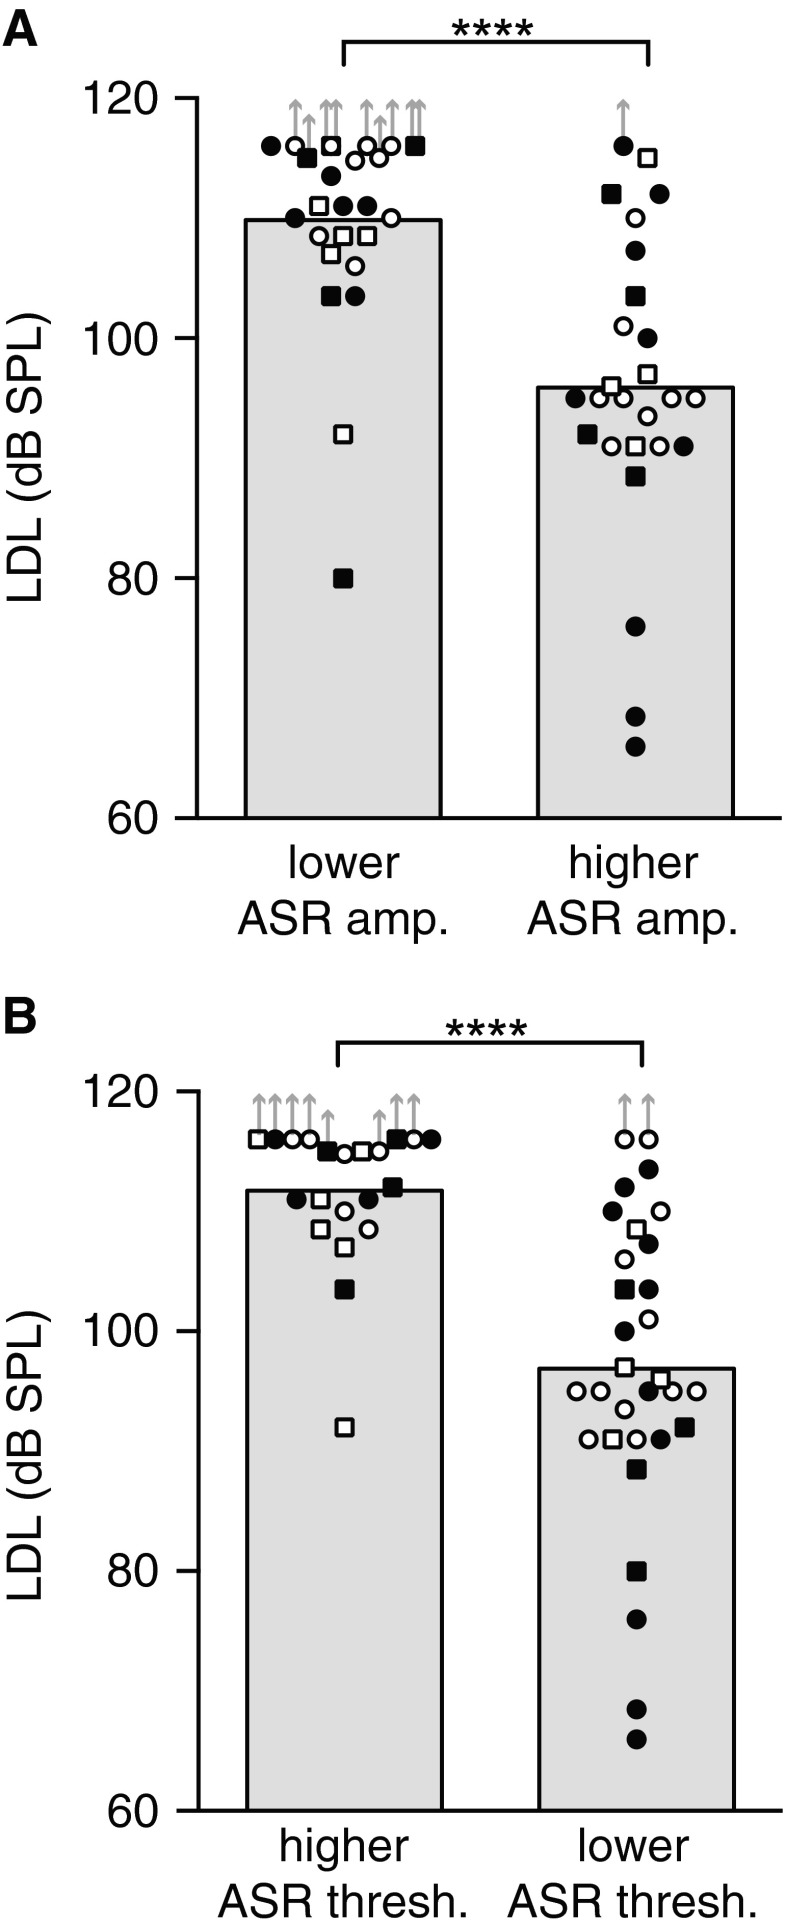
The correlations between LDL and ASR amplitude/ threshold suggest that the ASR might provide an objective indication of LDL. However, the correlations, while statistically significant, are not high enough that the ASR can be used as an accurate “read-out” of LDL in individuals. Instead, the data indicate that the ASR can be used to divide subjects into broad LDL categories as illustrated in Figure 9A, where subjects with ASR amplitude above the median have significantly lower LDLs than subjects with ASR amplitude below the median. Figure 9B shows a similarly significant difference in LDL for subjects distinguished based on ASR threshold. The present human data, and the proof-of-concept they provide, make a good case for using ASR amplitude (or ASR threshold) to distinguish groups of experimental animals with lower and higher LDLs.
FIG. 9.
ASR amplitude (A) and ASR threshold (B) can be used to define subject groups differing significantly in LDL. Subjects were grouped by whether their ASR amplitude (threshold) lay above the median for all subjects, or at or below the median. Mean LDL for the noise stimulus for each group is indicated by the gray bars. Symbols correspond to individuals. Filled symbols: tinnitus. Open symbols: no tinnitus. Circles: men. Squares: women. Upward arrows indicate plotted LDL value was a lower bound on the measurement. Asterisks denote significance of Mann–Whitney tests: U(50) = 88 and 133 in noise and quiet, respectively, ****p < 0.0001. Session 1 data.
Acknowledgments
The authors thank John J. Guinan and M. Charles Liberman for helpful comments on a previous version of the manuscript. They are grateful for the help of Barbara Norris in preparation of the figures and tables. They thank the study volunteers for their time and effort. The work was supported by NIH R21 DC012407, the Tinnitus Research Consortium, and NIH P30DC005209.
Compliance with Ethical Standards
Conflict of Interest
The authors declare that they have no conflict of interest.
Contributor Information
Inge M. Knudson, Phone: 001 617 573-4195, Email: inge_knudson@meei.harvard.edu
Jennifer R. Melcher, Email: jennifer_melcher@meei.harvard.edu
References
- Anari M, Axelsson A, Eliasson A, Magnusson L. Hypersensitivity to sound—questionnaire data, audiometry and classification. Scand Audiol. 1999;28:219–230. doi: 10.1080/010503999424653. [DOI] [PubMed] [Google Scholar]
- Baguley DM. Hyperacusis. J R Soc Med. 2003;96:582–585. doi: 10.1258/jrsm.96.12.582. [DOI] [PMC free article] [PubMed] [Google Scholar]
- Bläsing L, Goebel G, Flötzinger U, Berthold A, Kröner-Herwig B. Hypersensitivity to sound in tinnitus patients: an analysis of a construct based on questionnaire and audiological data. Int J Audiol. 2010;49:518–526. doi: 10.3109/14992021003724996. [DOI] [PubMed] [Google Scholar]
- Blumenthal TD, Cuthbert BN, Filion DL, Hackley S, Lipp OV, van Boxtel A. Committee report: Guidelines for human startle eyeblink electromyographic studies. Psychophysiology. 2005;42:1–15. doi: 10.1111/j.1469-8986.2005.00271.x. [DOI] [PubMed] [Google Scholar]
- Braff DL, Geyer MA, Swerdlow NR. Human studies of prepulse inhibition of startle: normal subjects, patient groups, and pharmacological studies. Psychopharm (Berlin) 2001;156:234–258. doi: 10.1007/s002130100810. [DOI] [PubMed] [Google Scholar]
- Chen G, Lee C, Sandridge SA, Butler HM, Manzoor NF, Kaltenbach JA. Behavioral evidence for possible simultaneous induction of hyperacusis and tinnitus following intense sound exposure. J Assoc Res Otolaryngol. 2013;14:413–424. doi: 10.1007/s10162-013-0375-2. [DOI] [PMC free article] [PubMed] [Google Scholar]
- Cox RM, Alexander GC, Taylor IM, Gray GA. The contour test of loudness perception. Ear Hear. 1997;18:388–400. doi: 10.1097/00003446-199710000-00004. [DOI] [PubMed] [Google Scholar]
- Davis M, Falls WA, Campeau S, Kim M. Fear-potentiated startle: a neural and pharmacological analysis. Behav Brain Res. 1993;58:175–198. doi: 10.1016/0166-4328(93)90102-V. [DOI] [PubMed] [Google Scholar]
- Filion PR, Margolis RH. Comparison of clinical and real-life judgments of loudness discomfort. J Am Acad Audiol. 1992;3:193–199. [PubMed] [Google Scholar]
- Fournier P, Hébert S. Gap detection deficits in humans with tinnitus as assessed with the acoustic startle paradigm: does tinnitus fill in the gap? Hear Res. 2013;295:16–23. doi: 10.1016/j.heares.2012.05.011. [DOI] [PubMed] [Google Scholar]
- Gallo FJ, Klein-Tasman BP, Gaffrey MS, Curran P. Expecting the worst: observations of reactivity to sound in young children with Williams syndrome. Res Dev Disabil. 2008;29:567–581. doi: 10.1016/j.ridd.2007.09.003. [DOI] [PMC free article] [PubMed] [Google Scholar]
- Geyer MA, Braff DL. Startle habituation and sensorimotor gating in schizophrenia and related animal models. Schizophr Bull. 1987;13:643–668. doi: 10.1093/schbul/13.4.643. [DOI] [PubMed] [Google Scholar]
- Grillon C. Startle reactivity and anxiety disorders: aversive conditioning, context, and neurobiology. Biol Psychiatry. 2002;52:958–975. doi: 10.1016/S0006-3223(02)01665-7. [DOI] [PubMed] [Google Scholar]
- Grillon C, Morgan CA, Southwick SM, Davis M, Charney S. Baseline startle amplitude and prepulse inhibition in Vietnam veterans with posttraumatic stress disorder. Psychiatry Res. 1996;64:169–178. doi: 10.1016/S0165-1781(96)02942-3. [DOI] [PubMed] [Google Scholar]
- Gu JW, Halpin C, Nam EC, Levine RA, Melcher JR. Tinnitus, diminished sound-level tolerance, and elevated auditory activity in humans with clinically normal hearing sensitivity. J Neurophysiol. 2010;104:3361–3370. doi: 10.1152/jn.00226.2010. [DOI] [PMC free article] [PubMed] [Google Scholar]
- Hébert S, Fournier P, Noreña A. The auditory sensitivity is increased in tinnitus ears. J Neurosci. 2013;33:2356–2364. doi: 10.1523/JNEUROSCI.3461-12.2013. [DOI] [PMC free article] [PubMed] [Google Scholar]
- Hickox AE, Liberman MC. Is noise-induced cochlear neuropathy key to the generation of hyperacusis or tinnitus? J Neurophysiol. 2014;111:552–564. doi: 10.1152/jn.00184.2013. [DOI] [PMC free article] [PubMed] [Google Scholar]
- Ison JR, Allen PD, O'Neill WE. Age-related hearing loss in C57BL/6J mice has both frequency-specific and non-frequency-specific components that produce a hyperacusis-like exaggeration of the acoustic startle reflex. J Assoc Res Otolaryngol. 2007;8:539–550. doi: 10.1007/s10162-007-0098-3. [DOI] [PMC free article] [PubMed] [Google Scholar]
- Jastreboff PJ, Jastreboff MM. Decreased sound tolerance. In: Snow JB, editor. Tinnitus: theory and management. Lewiston: BC Decker; 2004. pp. 8–15. [Google Scholar]
- Ludewig S, Geyer MA, Ramseier M, Vollenweider FX, Rechsteiner E, Cattapan-Ludewig K. Information-processing deficits and cognitive dysfunction in panic disorder. J Psychiatry Neurosci. 2005;30:37–43. [PMC free article] [PubMed] [Google Scholar]
- Madsen GF, Bilenberg N, Cantio C, Oranje B. Increased prepulse inhibition and sensitization of the startle reflex in autistic children. Autism Res. 2014;7:94–103. doi: 10.1002/aur.1337. [DOI] [PubMed] [Google Scholar]
- Meincke U, Light GA, Geyer MA, Braff DL, Gouzoulis-Mayfrank E. Sensitization and habituation of the acoustic startle reflex in patients with schizophrenia. Psychiatry Res. 2004;126:51–61. doi: 10.1016/j.psychres.2004.01.003. [DOI] [PubMed] [Google Scholar]
- Miller MW, Gronfier C. Diurnal variation of the startle reflex in relation to HPA-axis activity in humans. Psychophysiology. 2006;43:297–301. doi: 10.1111/j.1469-8986.2006.00400.x. [DOI] [PMC free article] [PubMed] [Google Scholar]
- Newman CW, Jacobson GP, Spitzer JB. Development of the tinnitus handicap inventory. Arch Otolaryngol Head Neck Surg. 1996;122:143–148. doi: 10.1001/archotol.1996.01890140029007. [DOI] [PubMed] [Google Scholar]
- Rush AJ, Gullion CM, Basco MR, Jarrett RB, Trivedi MH. The inventory of depressive symptomatology (IDS): psychometric properties. Psychol Med. 1996;26:477–486. doi: 10.1017/S0033291700035558. [DOI] [PubMed] [Google Scholar]
- Salloum RH, Yurosko C, Santiago L, Sandridge SA, Kaltenbach JA. Induction of enhanced acoustic startle response by noise exposure: dependence on exposure conditions and testing parameters and possible relevance to hyperacusis. PLoS ONE. 2014;9(10):e111747. doi: 10.1371/journal.pone.0111747. [DOI] [PMC free article] [PubMed] [Google Scholar]
- Schecklmann M, Landgrebe M, Langguth B, TRI Database Study Group Phenotypic characteristics of hyperacusis in tinnitus. PLoS ONE. 2014;9(1):e86944. doi: 10.1371/journal.pone.0086944. [DOI] [PMC free article] [PubMed] [Google Scholar]
- Spielberger CD. State-trait anxiety inventory. Menlo Park: Mind Garden, Inc; 1983. [Google Scholar]
- Sun W, Lu J, Stolzberg D, Gray L, Deng A, Lobarinas E, Salvi RJ. Salicylate increases the gain of the central auditory system. Neuroscience. 2009;159:325–334. doi: 10.1016/j.neuroscience.2008.12.024. [DOI] [PMC free article] [PubMed] [Google Scholar]
- Sun W, Deng A, Jayaram A, Gibson B. Noise exposure enhances auditory cortex responses related to hyperacusis behavior. Brain Res. 2012;1485:108–116. doi: 10.1016/j.brainres.2012.02.008. [DOI] [PubMed] [Google Scholar]
- Swerdlow NR, Sprock J, Light GA, Cadenhead K, Calkins ME, Dobie DJ, Freedman R, Green MF, Greenwood TA, Gur RE, Mintz J, Olincy A, Neuchterlein KH, Radant AD, Schork NJ, Seidman LJ, Siever LJ, Silverman JM, Stone WS, Tsuang DW, Tsuang MT, Turetsky BI, Braff DL. Multi-site studies of acoustic startle and prepulse inhibition in humans: initial experience and methodological considerations based on studies by the Consortium on the Genetics of Schizophrenia. Schizophr Res. 2007;92:237–251. doi: 10.1016/j.schres.2007.01.012. [DOI] [PMC free article] [PubMed] [Google Scholar]
- Turner JG, Parrish J. Gap detection methods for assessing salicylate-induced tinnitus and hyperacusis in rats. Am J Audiol. 2008;17:S185–S192. doi: 10.1044/1059-0889(2008/08-0006). [DOI] [PubMed] [Google Scholar]
- Tyler RS, Bergan C, Preece J, Nagase S. Audiologische Messmethoden der Hyperakusis. In: Nelting M, editor. Hyperakusis 6. Stuttgart: Georg Thieme Verlag; 2003. pp. 39–46. [Google Scholar]
- Tyler RS, Pienkowski M, Rojas Roncancio E, Jun JJ, Brozoski T, Dauman N, Barros Coelho C, Andersson G, Keiner AJ, Cacace AT, Martin N, Moore BCJ. A review of hyperacusis and future directions: Part I. Definitions and manifestations. Am J Audiol. 2014;23:402–417. doi: 10.1044/2014_AJA-14-0010. [DOI] [PubMed] [Google Scholar]


