

Abstract
Tumor necrosis factor (TNF) is associated with the pathophysiology of various neurological disorders, including multiple sclerosis. It exists as a transmembrane form tmTNF, signaling via TNF receptor 2 (TNFR2) and TNFR1, and a soluble form, solTNF, signaling via TNFR1. Multiple sclerosis is associated with the detrimental effects of solTNF acting through TNFR1, while tmTNF promotes repair and remyelination. Here we demonstrate that oligodendroglial TNFR2 is a key mediator of tmTNF-dependent protection in experimental autoimmune encephalomyelitis (EAE). CNP-cre:TNFR2fl/fl mice with TNFR2 ablation in oligodendrocytes show exacerbation of the disease with increased axon and myelin pathology, reduced remyelination, and increased loss of oligodendrocyte precursor cells and mature oligodendrocytes. The clinical course of EAE is not improved by the solTNF inhibitor XPro1595 in CNP-cre:TNFR2fl/fl mice, indicating that for tmTNF to promote recovery TNFR2 in oligodendrocytes is required. We show that TNFR2 drives differentiation of oligodendrocyte precursor cells, but not proliferation or survival. TNFR2 ablation leads to dysregulated expression of microRNAs, among which are regulators of oligodendrocyte differentiation and inflammation, including miR-7a. Our data provide the first direct in vivo evidence that TNFR2 in oligodendrocytes is important for oligodendrocyte differentiation, thereby sustaining tmTNF-dependent repair in neuroimmune disease. Our studies identify TNFR2 in the CNS as a molecular target for the development of remyelinating agents, addressing the most pressing need in multiple sclerosis therapy nowadays.
SIGNIFICANCE STATEMENT Our study, using novel TNF receptor 2 (TNFR2) conditional KO mice with selective TNFR2 ablation in oligodendrocytes, provides the first direct evidence that TNFR2 is an important signal for oligodendrocyte differentiation. Following activation by transmembrane TNF, TNFR2 initiates pathways that drive oligodendrocytes into a reparative mode contributing to remyelination following disease. This identifies TNFR2 as a new molecular target for the development of therapeutic agents in multiple sclerosis.
Keywords: cytokine, demyelination, multiple sclerosis, neurodegeneration, neuroinflammation, remyelination
Introduction
Multiple sclerosis (MS) is the most common neurological disease in young adults. Despite the general consensus on the autoimmune component of MS, its etiology remains unknown. Current treatments can slow disease progression, reduce relapses, and improve quality of life, but are not effective in halting or reverting myelin and axon damage, which are causes of permanent disability. To address the need for long-term reparative therapies, new pharmacological targets must be identified by elucidating the mechanisms of the underlying neurodegenerative process.
Tumor necrosis factor (TNF) is an immunomodulatory cytokine regulating physiological and pathological processes. TNF exists in two forms, transmembrane TNF (tmTNF) and soluble TNF (solTNF). solTNF derives from the cleavage of tmTNF by the TNF-α converting enzyme (Kriegler et al., 1988). The cellular functions of TNF are mediated by TNF receptor 1 (TNFR1) and TNFR2, which differ in expression, ligand affinity, structure, and downstream signaling pathways. solTNF and tmTNF can bind to both receptors but with different affinities. As a result, solTNF signals only through TNFR1 mediating primarily inflammation and apoptosis (Holtmann and Neurath, 2004), while tmTNF signals through both TNFR1 and TNFR2, promoting cell survival, resolution of inflammation, immunity and myelination (Grell et al., 1995; Probert, 2015).
TNF has been linked to MS pathophysiology (McCoy and Tansey, 2008). MS patients have high concentrations of solTNF in serum and CSF (Maimone et al., 1991; Sharief and Hentges, 1991), and marked TNF immunoreactivity within active lesions (Hofman et al., 1989; Selmaj et al., 1991). In experimental models of MS, TNF overexpression causes demyelination (Probert et al., 1995; Akassoglou et al., 1998; Dal Canto et al., 1999), while blockade improves the outcome (Ruddle et al., 1990; Baker et al., 1994). Nevertheless, the only MS clinical trial with a nonselective TNF inhibitor, Lenercept, had to be terminated due to occurrences of demyelination (Lenercept Multiple Sclerosis Study Group and University of British Columbia MS/MRI Analysis Group, 1999). Subsequent studies in knock-out (KO) mice uncovered that the two forms of TNF and their receptors have opposing biologic effects. Ablation of TNF or TNFR1/TNFR2 combined did not protect from experimental autoimmune encephalomyelitis (EAE), rather it caused exacerbation of chronic disease (Körner et al., 1997; Liu et al., 1998; Eugster et al., 1999; Kassiotis et al., 1999; Suvannavejh et al., 2000). TNFR1 ablation resulted in less severe EAE and better remyelination, while TNFR2 ablation caused worse EAE and prevented remyelination (Liu et al., 1998; Eugster et al., 1999; Suvannavejh et al., 2000; Arnett et al., 2001). Furthermore, mice only expressing tmTNF showed suppression of EAE (Alexopoulou et al., 2006). Based on these studies, the understanding of TNF involvement in MS has evolved, and a dichotomy has emerged between solTNF and tmTNF: MS and EAE are associated with the detrimental effects of solTNF via TNFR1, while tmTNF is important for repair and remyelination via TNFR2. In our own studies, we demonstrated that selective blockade of solTNF with XPro1595 improved EAE outcome, while the inhibition of both TNF forms with etanercept exacerbated the disease (Brambilla et al., 2011). The therapeutic effect of XPro1595 was associated with axon preservation, improved myelin compaction, and increased remyelination, suggesting that tmTNF might have protective functions by acting directly on cells of the oligodendrocyte lineage, which we showed express high levels of the tmTNF-responsive receptor TNFR2. To address this hypothesis, we generated oligodendrocyte-specific TNFR2 conditional KO mice (CNP-cre:TNFR2fl/fl mice). CNP-cre:TNFR2fl/fl mice exhibit more severe EAE, which is not improved by XPro1595 treatment, indicating that oligodendroglial TNFR2 is required for tmTNF beneficial functions. We show that, without TNFR2, oligodendrocyte differentiation is impaired and microRNAs (miRNAs) known to be crucial signals in regulating this process (miR-219, miR-138, miR-338, miR-7a) are dysregulated. Our study demonstrates that TNF signaling via TNFR2 has important repair functions in demyelinating disease by directly promoting oligodendrocyte differentiation. This has significant implications, particularly for the chronic progressive form of MS, for which no treatments are available. Enhancing TNFR2 signaling in the CNS may provide a viable therapeutic option to boost remyelination and achieve neuroprotection, halting, or even reverting, the progression of the disease.
Materials and Methods
Mice
Adult, age-matched (2–4 months of age) female and male mice were used in this study: males for all behavioral assessments in naive conditions, females for all EAE experiments, as they develop a more reproducible disease clinical course. All mouse lines were on a C57BL/6 background, since this genetic background develops a chronic nonrelapsing form of disease when used in myelin oligodendrocyte glycoprotein 35–55 peptide (MOG35–55)-induced EAE (Rangachari and Kuchroo, 2013). TNFR2fl/fl mice were obtained by breeding C57BL/6NTac-Tnfrsf1btm1a(EUCOMM)Wtsi/Ics mice (European Mouse Mutant Archive, EUCOMM Consortium) with an FLP deleter strain (catalog #009086, The Jackson Laboratory) to remove the FRT (FLP recombinase target)-flanked neomycin cassette. CNP-cre+/− mice (Lappe-Siefke et al., 2003) were a gift from Dr. Klaus Nave (Max Planck Institute of Experimental Medicine, Gottingen, Germany). TNFR2fl/fl and CNP-cre+/− mice were bred to generate CNP-cre:TNFR2fl/fl conditional KOs. TNFR2fl and TNFR2WT alleles were genotyped with the following primers: forward, 5′ TTGGGTCTAGAGGTGGCGCAGC 3′; and reverse, 5′ GGCCAGGAAGTGGGTTACTTTAGGGC 3′. TNFR2−/− (catalog #002620), WT C57BL/6, and Rosa26-stop-EYFP mice (catalog #006148) were obtained from The Jackson Laboratory. Colonies were housed in the Animal Core Facility of The Miami Project to Cure Paralysis, in a virus/antigen-free vivarium with a 12 h light/dark cycle, controlled temperature and humidity, and were provided with water and food ad libitum. Mice were group caged (maximum five per cage) throughout the duration of the experimentations. Experiments were performed according to protocols and guidelines approved by the Institutional Animal Care and Use Committee of the University of Miami, and all efforts were made to minimize pain and distress.
Behavioral assessments
Open field test.
The open field test was performed on adult male mice in an odor-free, nontransparent square arena, as previously described (Madsen et al., 2015). The arena was divided into three zones (wall, intermediate, and center) and mouse behavior was recorded over a 5 min period using a high-resolution video camera. The total number of lines crossed; the time spent in each zone; and stereotypical behaviors, such as grooming and rearing, were analyzed and expressed as the number of events. Mice that did not enter all three zones or cross a minimum of 50 lines during the 5 min trial were excluded.
Rotarod test.
Motor coordination and balance were tested on the accelerating rotarod cylinder (Rotamex 4/8, Columbus Instruments) in adult male mice, as previously described (Madsen et al., 2015). The test consisted of a 5 d pretraining (days 1–5) followed by the actual test (day 7). The cylinder rotated at increasing speed and constant acceleration (from 10 to 60 rpm over a 10 min period). The total time spent on the rod before falling was recorded, and nonwalking behaviors, such as passive clinging to the rod, were manually corrected for. Each trial consisted of an average of 4 sessions. After each session, the mice were transferred back to their cage and allowed to rest for 20 min to avoid exhaustion and minimize stress. Mice that could not maintain their balance on the rod for a minimum of 60 s during pretraining were excluded.
Induction of EAE
Active EAE was induced in 2-month-old female mice with MOG35–55 (BioSynthesis), as previously described (Brambilla et al., 2014). In select experiments, mice were treated with XPro1595 (10 mg/kg, s.c., every 3 d; Xencor) or vehicle (0.9% saline). Behavioral assessments and drug administration were conducted by a blinded investigator, as previously described (Brambilla et al., 2014).
Immunohistochemistry
Mice were perfused with 0.1 m PBS followed by 4% paraformaldehyde (PFA) in PBS. Spinal cord and brain were dissected out and postfixed for 2 h in 4% PFA. Tissues were cryoprotected in PBS plus 20% sucrose and cut with a cryostat into 30-μm-thick serial sections. After blocking for 1 h with 5% normal goat serum in PBS plus 0.4% Triton-X, sections were incubated overnight at 4°C with primary antibodies against APC (CC1 clone; 1:500; catalog #OP80, Millipore), NG2 (1:200; catalog #AB5320, Millipore), PDGF receptor α (PDGFRα; 1:200; catalog #558774, BD Bioscience), Olig2 (1:500; #AB9610, Millipore), GFP (1:1000; catalog #13970, Abcam), TNFR2 (1:50; catalog #SC-8041 and #SC-7862, Santa Cruz Biotechnology). Immunoreactivity was visualized with secondary species-specific fluorescent antibodies (1:750; Alexa Fluor-488, Alexa Fluor-594, and Alexa Fluor-647, Invitrogen). Sections were coverslipped with Vectashield mounting medium with DAPI (Vector Laboratories), and imaged with an Olympus FluoView 1000 confocal microscope or with a Zeiss Axiovert A1 fluorescence microscope.
Stereological quantifications
Five 30-μm-thick serial sections taken at 300 μm intervals were analyzed at a 63× magnification with a Zeiss Axiovert A1 fluorescence microscope by an investigator blinded to the genotype. The number of positive cells per cubic millimeter of tissue was estimated with Stereo Investigator software (MBF Bioscience) using the Optical Fractionator for unbiased counting and systematic random sampling.
Toluidine blue analysis and electron microscopy
PFA-fixed 1 mm segments of the thoracic spinal cord were postfixed overnight in 2% glutaraldehyde plus 100 mm sucrose in 0.15 m phosphate buffer, before incubation with 2% OsO4 for 1 h. Following dehydration in graded ethanol solutions, tissues were embedded in epoxy resin (Embed, Electron Microscopy Sciences). Semithin sections (1 μm thick) were obtained with a Leica Ultracut E microtome and stained with 1% toluidine blue solution. Samples were then examined by light microscopy. The number of toluidine blue-stained myelinated or degenerated axons was estimated using Stereo Investigator software (MBF Bioscience). From the same specimens, ultrathin sections (60–90 nm thick) were cut for electron microscopy (EM) and imaged with a Philips CM-10 transmission electron microscope.
Assessment of g-ratio and remyelination
EM micrographs of the spinal cord white matter were taken at a 5.2 thousand magnification (Brambilla et al., 2011). A grid was placed over the section, and pictures were taken randomly from each quadrant. One picture per quadrant was evaluated for a minimum of 25 images/mouse. Fiber and axon diameter of each axon were measured with ImageJ. Axons identified as “remyelinating” based on morphology (thin myelin, oligodendrocyte cytoplasm between myelin and axolemma) were excluded from the g-ratio analysis and counted as “remyelinating axons.” Quantifications were conducted by a blinded investigator.
Cell isolation for flow cytometry
Following transcardial perfusion with PBS, spinal cords and spleens were harvested and placed in cold HBSS. Samples were mechanically dissociated into single-cell suspensions through a 70 μm cell strainer and washed in HBSS. For leukocyte isolation from the spleen, suspensions were spun at 400 × g for 5 min, supernatants were removed, and red blood cells were lysed in 2 ml of lysis buffer (eBioscience) according to manufacturer instructions. Cells were then resuspended in flow cytometry buffer (FCB; eBioscience) and stained as described below. Leukocytes infiltrating into the spinal cord were isolated by negative selection of single-cell spinal cord suspensions with Myelin Removal Beads II in combination with LS columns, according to the manufacturer protocols (Miltenyi Biotec). Similar to the spleen cells, spinal cord cells were resuspended in FCB and stained as described below. The number of viable cells was determined by Trypan blue exclusion assay using a Bio-Rad TC20 automated cell counter.
Immunolabeling and flow cytometric analysis
Cells were resuspended in 100 μl of FCB, blocked with 2 μl of TruStainFcX (BioLegend) for 10 min at 4°C and stained for 30 min at 4°C with the following antibodies: APC-Cy7-anti-CD45 (1:200; #103116, BioLegend), FITC-anti-CD4 (1:200; catalog #11-0042, eBioscience), PerCP-Cy5.5-anti-CD8a (1:200; catalog #100734, eBioscience), PE-Cy7-anti-CD25 (1:200; catalog #25-0251-82, eBioscience), PE-anti-CD45R/B220 (1:200; catalog #103207, BioLegend), eFluor450-anti-CD11b (1:200; catalog #48-0112-82, eBioscience), APC-anti-O4 (1:100; catalog #130-095-891, Miltenyi Biotec), Alexa Fluor 488-anti-NG2 (1:200; catalog #AB5320A4, Millipore), or PE-anti-CD120b (TNFR2; 1:200; catalog #113406, BioLegend). Cell suspensions were then fixed and permeabilized (mouse Foxp3 staining kit, eBioscience) before intracellular staining with PE-anti-Foxp3 (1:100; catalog #12-5773-82, eBioscience). Cells were resuspended in 500 μl of FCB and analyzed with an LSRII flow cytometer (BD Biosciences) equipped with FACS-Diva 6.0 software (BD Biosciences).
RNA isolation and real-time PCR
Total RNA was extracted with TRIzol (Invitrogen) and reversed transcribed as previously described (Brambilla et al., 2011). Real-time PCR was performed in the Rotor-Gene 3000 Real Time Cycler (Corbett Life Science) as described previously (Brambilla et al., 2011). Primers for gene amplification are listed in Table 1. For miRNA amplification, following TRIzol extraction, total RNA was purified with the miRNeasy Micro Kit (Qiagen), then reverse transcribed with the Universal cDNA Synthesis Kit II (Exiqon). cDNA diluted 1:10 to 1:100 (depending on the abundance of the miRNA of interest) was amplified with the Power SYBR Green PCR Master Mix (Invitrogen) with primers designed for U6 (reference miRNA for normalization), miR-7a, and miR-138 (Exiqon), according to manufacturer recommendations. Quantitative PCR was performed on an ABI 7300 Real-Time PCR System (ThermoFisher Scientific). Relative miRNA expression was calculated using the ΔΔCt method (Livak and Schmittgen, 2001) and expressed as a percentage of WT oligodendrocyte precursor cell (OPC) miRNA expression.
Table 1.
Primers for real-time PCR gene amplification
| Gene | Primer sequence | Product length | Optimal Atemp |
|---|---|---|---|
| TNFR1 | F: 5′ gcccgaagtctactccatcatttg 3′ | 91 bp | 56.2°C |
| R: 5′ ggctggggagggggctggagttag 3′ | |||
| TNFR2 | F: 5′ gcccagccaaactccaagcatc 3′ | 133 bp | 54.0°C |
| R: 5′ tcctaacatcagcagacccagtg 3′ | |||
| CXCL10 | F: 5′ gccgtcattttctgcctcatcct 3′ | 113 bp | 57.2°C |
| R: 5′ ctcattctcactggcccgtcatc 3′ | |||
| IFNγ | F: 5′ aggaactggcaaaaggatggtgac 3′ | 118 bp | 53.1°C |
| R: 5′ tgacgcttatgttgttgctgatgg 3′ | |||
| TNF | F: 5′ aggcactcccccaaaagatg 3′ | 123 bp | 56.6°C |
| R: 5′ tcaccccgaagttcagtagacaga 3′ | |||
| IL-1β | F: 5′ cttcaaatctcacagcagcacatc 3′ | 102 bp | 53.4°C |
| R: 5′ ccacgggaaagacacaggtag 3′ | |||
| MBP | F: 5′ cggggctctggcaaggactcacac 3′ | 101 bp | 54.3°C |
| R: 5′ tggactactgggttttcatctt 3′ | |||
| PLP | F: 5′ ttccagaggccaacatcaag 3′ | 149 bp | 54.4°C |
| R: 5′ acacaggtacagccgagcag 3′ | |||
| GPR17 | F: 5′ atccctggctgtggcttttacctt 3′ | 128 bp | 56.2°C |
| R: 5′ caatcatgcggacggctttat 3′ | |||
| PDGFRα | F: 5′ cctggcatgatggtcgattctact 3′ | 134 bp | 55.3°C |
| R: 5′ ggtctcttctcgggctcactgttc 3′ | |||
| Notch1 | F: 5′ gaggtcaacgagtgcaacagtaac 3′ | 92 bp | 55.4°C |
| R: 5′ ctccacccaggggcacagtcac 3′ | |||
| Jagged1 | F: 5′ tggcttgggtctgttgcttggtga 3′ | 88 bp | 58.6°C |
| R: 5′ tcgggggcggagtgagtgtgg 3′ | |||
| β-actin | F: 5′ ctagacttcgagcaggagatgg 3′ | 141 bp | 55.9°C |
| R: 5′ caagaaggaaggctggaaaagag 3′ | |||
| GAPDH | F: 5′ gaggccggtgctgagtatgtcgtg 3′ | 116 bp | 59.3°C |
| R: 5′ tcggcagaaggggcggagatga 3′ |
F, Forward; R, reverse; Atemp, Annealing temperature.
Primary oligodendrocyte cultures
Cortices from postnatal day 4–6 pups were isolated and dissociated into single cell suspensions with Papain Neural Tissue Dissociation Kit (Miltenyi Biotec). PDGFRα+ OPCs were isolated by MACS separation using LS columns (Miltenyi Biotec) after incubation with PDGFRα magnetic microbeads. PDGFRα+ cells were cultured on poly-d-lysine/laminin-coated 24-well plates (40,000 cells/well) in OPC medium consisting of DMEM/F12/HEPES supplemented with 1% N2, 2% B27, 0.01% BSA, 7.5% NaHCO3, 1% penicillin/streptomycin, 10 ng/ml PDGF-AA, and 10 ng/ml FGF2. After 2 d in culture 100% of DAPI+ cells were positive for PDGFRα and 97.5% positive for Olig2. No cells stained for NeuN (neurons), GFAP (astrocytes), Iba1 (microglia), or PDGFRβ (fibroblasts). Cells were maintained in OPC medium for 4 d. At day 4, cells were either fixed/collected or switched to oligodendrocyte (OL) differentiation medium consisting of DMEM/F12/HEPES supplemented with 1% N2, 2% B27, 0.01% BSA, 7.5% NaHCO3, 0.5% gentamycin, 10 ng/ml CNTF, and 40 ng/ml T3. Cells were differentiated to premyelinating OLs for 4 d then fixed or collected for RNA extraction. OLs were identified by O1 labeling of live cells with hybridoma culture supernatant or MPB staining (rat, 1:500; catalog #MAB386, Millipore). Immunoreactivity was visualized with secondary species-specific fluorescent antibodies (1:750; Alexa Fluor-594 and Alexa Fluor-488, Invitrogen).
Terminal deoxynucleotidyl transferase-mediated biotinylated UTP nick end labeling staining
Apoptotic cell death was detected with the terminal deoxynucleotidyl transferase-mediated biotinylated UTP nick end labeling (TUNEL) assay (Millipore) according to manufacturer protocols. Biotin-labeled fragmented DNA was visualized with strepdavidin-conjugated Alexa Fluor-647 (1:2000; catalog #S-32357, Invitrogen). OPCs and OLs were identified by double labeling with anti-PDGFRα (rabbit; 1:200; catalog #SC-338, Santa Cruz Biotechnology) and anti-APC (CC1 clone; mouse; catalog #OP80, 1:500, Millipore), respectively, followed by Alexa Fluor-488 goat anti-mouse secondary antibody (1:750; catalog #A11001, Invitrogen). For each well, five images were acquired at a 20× magnification, and PDGFRα+TUNEL+ and CC1+TUNEL+ cells were counted blindly.
Oligodendrocyte proliferation and differentiation by 5-ethynyl-2-deoxyuridine incorporation
OPCs were incubated with 10 μm 5-ethynyl-2-deoxyuridine (EdU) for 8 h at 37°C, either fixed with 4% PFA for 15 min at room temperature or switched to OL medium, and differentiated for 4 d. EdU incorporation was detected with the Click-iT EdU Alexa Fluor-594 Imaging Kit (Invitrogen) according to manufacturer protocols. OPC proliferation was assessed as the ratio of PDGFRα+EdU+ cells to total PDGFRα+ cells. OL differentiation was assessed as the ratio of CC1+EdU+ cells to total CC1+ cells. Each condition was run in four replicates, and for each replicate the cell number was determined as the average of five images randomly collected. All images were recorded by a blinded investigator. Data are the average ± SEM of three independent experiments.
MicroRNA expression
Spinal cords were harvested in cold HBSS and dissociated with Papain Neural Dissociation Kit (Miltenyi Biotec). Single-cell suspensions were cleared from myelin by incubation with Myelin Removal Beads II followed by negative selection with LS columns (Miltenyi Biotec). To select for cells of the oligodendrocyte lineage, suspensions were incubated with 10 μl of anti-PDGFRα plus 10 μl of anti-O4 magnetic microbeads (Miltenyi Biotec) for 15 min at 4°C, then positively selected with LS columns (Miltenyi Biotec). Cell viability and oligodendrocyte enrichment were verified by flow cytometry using APC-anti-O4 (1:100; catalog #130-095-891, Miltenyi Biotec) and PE-anti-PDGFRα (1:100; catalog #SC-338PE, Santa Cruz Biotechnology) antibodies, and the fraction of PDGFRα+ and O4+ cells combined was assessed to be consistently >40% of the total number of viable cells. Total RNA was isolated with a miRNeasy Kit (Qiagen), and microRNA expression was assayed with the microRNA Ready-to-Use PCR Array (Mouse&Rat version 2.R; Exiqon). Arrays were run on a LightCycler 480 real-time PCR machine (Roche) at the Oncogenomics Core Facility of the University of Miami. Data analysis was performed using the GenEx software (Multid Analyses AB). For each comparison, output files from the LightCycler were uploaded to the software and an interplate calibration was performed. Normalization was performed using the global mean method (Mestdagh et al., 2009). Statistical significance was assessed by an unpaired two-tailed t test.
In situ hybridization
Thirty-micrometer-thick isopropanol-fixed spinal cord sections were subjected to standard in situ hybridization, as previously described, using an alkaline phosphatase-labeled LNA probe recognizing mouse miR-7 (miR-7 probe: ACAACAAAATCACTAGTCTTCCA; DNA Technology A/S; Hansen et al., 2013). Sections were rinsed 15 min in TBS plus 1% Triton X-100 and incubated with anti-PDGFRα antibody (1:250; catalog #SC-338, Santa Cruz Biotechnology) in TBS plus 10% bovine serum overnight, then incubated with Alexa Fluor-546 goat anti-rabbit IgG (1:200; Invitrogen) for 1 h. Sections were mounted with Aquatex (EMD Millipore). Expression of miR-7 was visualized with bright-field imaging. Colocalization with PDGFRα immunostaining was determined after conversion of the signal to green pseudocolor using Adobe Photoshop software (Lambertsen et al., 2009). The number of miR-7a+ cells was quantified in the intact white matter on spinal cord serial sections at 300 μm intervals using ImageJ by an investigator blinded to the genotype. Four to eight sections/mouse were analyzed, and numbers were normalized to the area of intact white matter.
Statistical analysis
Statistical analysis of the clinical course of EAE was performed with the Mann–Whitney U test. Histological data, flow cytometry assessments, and real-time PCR were analyzed by either one-way or two-way ANOVA followed by Bonferroni's or Tukey's test for multiple comparisons. In the case of single comparisons, the Student's t test was applied. The g-ratio data were analyzed by linear regression, and slope and elevation parameters were used to compare groups. p values ≤0.05 were considered to be statistically significant. Data were expressed as the average of multiple determinations ± SEM. Statistical analyses were conducted with GraphPad Prism software.
Results
Generation and characterization of CNP-cre:TNFR2fl/fl mice
To assess the pathophysiological function of oligodendroglial TNFR2, we established CNP-cre:TNFR2fl/fl conditional KOs where TNFR2 is ablated from OPCs and OLs. CNP-cre+/− mice (Lappe-Siefke et al., 2003) were crossed with TNFR2fl/fl mutants obtained by breeding C57BL/6NTac-Tnfrsf1btm1a(EUCOMM)Wtsi/Ics mice with an Flp1 deleter line to remove the FRT-flanked neomycin cassette (Fig. 1A,B). Recombination efficiency was evaluated by crossing CNP-cre+/− mice with Rosa26-stop-EYFP reporter mice and determined to be ∼60% in OPCs and close to 100% in OLs (Fig. 1C), indicating that CNP-cre mice are suitable for TNFR2 ablation throughout the lineage. TNFR2 expression in NG2+ OPCs and O4+ OLs was found to be significantly reduced in CNP-cre:TNFR2fl/fl mice by ∼25% and 40%, respectively (Fig. 1D). Stereological counting of PDGFRα+TNFR2+ OPCs and CC1+TNFR2+ OLs yielded similar results (Fig. 1E,F). In addition, TNFR2 gene expression in the spinal cord was downregulated compared with TNFR2fl/fl, WT, and CNP-cre+/− mice (Fig. 1G). Importantly, oligodendroglial TNFR2 ablation did not result in changes in the number of NG2+PDGFRα+ OPCs (Fig. 1H) or CC1+ OLs (Fig. 1I,J), suggesting that TNFR2 is not implicated in the regulation of oligodendrocyte survival and/or maturation during development. To further investigate whether TNFR2 ablation might interfere with normal oligodendrocyte function, we quantified the expression of genes involved in inflammation and myelination in the spinal cord and found no difference between CNP-cre:TNFR2fl/fl mice and any of the control groups (Fig. 2A). Finally, we assessed spontaneous activity and locomotor function with the rotarod test (Fig. 2B,C) and open field test (Fig. 2D–I), where CNP-cre:TNFR2fl/fl mice performed equally to controls. Typical and anxiety-related behaviors were not altered as well (Fig. 2E–I). Collectively, these data indicate that CNP-cre:TNFR2fl/fl mice are a suitable model to study oligodendroglial TNFR2 function in vivo.
Figure 1.

Generation and characterization of CNP-cre:TNFR2fl/fl mice. A, Schematic of the generation of CNP-cre:TNFR2fl/fl mice: crossing of C57BL/6NTac-Tnfrsf1btm1a(EUCOMM)Wtsi/Ics mice carrying the targeted allele with Rosa26-Flp1 mice to excise the neomycin resistance cassette; crossing of the resulting mice carrying the conditional allele with CNP-cre+/− mice to excise exons 2 and 3 of the TNFR2 gene and obtain mice carrying the KO allele. The WT allele is also depicted. B, Representative genotyping PCR on genomic DNA from litters of CNP-cre:TNFR2fl/fl + TNFR2fl/fl breeding pairs. C, Stereological counting of EYFP+PDGFRα+ and EYFP+CC1+ cells in the spinal cord of naive CNP-cre:Rosa26-stop-EYFP mice. Results are expressed as the percentage EYFP+PDGFRα+ and EYFP+CC1+ cells of the total PDGFRα+ and CC1+ populations, respectively (n = 3/group). D, Flow cytometric assessment of NG2+ OPCs and O4+ OLs expressing TNFR2 in the spinal cord of TNFR2fl/fl and CNP-cre:TNFR2fl/fl naive mice. Data are expressed as the percentage ± SEM of the total NG2 or O4 population (n = 4–6/group). *p ≤ 0.05, Student's t test. E, Ratio of the number of PDGFRα+TNFR2+ OPCs to the total number of PDGFRα+ OPCs counted in the naive thoracic spinal cord by stereology (n = 4/group). *p ≤ 0.05, Student's t test. F, Ratio of the number of CC1+TNFR2+ OLs to the total number of CC1+ OLs counted in the naive thoracic spinal cord by stereology (n = 4/group). *p ≤ 0.05, Student's t test. G, Assessment of TNFR2 gene expression in the naive spinal cord by real-time RT-PCR. Data are expressed as the percentage ± SEM of WT mice (n = 4/group). *p ≤ 0.05, Student's t test. H, Stereological quantification of the total number of NG2+PDGFRα+ OPCs in the thoracic spinal cord in naive conditions (n = 3–5/group). I, J, Stereological quantification of the total number of CC1+ OLs in the thoracic spinal cord and in the corpus callosum, respectively, of naive mice (n = 4–5/group).
Figure 2.

Ablation of oligodendroglial TNFR2 does not alter basal gene expression, locomotor function, or anxiety-like behaviors in naive conditions. A, Gene expression of inflammatory molecules and oligodendrocyte-specific genes assessed in the spinal cord of CNP-cre:TNFR2fl/fl mice compared with WT, CNP-cre+/−, and TNFR2fl/fl controls by real-time RT-PCR. Data are expressed as the percentage ± SEM of WT mice (n = 4/group). One-way ANOVA, Tukey's test. B, C, Assessment of motor coordination with the rotarod test: time spent on the rod was measured during a 5 d pretraining session (B) followed by the actual test (C; n = 7–16/group). D–I, Spontaneous activity and anxiety-like behaviors were evaluated with the open field test by measuring the number of lines crossed (D), rearings (E), and groomings (F), and the time spent in the wall (G), inter (H), and center (I) zones (n = 6–16/group). No differences were observed among genotypes (by one-way ANOVA with Tukey's test).
Ablation of oligodendroglial TNFR2 results in EAE exacerbation
To assess whether oligodendroglial TNFR2 mediates tmTNF protective function in neuroimmune disease, we induced EAE with MOG35–55 peptide (Brambilla et al., 2014). CNP-cre:TNFR2fl/fl mice showed a significantly worse clinical outcome than TNFR2fl/fl controls, with earlier onset and exacerbated chronic disease (Fig. 3A, Table 2). The administration of the solTNF inhibitor XPro1595, which improved EAE in TNFR2fl/fl controls in line with our previous studies (Brambilla et al., 2011), did not show any benefit in CNP-cre:TNFR2fl/fl mice, confirming that the therapeutic outcome of solTNF inhibition is dependent on a functional TNFR2 in oligodendrocytes. Immune cell infiltration into the spinal cord mirrored the clinical course of the disease. At peak EAE (19 dpi), CNP-cre:TNFR2fl/fl mice had a significantly higher percentage of infiltrating CD4+ and CD8+ T cells, as well as a higher percentage of regulatory T cells (Fig. 3B). By 25 dpi, when disease scores were almost overlapping, infiltrating cells were comparable between genotypes (Fig. 3C). In the spleen, no differences were found in naive conditions or after EAE (Fig. 3D–F). The acute phase of EAE was characterized by the upregulation of proinflammatory mediators like TNF, IL-1β, IFNγ, and C-X-C ligand-10 (CXCL10; Fig. 3G), but no differences were found between CNP-cre:TNFR2fl/fl and TNFR2fl/fl mice, likely due to the similar EAE severity at this stage of disease. Interestingly, we found changes in the expression of TNF receptors. TNFR2 was upregulated in TNFR2fl/fl mice after EAE but not in CNP-cre:TNFR2fl/fl mice, which, as anticipated, showed significant reduction of TNFR2 in naive as well as disease conditions. TNFR1 was upregulated after EAE in both genotypes, but with a higher increment in CNP-cre:TNFR2fl/fl mice. This could be due to the increased infiltration of peripheral immune cells, which are known to highly express TNFR1 (Vielhauer et al., 2005; Liu and Tang, 2014).
Figure 3.

Ablation of oligodendroglial TNFR2 results in EAE exacerbation. A, Clinical course of MOG35–55-induced EAE in mice treated with saline or XPro1595. Administration of XPro1595 (10 mg/kg, s.c., every 3 d) was initiated at day 16, when at least half the animals reached a minimum score of 2. Results are expressed as the daily mean clinical score ± SEM of 6–11 mice/group from two experiments. The TNFR2fl/fl curve is different from both the CNP-cre:TNFR2fl/fl and the TNFR2fl/fl + XPro1595 curves, and the latter is different from the CNP-cre:TNFR2fl/fl plus XPro1595 curve. *p ≤ 0.05, **p ≤ 0.01, one-way ANOVA, Mann–Whitney test. B–F, Flow cytometric analysis of the leukocyte populations infiltrating into the spinal cord or present in the spleen under naive and EAE conditions; n = 4–6/group, *p < 0.05, **p < 0.01, Student's t test. G, Gene expression analysis of select molecules in the spinal cord at 25 dpi EAE. Results are expressed as the percentage of TNFR2fl/fl naive mice ± SEM after normalization to β-actin gene expression; n = 4–6/group. *p ≤ 0.05, **p ≤ 0.01, one-way ANOVA, Tukey's test. H, Clinical course of MOG35–55-induced EAE in WT and CNP-cre−/+ mice (n = 8/group). Curves were compared by one-way ANOVA, Mann–Whitney test, and no differences were observed. I, Stereological quantification of toluidine blue-stained myelinated and degenerated axons in semithin thoracic spinal cord sections at 50 dpi EAE (n = 3). No differences were found (Student's t test).
Table 2.
Clinical parameters of EAE
| Group | Incidence | Onset (day)a | Peak disease (score) | Peak disease (d) | CDI |
|---|---|---|---|---|---|
| TNFR2fl/fl | 90.9% (20/22) | 15.42 ± 0.62 | 3.19 ± 0.22 | 18.00 ± 1.09 | 100.10 ± 17.75 |
| CNP-cre:TNFR2fl/fl | 68.4% (13/19) | 13.69 ± 0.43* | 3.64 ± 0.07 | 17.43 ± 0.72 | 142.20 ± 11.33 |
| TNFR2fl/fl plus XPro1595 | 3.46 ± 0.07 | 19.73 ± 1.88 | 91.03 ± 13.40 | ||
| CNPcreTNFR2fl/fl plus XPro1595 | 3.96 ± 0.04** | 19.00 ± 0.58 | 160.80 ± 6.10*** |
Data are reported as the mean ± SEM.
aDay of appearance of first clinical symptoms. CDI, cumulative disease index, calculated as the sum of the daily clinical scores beginning at onset.
*p ≤ 0.05 vs TNFR2fl/fl;
**p ≤ 0.001 vs TNFR2fl/fl plus XPro1595;
***p ≤ 0.01 vs TNFR2fl/fl plus XPro1595; Student's t test.
Recent reports (Hagemeyer et al., 2012; Wieser et al., 2013) have shown that CNP-cre−/+ mice display white matter abnormalities and axonal degeneration following aging or mild CNS trauma. This is due to the CNPase loss of function resulting from CNP-cre−/+ mice having only one allele of the endogenous Cnp1 gene (Lappe-Siefke et al., 2003), and this has highlighted the key role of CNPase in myelin stability. Therefore, to exclude that Cnp1 haploinsuffiency of the CNP-cre−/+ drivers could be responsible, at least in part, for the worsening of the clinical outcome in CNP-cre:TNFR2fl/fl mice, we performed a control experiment to assess the clinical course of EAE in CNP-cre+/− versus WT mice. CNP-cre+/− mice developed EAE similar to controls (Fig. 3H) and showed comparable axonal damage during chronic disease (Fig. 3I). This indicates that CNPase loss of function is not a factor in EAE exacerbation in CNP-cre:TNFR2fl/fl mice, which depends only upon TNFR2 ablation.
Ablation of oligodendroglial TNFR2 increases axonal loss after EAE
To assess whether worsening of the clinical outcome in CNP-cre:TNFR2fl/fl mice could be associated with more severe axonal damage, we quantified the number of intact and degenerated axons in the spinal cord in naive conditions and chronic EAE (Fig. 4A). No differences were found in naive mice, and with chronic EAE both groups displayed widespread axonal loss and accumulation of degenerated axons (Fig. 4A, black arrows). This damage was further exacerbated in CNP-cre:TNFR2fl/fl mice, who showed a significant reduction in myelinated axons (Fig. 4B) and an increase in degenerated axons (Fig. 4C). This suggests that oligodendroglial TNFR2 plays a neuroprotective function in pathological conditions.
Figure 4.
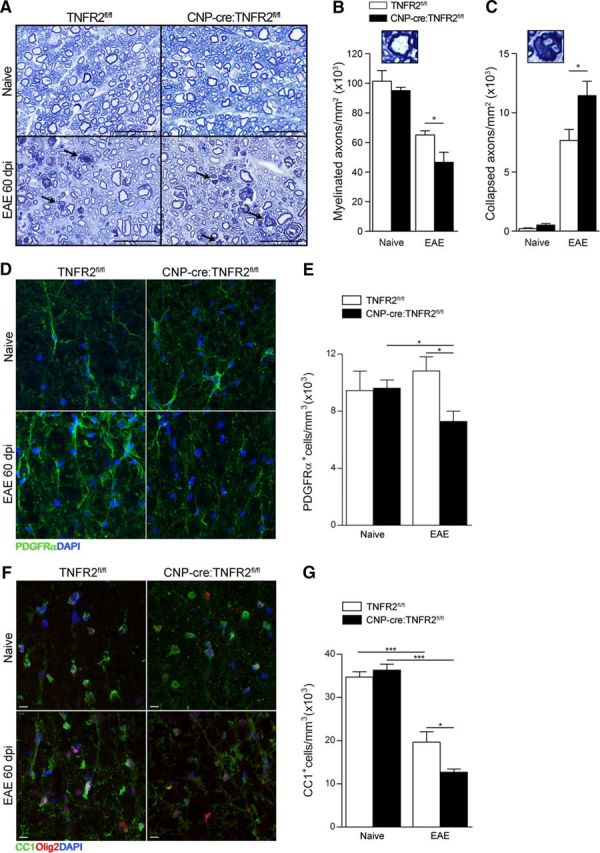
Ablation of oligodendroglial TNFR2 results in increased axon and oligodendrocyte loss after EAE. A, Toluidine blue staining of semithin thoracic spinal cord sections from naive and 60 dpi EAE mice. Black arrows indicate degenerated collapsed axons; scale bars, 25 μm. B, C, Stereological quantification of myelinated (B) and collapsed axons (C); n = 4–8/group. *p ≤ 0.05, Student's t test. D, F, Representative confocal images of PDGFRα+ OPCs (D) and CC1+Olig2+ OLs (F) in the thoracic spinal cord of naive and 60 dpi EAE mice; scale bars, 10 μm. E, G, Stereological quantification of PDGFRα+ OPCs (E) and CC1+ OLs (G); n = 4–5/group. *p ≤ 0.05, ***p ≤ 0.001, Student's t test.
Ablation of oligodendroglial TNFR2 increases myelin pathology and reduces remyelination after EAE
Next, we investigated whether the increased axonal damage in CNP-cre:TNFR2fl/fl mice was associated with worse oligodendrocyte and myelin pathology. We found a significant reduction in the number of PDGFRα+ OPCs in CNP-cre:TNFR2fl/fl mice after EAE (Fig. 4D,E). CC1+ OLs were also diminished compared with naive mice (Fig. 4F,G), but the loss was significantly higher in CNP-cre:TNFR2fl/fl mice (Fig. 4G), suggesting that oligodendroglial TNFR2 may play a role in the survival of existing OLs and/or differentiation of OPCs into new OLs.
Myelin integrity in the spinal cord white matter was examined by EM. Morphologically, naive mice did not show myelin abnormalities, but following EAE both genotypes displayed extensive damage, with unraveling of the myelin sheaths, loss of adaxonal contact, and complete demyelination in severe cases (Fig. 5A). To measure myelin thickness, we assessed the g-ratio (axon diameter/fiber diameter) of individual axons. We plotted the g-ratio against the corresponding axon diameter and did not find any difference in naive conditions by linear regression analysis (line slope and elevation intercept on the y-axis were comparable; Fig. 5B). However, following EAE, CNP-cre:TNFR2fl/fl mice showed significantly and consistently lower g-ratios compared with TNFR2fl/fl controls, shown by reduced elevation of the linear regression (CNP-cre:TNFR2fl/fl = 0.575 ± 0.007 vs TNFR2fl/fl = 0.615 ± 0.005; p ≤ 0.0001, Student's t test) without change in slope (Fig. 5C). This was evident also by grouping axons by diameter size, with the g-ratio significantly reduced after EAE in CNP-cre:TNFR2fl/fl mice, except for axons of >2 μm (Fig. 5D). This indicates that CNP-cre:TNFR2fl/fl mice have consistently wider myelin rings compared with controls. It is important to note that axons identified morphologically as undergoing remyelination (thin compact myelin, often with interposition of oligodendrocyte cytoplasm between axon and the myelin ring) were not included in the g-ratio analysis, but were counted separately for more accurate assessment of remyelination. Remyelinating axons (Fig. 5E) were reduced in CNP-cre:TNFR2fl/fl mice compared with TNFR2fl/fl controls (Fig. 5F), suggesting that TNFR2 in oligodendrocytes plays a role, directly or indirectly, in sustaining the remyelination process.
Figure 5.

Ablation of oligodendroglial TNFR2 results in impaired myelin compaction and reduced remyelination after EAE. A, Electron micrographs of the lateral columns of the thoracic spinal cord comparing TNFR2fl/fl to CNP-cre:TNFR2fl/fl mice in naive conditions and 60 dpi EAE. Scale bar, 2 μm. B, C, Representation of the g-ratio (axon diameter/fiber diameter) vs the corresponding axon diameter in naive conditions (B) and at 60 dpi EAE (C). D, Quantification of the g-ratios of myelinated fibers grouped by increasing axon diameter; n = 4–5/group. *p ≤ 0.05, **p ≤ 0.01, ***p ≤ 0.001, one-way ANOVA, Tukey's test. E, Electron micrographs of remyelinating axons (black arrows) in the thoracic spinal cord of TNFR2fl/fl mice at 60 dpi. Scale bar, 1 μm. F, Quantification of remyelinating axons in naive conditions and at 60 dpi EAE; n = 4–5/group. *p ≤ 0.05, Student's t test.
TNFR2 regulates oligodendrocyte differentiation
To address whether oligodendroglial TNFR2 is involved in survival, proliferation, or differentiation of OPCs and OLs, we established an in vitro system of WT and TNFR2−/− OPC/OL cultures. To assess TNFR2-dependent cell survival, we counted PDGFRα+TUNEL+ OPCs and CC1+TUNEL+ OLs, and found no difference between WT and TNFR2−/− cells (Fig. 6A,C). The ratio of PDGFRα+TUNEL+ cells to the total number of PDGFRα+ OPCs or CC1+TUNEL+ cells to the total number of CC1+ OLs did not vary (Fig. 6B,D), demonstrating that TNFR2 is not required for OPC or OL survival in vitro. Nevertheless, the total number of CC1+ OLs was significantly reduced in TNFR2−/− cells (Fig. 6C), suggesting that TNFR2 could be modulating OPC proliferation, differentiation, or both. To assess proliferation, OPCs were incubated with EdU and fixed 8 h later. We found no difference between WT and TNFR2−/− OPCs in the number of PDGFRα+EdU+ actively proliferating cells (Fig. 6E), and the ratios of PDGFRα+EdU+ to total PDGFRα+ cells were similar (Fig. 6F). To assess OPC differentiation, 8 h after the addition of EdU cells were switched to differentiation medium and fixed 4 d later. We counted CC1+EdU+ OLs and found that a reduced number of EdU-incorporating OPCs differentiated into OLs in TNFR2−/− cultures compared with WT (Fig. 6E). This was also shown by the lower ratio of CC1+EdU+ cells to PDGFRα+EdU+ cells (Fig. 6G), indicating that TNFR2 is important for OPC differentiation but not proliferation. The reduced differentiation capability of cells lacking TNFR2 was further demonstrated by immunocytochemistry in differentiated cultures (Fig. 6H). WT cells showed highly differentiated flat morphology, with diffused O1 and MBP immunoreactivity. TNFR2−/− cells appeared immature, with thin elongated processes, small cell body, and reduced MBP immunoreactivity. Impaired differentiation was also demonstrated by gene expression analysis (Fig. 6I), with PDGFRα significantly higher in TNFR2−/− OLs and not different from undifferentiated OPCs, MBP drastically reduced in TNFR2−/− OLs, and notch1, which acts as a brake to OPC differentiation (Juryńczyk and Selmaj, 2010), elevated in TNFR2−/− OPCs. Collectively, these data demonstrate that TNFR2 drives OPC differentiation but does not regulate OPC survival or proliferation.
Figure 6.
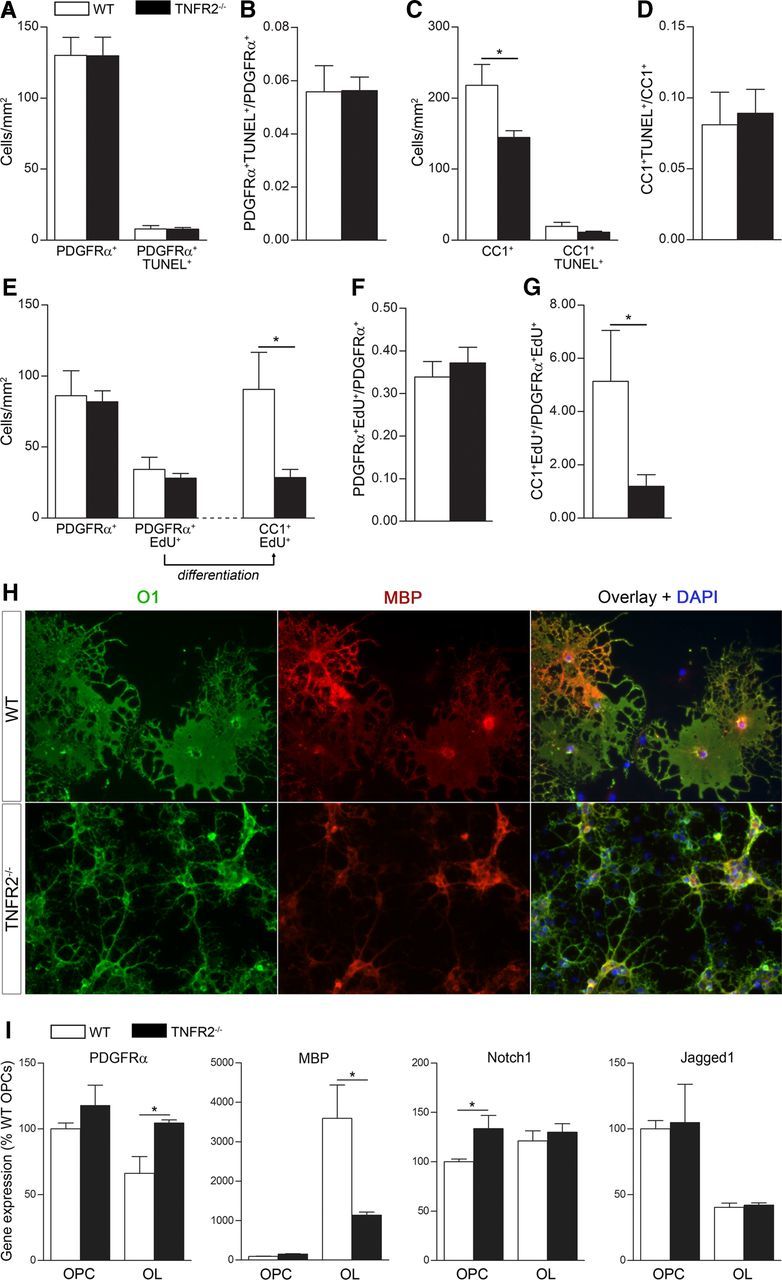
TNFR2 regulates OPC differentiation, but not proliferation or survival in vitro. A, Cell death analysis by TUNEL staining in OPC cultures from WT and TNFR2−/− mice (day 4 in culture). Results are the average ± SEM of five replicates/experiment from three experiments. B, Ratio of PDGFRα+TUNEL+ cells to the total number of PDGFRα+ cells as a measure of OPC cell death. C, Cell death analysis by TUNEL staining in differentiated OL cultures from WT and TNFR2−/− mice (4 d in differentiation medium). Results are the average ± SEM of five replicates/experiment from three independent experiments. *p ≤ 0.05, Student's t test. D, Ratio of CC1+TUNEL+ cells over total CC1+ cells as measure of OL cell death. E, Assessment of OPC proliferation/differentiation by EdU incorporation in OPC cultures from WT and TNFR2−/− mice: PDGFRα+EdU+ OPCs are counted 8 h after EdU administration, and OPCs that have differentiated into OLs are counted as CC1+EdU+ cells 4 d later after switching to differentiation medium. Results are the average ± SEM of four replicates/experiment from three independent experiments. *p ≤ 0.05, Student's t test. F, Ratio of PDGFRα+EdU+ cells over total PDGFRα+ cells as a measure of OPC proliferation. G, Ratio of CC1+EdU+ cells over PDGFRα+EdU+ cells as a measure of OPC differentiation. *p ≤ 0.05, Student's t test. H, Qualitative immunocytochemical comparison of differentiated OLs from WT and TNFR2−/− mice stained with O1 (mature OL marker) and MBP (premyelinating OL marker). I, Gene expression analysis of molecules involved in oligodendrocyte differentiation in OPCs and OLs from WT and TNFR2−/− mice.
Ablation of oligodendroglial TNFR2 dysregulates miRNA expression
To address the mechanisms of TNFR2-dependent regulation of OPC differentiation, we investigated changes in miRNA expression in the spinal cord of TNFR2fl/fl and CNP-cre:TNFR2fl/fl mice in naive and 25 dpi EAE conditions. Since miRNAs are known to regulate oligodendrocyte differentiation (Dugas et al., 2010; Zhao et al., 2010; He et al., 2012), and can modulate or be modulated by TNF signaling (Suárez et al., 2010; Chen et al., 2014), we quantified miRNA expression in oligodendrocyte-enriched spinal cord suspensions. In naive mice, we found differential expression of 29 miRNAs (Table 3). Most notably, miR-7a, which has been implicated in arresting oligodendrocyte differentiation (Zhao et al., 2012), was increased by 3.58-fold in CNP-cre:TNFR2fl/fl mice compared with TNFR2fl/fl mice. After EAE, we saw differential expression of 10 miRNAs in CNP-cre:TNFR2fl/fl mice compared with TNFR2fl/fl controls (Table 3). Interestingly, inflammatory miR-326, reportedly associated with MS and EAE pathogenesis by promoting Th17 differentiation (Du et al., 2009; Honardoost et al., 2014), was upregulated in CNP-cre:TNFR2fl/fl mice.
Table 3.
Differential microRNA expression in oligodendrocyte-enriched spinal cord suspensions: comparison between genotypes
| microRNA | CNP-cre:TNFR2fl/fl naive vs TNFR2fl/fl naive (fold change) | p value | CNP-cre:TNFR2fl/fl EAE vs TNFR2fl/fl EAE (fold change) | p value |
|---|---|---|---|---|
| mmu-miR-7a | 3.5822 | 0.0264 | ||
| mmu-miR-451 | 3.5698 | 0.0169 | ||
| mmu-miR-2145 | 3.3904 | 0.0074 | ||
| mmu-miR-100 | 3.3423 | 0.0381 | ||
| mmu-miR-1937a | 3.2336 | 0.0434 | ||
| UniSp6 CP | 2.9966 | 0.0245 | ||
| mmu-miR-10b | 1.9230 | 0.0152 | ||
| mmu-miR-486 | 1.7331 | 0.0498 | ||
| mmu-let-7e | 1.6945 | 0.0161 | ||
| rno-miR-29b-2 | 1.3659 | 0.0224 | ||
| mmu-let-7f | 1.3203 | 0.0308 | ||
| mmu-miR-320 | 1.3021 | 0.0402 | ||
| mmu-miR-425 | 1.2864 | 0.0264 | ||
| mmu-miR-99b | 1.1454 | 0.0212 | ||
| mmu-miR-221 | 1.1414 | 0.0055 | ||
| rno-miR-345-5p | −1.2198 | 0.0066 | ||
| rno-miR-382 | −1.2645 | 0.0181 | ||
| mmu-miR-30b | −1.2738 | 0.0055 | ||
| mmu-miR-669d | −1.3227 | 0.0145 | ||
| mmu-miR-488 | −1.3488 | 0.0410 | ||
| rno-miR-324-3p | −1.4325 | 0.0022 | ||
| mmu-miR-326 | −1.5493 | 0.0452 | ||
| rno-miR-551b | −1.5628 | 0.0151 | ||
| mmu-miR-218-2 | −1.5712 | 0.0210 | ||
| mmu-miR-551b | −1.5764 | 0.0328 | ||
| mmu-miR-467b | −1.7221 | 0.0161 | ||
| mmu-miR-192 | −1.7583 | 0.0012 | ||
| rno-miR-136 | −1.8361 | 0.0254 | ||
| mmu-miR-22 | −1.9174 | 0.0053 | ||
| mmu-let-7e | −1.9980 | 0.0321 | ||
| mmu-miR-669e | −2.0235 | 0.0199 | ||
| mmu-miR-190 | −2.2025 | 0.0103 | ||
| mmu-miR-362-3p | −2.3321 | 0.0015 | ||
| mmu-miR-96 | −2.3524 | 0.0010 | ||
| mmu-miR-28 | −2.3705 | 0.0316 | ||
| mmu-miR-669l | −3.0459 | 0.0415 | ||
| mmu-miR-673-5p | 2.4667 | 0.0427 | ||
| mmu-miR-198 | 2.3729 | 0.0165 | ||
| mmu-miR-1274a | 1.7736 | 0.0230 | ||
| mmu-miR-326 | 1.4866 | 0.0177 | ||
| mmu-miR-34a | 1.4484 | 0.0418 | ||
| mmu-miR-669d | 1.4473 | 0.0083 | ||
| mmu-miR-101a | 1.3692 | 0.0500 | ||
| mmu-miR-421 | −1.2466 | 0.0210 | ||
| mmu-miR-130b | −1.7654 | 0.0434 | ||
| mmu-miR-322 | −1.7818 | 0.0165 |
As anticipated, we found a large number of miRNAs altered as a consequence of EAE within each genotype. Nevertheless, when we focused on those involved in OPC differentiation and myelination (Table 4), we found different expression patterns in TNFR2fl/fl and CNP-cre:TNFR2fl/fl mice. Two members of the miR-219 and miR-138 clusters, and miR-338–5p, all required for oligodendrocyte differentiation (Dugas et al., 2010; Zhao et al., 2010; de Faria et al., 2012; Pusic and Kraig, 2015), were downregulated in CNP-cre:TNFR2fl/fl mice, but not in TNFR2fl/fl controls, suggesting that oligodendroglial TNFR2 may be regulating OPC differentiation in disease conditions via modulation of these molecules. Similarly, miR-7a changed only in CNP-cre:TNFR2fl/fl mice with significant downregulation after EAE. Since miR-7a showed the highest differential expression in naive conditions (Table 3), we further investigated whether it played a direct role in the protective function of oligodendroglial TNFR2 in EAE. We quantified miR-7a expression in vivo by in situ hybridization in naive and 25 dpi EAE conditions, when the peak of the inflammatory response is over and the repair process is underway. In agreement with previous studies localizing miR-7a in the CNS mainly in OPCs (Zhao et al., 2012), in the spinal cord white matter we found miR-7a to be almost exclusively expressed in PDGFRα+ OPCs (Fig. 7A). The number of miR-7a+ cells in the intact white matter was significantly increased in CNP-cre:TNFR2fl/fl mice compared with TNFR2fl/fl controls in naive conditions (Fig. 7B), mirroring the PCR array data (Table 3). However, at 25 dpi EAE expression reversed, with a significant reduction in the number miR-7a+ cells in CNP-cre:TNFR2fl/fl mice (Fig. 7B). To better understand whether TNFR2 could be directly modulating miR-7a within the oligodendrocyte population during differentiation, we measured miR-7a expression by real-time PCR in OPCs and OLs from WT and TNFR2−/− mice. Unlike the EAE condition in vivo where oligodendrocytes are exposed to a highly proinflammatory environment, in vitro we tested miR-7a expression in nonstimulated conditions. In WT cultures, miR-7a expression dropped as cells differentiated to the OL stage (Fig. 7C). However, in the absence of TNFR2, miR-7a stayed elevated at the OL stage (Fig. 7C) and coincided with the failure of cell maturation (Fig. 6H,I). In line with the report by Zhao et al. (2012) showing that blockade of miR-7a in differentiating neural progenitors leads to reduced OL numbers, our data suggest that TNFR2 may drive OPC differentiation at least in part by repressing miR-7a function.
Table 4.
Expression of microRNAs controlling oligodendrocyte differentiation and myelination: comparison within genotype
| microRNA | CNP-cre:TNFR2fl/fl EAE vs CNP-cre:TNFR2fl/fl naive (fold change) | p value | TNFR2fl/fl EAE vs TNFR2fl/fl naive (fold change) | p value |
|---|---|---|---|---|
| mmu-miR-146a | 66.6901 | 0.0000002 | 123.7152 | 0.00001 |
| mmu-miR-17 | 10.2789 | 0.0036821 | 17.7639 | 0.00214 |
| mmu-miR-19b | 9.0750 | 0.0005313 | 7.5600 | 0.00043 |
| mmu-miR-23a | No difference | 5.7294 | 0.00152 | |
| mmu-miR-9 | No difference | −2.4227 | 0.00871 | |
| mmu-miR-338-3p | No difference | −3.1473 | 0.02190 | |
| mmu-miR-338-5p | −4.3925 | 0.0406403 | No difference | |
| mmu-miR-7a-1 | −1.3028 | 0.0205852 | No difference | |
| mmu-miR-7a | −3.5018 | 0.0272708 | No difference | |
| mmu-miR-138-1 | −2.6980 | 0.0201186 | No difference | |
| mmu-miR-138 | −7.9068 | 0.0031193 | No difference | |
| mmu-miR-219-5p | −2.4084 | 0.0147652 | No difference | |
| mmu-miR-219-3p | −11.3797 | 0.0153228 | No difference |
Figure 7.

Oligodendroglial TNFR2 modulates miR-7a expression in the spinal cord white matter. A, Expression of miR-7a by in situ hybridization in naive CNP-cre:TNFR2fl/fl mice and colocalization with PDGFRα+ OPCs (immunohistochemically labeled) in the spinal cord white matter. Scale bars: lower magnification, left panel, 50 μm; higher magnification, right panel, 10 μm. White arrows, Examples of OPCs positive for miR-7a. B, Quantification of the number of miR-7a+ cells in the intact spinal cord white matter in naive and EAE conditions (n = 4/group). *p ≤ 0.05, ***p ≤ 0.001, one-way ANOVA, Bonferroni's test. C, Quantification of miR-7a and miR-138 expression by real-time PCR in OPCs and OLs from WT and TNFR2−/− mice; n = 4. #p ≤ 0.05, Student's t test; *p ≤ 0.05, **p ≤ 0.01, one-way ANOVA, Tukey's test.
We also tested in vitro the expression of miR-138, which we found differentially regulated in our microRNA screening after EAE (Table 3). miR-138 was significantly higher in TNFR2−/− OPCs compared with WT cells (Fig. 6C). In differentiated OLs, expression was increased with no difference between WT and TNFR2−/− cells (Fig. 7C). This suggests that miR-138, an important signal in oligodendrocyte differentiation, is likely not regulated by TNFR2.
Discussion
Using new oligodendrocyte-specific TNFR2 conditional KO mice in combination with the solTNF inhibitor XPro1595, we demonstrate that TNFR2 expressed in the oligodendrocyte lineage contributes to tmTNF-mediated beneficial effects in EAE, providing the first direct in vivo evidence that oligodendroglial TNFR2 is protective in neuroimmune disease. We previously demonstrated that tmTNF signaling is necessary for functional recovery, axon preservation, and remyelination in EAE (Brambilla et al., 2011), and here we address the molecular mechanisms of this effect by showing they depend, at least in part, on direct activation of TNFR2 in oligodendrocytes. Aside from a study by Arnett et al. (2001) in whole-animal TNFR2−/− mice suggesting a protective role for TNFR2 in demyelination, and a study by Maier et al. (2013) reporting that the activation of TNFR2 in OPCs is protective against oxidative stress, the function of oligodendroglial TNFR2 is largely unknown. With the generation of CNP-cre:TNFR2fl/fl mice, we were able to directly investigate the biological function of oligodendroglial TNFR2 both in normal and pathological conditions. Under naive conditions, ablation of TNFR2 did not alter oligodendrocyte cell number or impair locomotor function and spontaneous activity, indicating that TNFR2 is not implicated in the regulation of oligodendroglial function during development. After EAE, however, TNFR2 ablation resulted in a worsening of the clinical outcome that was not rescued by treatment with XPro1595. This indicates that tmTNF-mediated beneficial effects require the presence of TNFR2 in oligodendrocytes. It also underscores that worsening of the EAE outcome in CNP-cre:TNFR2fl/fl mice cannot simply be attributed to an “unmasking” of TNFR1 detrimental function. If that was the case, XPro1595 would be effective in protecting mice from EAE, because it selectively inhibits solTNF, which activates TNFR1.
In CNP-cre:TNFR2fl/fl mice, EAE symptoms manifested earlier and were more severe than in control mice at chronic disease. This suggests that oligodendroglial TNFR2 likely contributes to protection from EAE via multiple mechanisms: it may serve as anti-inflammatory signal, hence affecting the onset of the disease; and may provide signals benefitting axon and myelin integrity, thereby affecting the chronic phase of the pathology. The notion that oligodendroglial TNFR2 may be implicated in suppressing the inflammatory response is supported by two lines of evidence: first, CNP-cre:TNFR2fl/fl mice showed a higher percentage of infiltrating CD4+ and CD8+ T cells at peak disease; and, second, proinflammatory miRNAs were found to be upregulated in CNP-cre:TNFR2fl/fl mice at the acute stage of disease. The most notable example is miR-326, which has been linked to MS and EAE pathogenesis as a promoter of Th17 differentiation (Du et al., 2009; Honardoost et al., 2014). miR-326 has been found upregulated in the blood of patients undergoing relapse (Honardoost et al., 2014) and diminished after natalizumab treatment (Ingwersen et al., 2015). Whether the anti-inflammatory effect of oligodendroglial TNFR2 occurs directly in oligodendrocytes or indirectly via other cell populations remains to be seen. Regardless, our data highlight that oligodendrocytes have functions that go beyond myelination, repair, and metabolic support of neurons, which is in tune with the roles of the other glial cell populations. TNFR2 activation in microglia has been shown to induce the production of the neuroprotective molecules granulocyte colony-stimulating factor, adrenomedullin, and IL-10 (Veroni et al., 2010). Hence, we can speculate that a similar mechanism may be at play in oligodendrocytes, and the reduced production of anti-inflammatory signals in CNP-cre:TNFR2fl/fl mice may explain the greater influx of encephalitogenic T cells into the CNS. Ultimately, a better understanding of the role of oligodendroglial TNFR2 in inflammation is important to have a complete picture of the function of this receptor in neuroimmune disease, and this is the focus of ongoing studies in our laboratory.
In addition to an anti-inflammatory function, our data point to an effect of oligodendroglial TNFR2 in neuroprotection, myelin repair, and remyelination. Indeed, the ablation of TNFR2 in CNP-cre:TNFR2fl/fl mice resulted in increased axonal loss and myelin damage, as well as reduced remyelination. The reduced g-ratios measured in CNP-cre:TNFR2fl/fl mice indicate the presence of thicker myelin rings. Because it is unlikely that this depends on oligodendrocytes producing more myelin and wrapping more layers around the axons, it is plausible that thicker rings are the consequence of a loss of myelin compaction and/or axonal atrophy, suggesting that TNFR2 plays a role in the maintenance of myelin and axon integrity in disease conditions. In the absence of oligodendroglial TNFR2, the pool of OPCs was drastically depleted following EAE, and in vitro experiments demonstrated that TNFR2 is required for OPC differentiation. This is significant because efficient OPC differentiation is the prerequisite for repair in demyelinating pathologies (Kremer et al., 2015). Failure of this process prevents remyelination, leading to axonal damage and ultimately to neuronal loss, which is the cause of permanent disability in MS. While reports have shown that TNFR2 in astrocytes (Patel et al., 2012; Fischer et al., 2014) may activate cascades that indirectly stimulate OPC differentiation, here we show for the first time that direct TNFR2 activation in OPCs is crucial in promoting differentiation, thereby sustaining the remyelination process. We did not observe a developmental impairment of OPC differentiation in vivo, because oligodendrocytes numbers were comparable in naive TNFR2fl/fl and CNP-cre:TNFR2fl/fl mice. This apparent contradiction with our in vitro data can be reconciled in two ways. First, CNP-cre mice allow for TNFR2 ablation in <40% of OPCs, and this may not translate into a developmental phenotype. Better suited to address OPC differentiation in vivo are PDGFRα-creER drivers, where recombination is highly efficient and specific in OPCs. Experiments with this mouse line are currently ongoing in the laboratory. Second, unlike the in vitro model where purified OPCs do not receive inputs from other cell types, OPC differentiation in vivo is controlled by the concerted action of numerous environmental signals converging on the OPCs. Therefore, it is likely that other mechanisms compensate for TNFR2 absence, allowing for normal OPC differentiation.
The cascades initiated by TNFR2 to drive differentiation include the modulation of miRNAs, such as miR-7a. It was recently reported that the overexpression of miR-7a in OPCs promotes proliferation and inhibits differentiation into a mature OL phenotype (Zhao et al., 2012), and overexpression in retinal glial precursors reduces the differentiation of Müller glia (Baba et al., 2015). Additionally, in adult rats it has been shown that miR-7a expression is downregulated in mature OLs compared with OPCs (Lau et al., 2008). Our expression data, both from PCR array and in situ hybridization, show that in the absence of oligodendroglial TNFR2 miR-7a expression in the spinal cord white matter is elevated under naive conditions. Since we found almost exclusive expression of miR-7a in PDGFRα+ OPCs in the white matter, in agreement with previous reports (Zhao et al., 2012), this suggests a direct regulation of miR-7a expression in OPCs by TNFR2. Furthermore, because we showed that OPCs and OLs do not change in numbers in naive conditions when TNFR2 is ablated, this suggests that TNFR2-dependent modulation of miR-7a in oligodendrocytes does not play a role during development. We could speculate that this mechanism might be important only after injury to the CNS, such as in EAE, when TNFR2 expression is upregulated in all glial populations, including oligodendrocytes. After EAE, the lack of oligodendroglial TNFR2 results in reduced numbers of miR-7a-expressing cells in the white matter (mostly OPCs). This may depend on the higher OPC loss seen in CNP-creTNFR2fl/fl mice, but it may also be an adaptive response in an attempt to boost OPC differentiation to sustain the repair and remyelination process. In vitro, in noninflammatory conditions, we showed that the drop in miR-7a expression occurring when OPCs transition to OLs does not take place in the absence of TNFR2, demonstrating that TNFR2 directly regulates miR-7a. Nevertheless, we cannot exclude that oligodendroglial TNFR2 might also be modulating miR-7a expression indirectly.
In addition to miR-7a, others known to regulate oligodendrocyte differentiation were found to be dysregulated as a consequence of TNFR2 ablation, specifically members of the miR-219 and miR-138 clusters, as well as miR-338–5p. All of these miRNAs are highly expressed in the spinal cord, and some are required for normal oligodendrocyte differentiation and myelination in both rodents and humans (Dugas et al., 2010; Zhao et al., 2010; de Faria et al., 2012). We found these molecules to be highly downregulated after EAE in CNP-cre:TNFR2fl/fl mice, but not in TNFR2fl/fl mice, providing yet another indication that TNFR2 is necessary for activating OPC differentiation programs without which remyelination cannot effectively take place.
In summary, our study provides the first direct evidence that TNFR2 is an important signal for oligodendrocyte differentiation. Following activation by tmTNF, TNFR2 initiates specific pathways, which include miRNA modulation, that drive oligodendrocytes into a reparative mode contributing to remyelination following disease, thereby preventing axonal loss and disability. This identifies TNFR2 as a viable new therapeutic target in neuroimmune disease. Selective TNFR2 agonists and selective solTNF inhibitors, which skew the balance toward TNFR2 activation, could be used separately or in combination to promote myelin repair. This may represent a new, much-needed pharmacological tool for the primary progressive form of MS where disability is directly dependent on irreparable axonal damage associated with demyelination and for which no effective treatments are available.
Footnotes
This work was supported by FISM (Fondazione Italiana Sclerosi Multipla) Grant 2012/R/2 (R.B.); National Institutes of Health/National Institute of Neurological Disorders and Stroke Grant NS-084303-01A1 (R.B.); the Miami Project To Cure Paralysis (R.B.); the Danish Multiple Sclerosis Society Grant R431-A29647-B20593 (P.M.M., K.L.L., R.B.); Fonden til Lægevidenskabens Fremme (P.M.M.); and Fonden for Neurologisk Forskning (P.M.M.). We thank Margaret Bates and Vania Almeida at the Electron Microscopy Core Facility of The Miami Project To Cure Paralysis for assistance in electron microscope imaging. We also thank Mehran Taherian for skillful technical assistance and Dr. Paula Monje for providing the anti-O1 hybridoma supernatant. In addition, we thank Dr. Klaus Nave (Max Planck Institute of Experimental Medicine, Göttingen, Germany) for providing the CNP-cre+/− mouse line.
D.E.S. is an employee of Xencor and also holds stocks and stock options in the company. All other authors have no financial conflicts of interest to declare.
References
- Akassoglou K, Bauer J, Kassiotis G, Pasparakis M, Lassmann H, Kollias G, Probert L. Oligodendrocyte apoptosis and primary demyelination induced by local TNF/p55TNF receptor signaling in the central nervous system of transgenic mice: models for multiple sclerosis with primary oligodendrogliopathy. Am J Pathol. 1998;153:801–813. doi: 10.1016/S0002-9440(10)65622-2. [DOI] [PMC free article] [PubMed] [Google Scholar]
- Alexopoulou L, Kranidioti K, Xanthoulea S, Denis M, Kotanidou A, Douni E, Blackshear PJ, Kontoyiannis DL, Kollias G. Transmembrane TNF protects mutant mice against intracellular bacterial infections, chronic inflammation and autoimmunity. Eur J Immunol. 2006;36:2768–2780. doi: 10.1002/eji.200635921. [DOI] [PubMed] [Google Scholar]
- Arnett HA, Mason J, Marino M, Suzuki K, Matsushima GK, Ting JP. TNF alpha promotes proliferation of oligodendrocyte progenitors and remyelination. Nat Neurosci. 2001;4:1116–1122. doi: 10.1038/nn738. [DOI] [PubMed] [Google Scholar]
- Baba Y, Aihara Y, Watanabe S. MicroRNA-7a regulates Muller glia differentiation by attenuating Notch3 expression. Exp Eye Res. 2015;138:59–65. doi: 10.1016/j.exer.2015.06.022. [DOI] [PubMed] [Google Scholar]
- Baker D, Butler D, Scallon BJ, O'Neill JK, Turk JL, Feldmann M. Control of established experimental allergic encephalomyelitis by inhibition of tumor necrosis factor (TNF) activity within the central nervous system using monoclonal antibodies and TNF receptor-immunoglobulin fusion proteins. Eur J Immunol. 1994;24:2040–2048. doi: 10.1002/eji.1830240916. [DOI] [PubMed] [Google Scholar]
- Brambilla R, Ashbaugh JJ, Magliozzi R, Dellarole A, Karmally S, Szymkowski DE, Bethea JR. Inhibition of soluble tumour necrosis factor is therapeutic in experimental autoimmune encephalomyelitis and promotes axon preservation and remyelination. Brain. 2011;134:2736–2754. doi: 10.1093/brain/awr199. [DOI] [PMC free article] [PubMed] [Google Scholar]
- Brambilla R, Morton PD, Ashbaugh JJ, Karmally S, Lambertsen KL, Bethea JR. Astrocytes play a key role in EAE pathophysiology by orchestrating in the CNS the inflammatory response of resident and peripheral immune cells and by suppressing remyelination. Glia. 2014;62:452–467. doi: 10.1002/glia.22616. [DOI] [PubMed] [Google Scholar]
- Chen Y, Du J, Zhang Z, Liu T, Shi Y, Ge X, Li YC. MicroRNA-346 mediates tumor necrosis factor alpha-induced downregulation of gut epithelial vitamin D receptor in inflammatory bowel diseases. Inflamm Bowel Dis. 2014;20:1910–1918. doi: 10.1097/MIB.0000000000000158. [DOI] [PMC free article] [PubMed] [Google Scholar]
- Dal Canto RA, Shaw MK, Nolan GP, Steinman L, Fathman CG. Local delivery of TNF by retrovirus-transduced T lymphocytes exacerbates experimental autoimmune encephalomyelitis. Clin Immunol. 1999;90:10–14. doi: 10.1006/clim.1998.4653. [DOI] [PubMed] [Google Scholar]
- de Faria O, Jr, Cui QL, Bin JM, Bull SJ, Kennedy TE, Bar-Or A, Antel JP, Colman DR, Dhaunchak AS. Regulation of miRNA 219 and miRNA clusters 338 and 17–92 in oligodendrocytes. Front Genet. 2012;3:46. doi: 10.3389/fgene.2012.00046. [DOI] [PMC free article] [PubMed] [Google Scholar]
- Du C, Liu C, Kang J, Zhao G, Ye Z, Huang S, Li Z, Wu Z, Pei G. MicroRNA miR-326 regulates TH-17 differentiation and is associated with the pathogenesis of multiple sclerosis. Nat Immunol. 2009;10:1252–1259. doi: 10.1038/ni.1798. [DOI] [PubMed] [Google Scholar]
- Dugas JC, Cuellar TL, Scholze A, Ason B, Ibrahim A, Emery B, Zamanian JL, Foo LC, McManus MT, Barres BA. Dicer1 and miR-219 Are required for normal oligodendrocyte differentiation and myelination. Neuron. 2010;65:597–611. doi: 10.1016/j.neuron.2010.01.027. [DOI] [PMC free article] [PubMed] [Google Scholar]
- Eugster HP, Frei K, Bachmann R, Bluethmann H, Lassmann H, Fontana A. Severity of symptoms and demyelination in MOG-induced EAE depends on TNFR1. Eur J Immunol. 1999;29:626–632. doi: 10.1002/(SICI)1521-4141(199902)29:02<626::AID-IMMU626>3.0.CO;2-A. [DOI] [PubMed] [Google Scholar]
- Fischer R, Wajant H, Kontermann R, Pfizenmaier K, Maier O. Astrocyte-specific activation of TNFR2 promotes oligodendrocyte maturation by secretion of leukemia inhibitory factor. Glia. 2014;62:272–283. doi: 10.1002/glia.22605. [DOI] [PubMed] [Google Scholar]
- Grell M, Douni E, Wajant H, Löhden M, Clauss M, Maxeiner B, Georgopoulos S, Lesslauer W, Kollias G, Pfizenmaier K, Scheurich P. The transmembrane form of tumor necrosis factor is the prime activating ligand of the 80 kDa tumor necrosis factor receptor. Cell. 1995;83:793–802. doi: 10.1016/0092-8674(95)90192-2. [DOI] [PubMed] [Google Scholar]
- Hagemeyer N, Goebbels S, Papiol S, Kästner A, Hofer S, Begemann M, Gerwig UC, Boretius S, Wieser GL, Ronnenberg A, Gurvich A, Heckers SH, Frahm J, Nave KA, Ehrenreich H. A myelin gene causative of a catatonia-depression syndrome upon aging. EMBO Mol Med. 2012;4:528–539. doi: 10.1002/emmm.201200230. [DOI] [PMC free article] [PubMed] [Google Scholar]
- Hansen TB, Jensen TI, Clausen BH, Bramsen JB, Finsen B, Damgaard CK, Kjems J. Natural RNA circles function as efficient microRNA sponges. Nature. 2013;495:384–388. doi: 10.1038/nature11993. [DOI] [PubMed] [Google Scholar]
- He X, Yu Y, Awatramani R, Lu QR. Unwrapping myelination by microRNAs. Neuroscientist. 2012;18:45–55. doi: 10.1177/1073858410392382. [DOI] [PMC free article] [PubMed] [Google Scholar]
- Hofman FM, Hinton DR, Johnson K, Merrill JE. Tumor necrosis factor identified in multiple sclerosis brain. J Exp Med. 1989;170:607–612. doi: 10.1084/jem.170.2.607. [DOI] [PMC free article] [PubMed] [Google Scholar]
- Holtmann MH, Neurath MF. Differential TNF-signaling in chronic inflammatory disorders. Curr Mol Med. 2004;4:439–444. doi: 10.2174/1566524043360636. [DOI] [PubMed] [Google Scholar]
- Honardoost MA, Kiani-Esfahani A, Ghaedi K, Etemadifar M, Salehi M. miR-326 and miR-26a, two potential markers for diagnosis of relapse and remission phases in patient with relapsing-remitting multiple sclerosis. Gene. 2014;544:128–133. doi: 10.1016/j.gene.2014.04.069. [DOI] [PubMed] [Google Scholar]
- Ingwersen J, Menge T, Wingerath B, Kaya D, Graf J, Prozorovski T, Keller A, Backes C, Beier M, Scheffler M, Dehmel T, Kieseier BC, Hartung HP, Küry P, Aktas O. Natalizumab restores aberrant miRNA expression profile in multiple sclerosis and reveals a critical role for miR-20b. Ann Clin Transl Neurol. 2015;2:43–55. doi: 10.1002/acn3.152. [DOI] [PMC free article] [PubMed] [Google Scholar]
- Juryńczyk M, Selmaj K. Notch: a new player in MS mechanisms. J Neuroimmunol. 2010;218:3–11. doi: 10.1016/j.jneuroim.2009.08.010. [DOI] [PubMed] [Google Scholar]
- Kassiotis G, Pasparakis M, Kollias G, Probert L. TNF accelerates the onset but does not alter the incidence and severity of myelin basic protein-induced experimental autoimmune encephalomyelitis. Eur J Immunol. 1999;29:774–780. doi: 10.1002/(SICI)1521-4141(199903)29:03<774::AID-IMMU774>3.0.CO;2-T. [DOI] [PubMed] [Google Scholar]
- Körner H, Riminton DS, Strickland DH, Lemckert FA, Pollard JD, Sedgwick JD. Critical points of tumor necrosis factor action in central nervous system autoimmune inflammation defined by gene targeting. J Exp Med. 1997;186:1585–1590. doi: 10.1084/jem.186.9.1585. [DOI] [PMC free article] [PubMed] [Google Scholar]
- Kremer D, Küry P, Dutta R. Promoting remyelination in multiple sclerosis: current drugs and future prospects. Mult Scler. 2015;21:541–549. doi: 10.1177/1352458514566419. [DOI] [PubMed] [Google Scholar]
- Kriegler M, Perez C, DeFay K, Albert I, Lu SD. A novel form of TNF/cachectin is a cell surface cytotoxic transmembrane protein: ramifications for the complex physiology of TNF. Cell. 1988;53:45–53. doi: 10.1016/0092-8674(88)90486-2. [DOI] [PubMed] [Google Scholar]
- Lambertsen KL, Clausen BH, Babcock AA, Gregersen R, Fenger C, Nielsen HH, Haugaard LS, Wirenfeldt M, Nielsen M, Dagnaes-Hansen F, Bluethmann H, Faergeman NJ, Meldgaard M, Deierborg T, Finsen B. Microglia protect neurons against ischemia by synthesis of tumor necrosis factor. J Neurosci. 2009;29:1319–1330. doi: 10.1523/JNEUROSCI.5505-08.2009. [DOI] [PMC free article] [PubMed] [Google Scholar]
- Lappe-Siefke C, Goebbels S, Gravel M, Nicksch E, Lee J, Braun PE, Griffiths IR, Nave KA. Disruption of Cnp1 uncouples oligodendroglial functions in axonal support and myelination. Nat Genet. 2003;33:366–374. doi: 10.1038/ng1095. [DOI] [PubMed] [Google Scholar]
- Lau P, Verrier JD, Nielsen JA, Johnson KR, Notterpek L, Hudson LD. Identification of dynamically regulated microRNA and mRNA networks in developing oligodendrocytes. J Neurosci. 2008;28:11720–11730. doi: 10.1523/JNEUROSCI.1932-08.2008. [DOI] [PMC free article] [PubMed] [Google Scholar]
- Lenercept Multiple Sclerosis Study Group, University of British Columbia MS/MRI Analysis Group. TNF neutralization in MS: results of a randomized, placebo-controlled multicenter study. Neurology. 1999;53:457–465. doi: 10.1212/WNL.53.3.457. [DOI] [PubMed] [Google Scholar]
- Liu C, Tang J. Expression levels of tumor necrosis factor-alpha and the corresponding receptors are correlated with trauma severity. Oncol Lett. 2014;8:2747–2751. doi: 10.3892/ol.2014.2575. [DOI] [PMC free article] [PubMed] [Google Scholar]
- Liu J, Marino MW, Wong G, Grail D, Dunn A, Bettadapura J, Slavin AJ, Old L, Bernard CC. TNF is a potent anti-inflammatory cytokine in autoimmune-mediated demyelination. Nat Med. 1998;4:78–83. doi: 10.1038/nm0198-078. [DOI] [PubMed] [Google Scholar]
- Livak KJ, Schmittgen TD. Analysis of relative gene expression data using real-time quantitative PCR and the 2(-Delta Delta C(T)) method. Methods. 2001;25:402–408. doi: 10.1006/meth.2001.1262. [DOI] [PubMed] [Google Scholar]
- Madsen PM, Clausen BH, Degn M, Thyssen S, Kristensen LK, Svensson M, Ditzel N, Finsen B, Deierborg T, Brambilla R, Lambertsen KL. Genetic ablation of soluble tumor necrosis factor with preservation of membrane tumor necrosis factor is associated with neuroprotection after focal cerebral ischemia. J Cereb Blood Flow Metab. 2015 doi: 10.1177/0271678X15610339. doi: 10.1177/0271678X15610339. Advance online publication. Retrieved 2 April 2016. [DOI] [PMC free article] [PubMed] [Google Scholar]
- Maier O, Fischer R, Agresti C, Pfizenmaier K. TNF receptor 2 protects oligodendrocyte progenitor cells against oxidative stress. Biochem Biophys Res Commun. 2013;440:336–341. doi: 10.1016/j.bbrc.2013.09.083. [DOI] [PubMed] [Google Scholar]
- Maimone D, Gregory S, Arnason BG, Reder AT. Cytokine levels in the cerebrospinal fluid and serum of patients with multiple sclerosis. J Neuroimmunol. 1991;32:67–74. doi: 10.1016/0165-5728(91)90073-G. [DOI] [PubMed] [Google Scholar]
- McCoy MK, Tansey MG. TNF signaling inhibition in the CNS: implications for normal brain function and neurodegenerative disease. J Neuroinflammation. 2008;5:45. doi: 10.1186/1742-2094-5-45. [DOI] [PMC free article] [PubMed] [Google Scholar]
- Mestdagh P, Van Vlierberghe P, De Weer A, Muth D, Westermann F, Speleman F, Vandesompele J. A novel and universal method for microRNA RT-qPCR data normalization. Genome Biol. 2009;10:R64. doi: 10.1186/gb-2009-10-6-r64. [DOI] [PMC free article] [PubMed] [Google Scholar]
- Patel JR, Williams JL, Muccigrosso MM, Liu L, Sun T, Rubin JB, Klein RS. Astrocyte TNFR2 is required for CXCL12-mediated regulation of oligodendrocyte progenitor proliferation and differentiation within the adult CNS. Acta Neuropathol. 2012;124:847–860. doi: 10.1007/s00401-012-1034-0. [DOI] [PMC free article] [PubMed] [Google Scholar]
- Probert L. TNF and its receptors in the CNS: the essential, the desirable and the deleterious effects. Neuroscience. 2015;302:2–22. doi: 10.1016/j.neuroscience.2015.06.038. [DOI] [PubMed] [Google Scholar]
- Probert L, Akassoglou K, Pasparakis M, Kontogeorgos G, Kollias G. Spontaneous inflammatory demyelinating disease in transgenic mice showing central nervous system-specific expression of tumor necrosis factor alpha. Proc Natl Acad Sci U S A. 1995;92:11294–11298. doi: 10.1073/pnas.92.24.11294. [DOI] [PMC free article] [PubMed] [Google Scholar]
- Pusic AD, Kraig RP. Phasic treatment with interferon gamma stimulates release of exosomes that protect against spreading depression. J Interferon Cytokine Res. 2015;35:795–807. doi: 10.1089/jir.2015.0010. [DOI] [PMC free article] [PubMed] [Google Scholar]
- Rangachari M, Kuchroo VK. Using EAE to better understand principles of immune function and autoimmune pathology. J Autoimmun. 2013;45:31–39. doi: 10.1016/j.jaut.2013.06.008. [DOI] [PMC free article] [PubMed] [Google Scholar]
- Ruddle NH, Bergman CM, McGrath KM, Lingenheld EG, Grunnet ML, Padula SJ, Clark RB. An antibody to lymphotoxin and tumor necrosis factor prevents transfer of experimental allergic encephalomyelitis. J Exp Med. 1990;172:1193–1200. doi: 10.1084/jem.172.4.1193. [DOI] [PMC free article] [PubMed] [Google Scholar]
- Selmaj K, Raine CS, Cannella B, Brosnan CF. Identification of lymphotoxin and tumor necrosis factor in multiple sclerosis lesions. J Clin Invest. 1991;87:949–954. doi: 10.1172/JCI115102. [DOI] [PMC free article] [PubMed] [Google Scholar]
- Sharief MK, Hentges R. Association between tumor necrosis factor-alpha and disease progression in patients with multiple sclerosis. N Engl J Med. 1991;325:467–472. doi: 10.1056/NEJM199108153250704. [DOI] [PubMed] [Google Scholar]
- Suárez Y, Wang C, Manes TD, Pober JS. Cutting edge: TNF-induced microRNAs regulate TNF-induced expression of E-selectin and intercellular adhesion molecule-1 on human endothelial cells: feedback control of inflammation. J Immunol. 2010;184:21–25. doi: 10.4049/jimmunol.0902369. [DOI] [PMC free article] [PubMed] [Google Scholar]
- Suvannavejh GC, Lee HO, Padilla J, Dal Canto MC, Barrett TA, Miller SD. Divergent roles for p55 and p75 tumor necrosis factor receptors in the pathogenesis of MOG(35–55)-induced experimental autoimmune encephalomyelitis. Cell Immunol. 2000;205:24–33. doi: 10.1006/cimm.2000.1706. [DOI] [PubMed] [Google Scholar]
- Veroni C, Gabriele L, Canini I, Castiello L, Coccia E, Remoli ME, Columba-Cabezas S, Aricò E, Aloisi F, Agresti C. Activation of TNF receptor 2 in microglia promotes induction of anti-inflammatory pathways. Mol Cell Neurosci. 2010;45:234–244. doi: 10.1016/j.mcn.2010.06.014. [DOI] [PubMed] [Google Scholar]
- Vielhauer V, Stavrakis G, Mayadas TN. Renal cell-expressed TNF receptor 2, not receptor 1, is essential for the development of glomerulonephritis. J Clin Invest. 2005;115:1199–1209. doi: 10.1172/JCI200523348. [DOI] [PMC free article] [PubMed] [Google Scholar]
- Wieser GL, Gerwig UC, Adamcio B, Barrette B, Nave KA, Ehrenreich H, Goebbels S. Neuroinflammation in white matter tracts of Cnp1 mutant mice amplified by a minor brain injury. Glia. 2013;61:869–880. doi: 10.1002/glia.22480. [DOI] [PubMed] [Google Scholar]
- Zhao X, He X, Han X, Yu Y, Ye F, Chen Y, Hoang T, Xu X, Mi QS, Xin M, Wang F, Appel B, Lu QR. MicroRNA-mediated control of oligodendrocyte differentiation. Neuron. 2010;65:612–626. doi: 10.1016/j.neuron.2010.02.018. [DOI] [PMC free article] [PubMed] [Google Scholar]
- Zhao X, Wu J, Zheng M, Gao F, Ju G. Specification and maintenance of oligodendrocyte precursor cells from neural progenitor cells: involvement of microRNA-7a. Mol Biol Cell. 2012;23:2867–2878. doi: 10.1091/mbc.E12-04-0270. [DOI] [PMC free article] [PubMed] [Google Scholar]