Abstract
Background. This study evaluated whether the change in the renin-angiotensin system (RAS) is associated with arterial aging in mice. Methods. Histologic changes and expressions of transforming growth factor-β (TGF-β), collagen IV, fibronectin, angiotensin II (Ang II), angiotensin-converting enzyme (ACE), angiotensin-converting enzyme 2 (ACE2), angiotensin II type 1 receptor (AT1R), angiotensin II type 2 receptor (AT2R), prorenin receptor (PRR), Mas receptor (MasR), endothelial nitric oxide synthase (eNOS), NADPH oxidase 2 and oxidase 4 (Nox2 and Nox4), 8-hydroxy-2′-deoxyguanosine (8-OHdG), 3-nitrotyrosine, and superoxide dismutase 1 and dismutase 2 (SOD1 and SOD2) were measured in the thoracic aortas from 2-month-old, 12-month-old, and 24-month-old C57/BL6 mice. Results. Twenty-four-month-old mice showed significantly increased aortic media thickness and expressions of TGF-β, collagen IV, and fibronectin, compared to 2-month-old and 12-month-old mice. The expressions of PRR, ACE, and Ang II, and AT1R-positive area significantly increased, whereas expressions of ACE2 and MasR and AT2R-positive area decreased with age. The expressions of phosphorylated serine1177-eNOS, SOD1, and SOD2 decreased, and the 8-OHdG-positive area and the 3-nitrotyrosine-positive area increased with age. The expression of Nox2 significantly increased with age, but that of Nox4 did not change. Conclusions. The enhanced PRR-ACE-Ang II-AT1R axis and reduced ACE2-MasR axis were associated with arterial aging in mice.
1. Introduction
Aging is the major risk factor of vascular disease and vascular structural and functional changes associated with aging are implicated in the increased cardiovascular risk of the elderly population [1]. Arterial aging is characterized by increased luminal diameter with wall remodeling, intimal and medial thickening, reorganization of the extracellular matrix, vascular stiffening, and endothelial dysfunction [2]. Various mechanisms are involved in the arterial aging process, including mitochondrial dysfunction, oxidative stress, altered calcium regulation, increased DNA protein and lipid oxidation, inflammation, and the activation of the renin-angiotensin-system (RAS) [3]. Additionally, changes in the activity or responsiveness of the RAS occur with aging [4].
Angiotensin (Ang) II is the main effector peptide in the RAS-associated vascular aging [5]. Ang II acts through two distinct receptor subtypes, Ang II type 1 receptor (AT1R) and Ang II type 2 receptor (AT2R), which have counterregulatory interactions in the cardiovascular and renal system [6]. Activation of the AT1R promotes vasoconstriction, reactive oxygen species (ROS) production, extracellular matrix remodeling, and inflammation [7]. On the other hand, the AT2R inhibits cell growth, inflammation, and fibrosis and exerts cardioprotective effects against ischemia-reperfusion injury and acute myocardial infarction [8, 9]. The angiotensin-converting enzyme (ACE) converts Ang I to Ang II, whereas the angiotensin-converting enzyme 2 (ACE2) metabolizes Ang II and generates Ang-(1-7) [10]. Ang-(1-7) does not activate AT1R or ATR2 but acts at the G-protein-coupled Mas receptor (MasR) [11]. The ACE2-Ang-(1-7)-MasR axis exerts vasodilator, antiproliferative, and antifibrotic actions opposed to those of the ACE-Ang II-AT1R axis [12]. Besides these components, there is prorenin receptor (PRR) which binds renin as well as its precursor, prorenin. The binding of prorenin or renin to PRR activates the intracellular signaling pathway and allows for the conversion of angiotensinogen to Ang I and Ang I to Ang II by the prorenin/PRR complex [13–15].
There is little data regarding the change in RAS in aorta of aging mice. As the activation of RAS is closely linked with aging process and cardiovascular disease, we hypothesized that the aorta of aging mice may exhibit altered expression of PRR-ACE-Ang II-AT1R axis and ACE2-MasR axis. This study evaluated the expression of RAS components and associated proinflammatory, profibrotic, and antioxidant molecular changes in thoracic aorta tissues of aging mice.
2. Materials and Methods
2.1. Animal Model
The Animal Care Committee of the Catholic University approved the experimental protocol. Aging C57BL/6 mice were purchased from the Korea Research Institute of Bioscience and Biotechnology (Chungcheongbuk-do, Republic of Korea). Mice were housed in a controlled temperature and controlled light environment. Mice were divided into three groups as follows: 2-month-old group (2 M group, n = 6), 12-month-old group (12 M group, n = 6), and 24-month-old group (24 M group, n = 6).
2.2. Histology and Microscopic Analysis
Thoracic aorta tissues were embedded in low-temperature melting paraffin, and 4 μm sections were processed and stained with hematoxylin-eosin (HE). HE staining was analyzed with a color-image analyzer (TDI Scope Eye, Version 3.5 for Windows, Olympus, Tokyo, Japan). The media thickness was assessed by measuring the length of the media at 10 different positions in six different sections per animal.
2.3. Immunohistochemistry
Deparaffinized tissue sections were processed for immunohistochemistry as described elsewhere [16] using primary antibodies to AT1R (Santa Cruz Biotechnology, TX, USA), AT2R (Novus Biologicals, CO, USA), MasR (Novus Biologicals, CO, USA), 8-hydroxy-2′-deoxyguanosine (8-OHdG, Japan Institute for the Control of Aging, Shizuoka, Japan), and 3-nitrotyrosine (Santa Cruz Biotechnology, TX, USA). All sections were assessed using a color-image analyzer (TDI Scope Eye, Version 3.5 for Windows, Olympus).
2.4. Western Blot Analysis
Total protein was extracted from the thoracic aorta tissues with a Pro-Prep Protein Extraction Solution (Intron Biotechnology, Gyeonggi-do, Republic of Korea) according to the manufacturer's instructions. Western blot analysis was performed using the following antibodies: transforming growth factor-β (TGF-β, R&D Systems, MN, USA), collagen IV (Abcam, Cambridge, UK), fibronectin (Proteintech Group Inc., IL, USA), Ang II (Novus Biologicals, CO, USA), ACE (Santa Cruz Biotechnology, TX, USA), ACE2 (R&D Systems, MN, USA), AT1R (Santa Cruz Biotechnology, TX, USA), AT2R (Novus Biologicals, CO, USA), PRR (Sigma Life Science, MO, USA), MasR (Novus Biologicals, CO, USA), endothelial nitric oxide synthase (eNOS, Cell Signaling Technology Inc., MA, USA), NADPH oxidase 2 (Nox2, BD Biosciences, MD, USA) and NADPH oxidase 4 (Nox4, Santa Cruz Biotechnology, TX, USA), superoxide dismutase 1 (SOD1, Enzo Life Sciences, NY, USA), superoxide dismutase 2 (SOD2, Abcam, Cambridge, UK), and β-actin (Sigma Life Science, MO, USA).
2.5. Enzyme Immunoassay
Serum levels of renin (Cloud-Clone Corp., TX, USA) and Ang II (Lifespan biosciences, WA, USA) were measured using enzyme-linked immunosorbent assay and competitive enzyme immunoassay, respectively, according to the assay protocols.
2.6. Statistical Analysis
Data are expressed as means ± standard deviation (SD). Differences between the groups were examined for statistical significance using ANOVA with Bonferroni correction (SPSS). A P value of less than 0.05 was considered statistically significant.
3. Results
3.1. Influence of Age on Thoracic Aorta Media Thickness and Expressions of TGF-β, Collagen IV, and Fibronectin
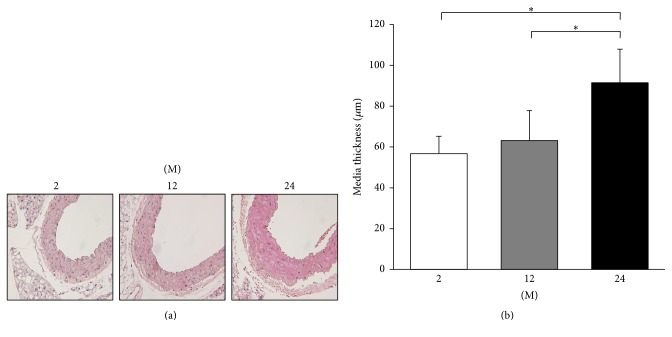
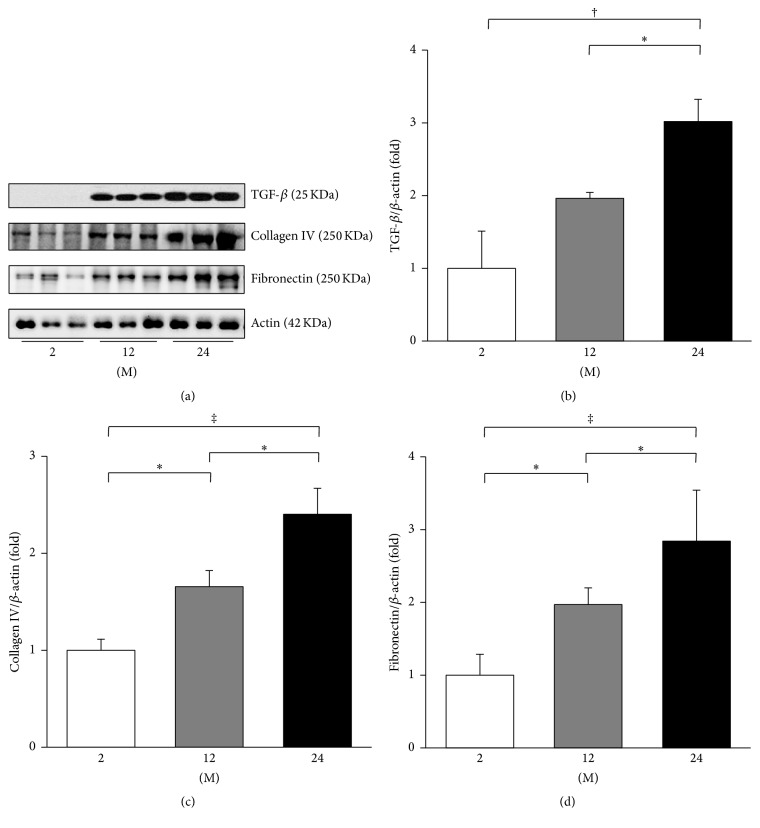
The media thickness of the thoracic aorta increased with age (Figure 1). The 24 M group showed significantly increased aortic media thickness compared to 2 M and 12 M groups (P < 0.001). To evaluate the change in profibrotic and proinflammatory proteins, western blot analyses of TGF-β, collagen IV, and fibronectin were performed (Figure 2). The expression of TGF-β significantly increased in the 24 M group compared with the 2 M (P = 0.001) and 12 M groups (P = 0.04, Figure 2(b)). The expression of collagen IV gradually increased with age (2 M versus 12 M, P = 0.03; 2 M versus 24 M, P < 0.001; 12 M versus 24 M, P = 0.015; Figure 2(c)). The expression of fibronectin significantly increased with age (2 M versus 12 M, P = 0.025; 2 M versus 24 M, P < 0.001; 12 M versus 24 M, P = 0.041; Figure 2(d)).
Figure 1.
Thoracic aorta media thickness. (a) Representative images of HE stain of thoracic aorta tissues (original magnification, 400x). (b) The 24 M group (91.47 ± 16.41 μm) showed significantly increased aortic media thickness compared to 2 M (56.74 ± 8.51 μm) and 12 M groups (63.19 ± 14.67 μm). ∗ P < 0.001. Values are shown as mean ± SD.
Figure 2.
Expressions of TGF-β, collagen IV, and fibronectin. (a) Representative western blots of TGF-β, collagen IV, and fibronectin. (b) The expression of TGF-β significantly increased in the 24 M group compared with the 2 M and 12 M groups. (c) The expression of collagen IV gradually increased with age. (d) The expression of fibronectin significantly increased with age. ∗ P < 0.05, † P < 0.01, and ‡ P < 0.001. Values are shown as mean ± SD.
3.2. Influence of Age on Expressions of PRR, ACE, ACE2, and Ang II and Serum Levels of Ang II and Renin
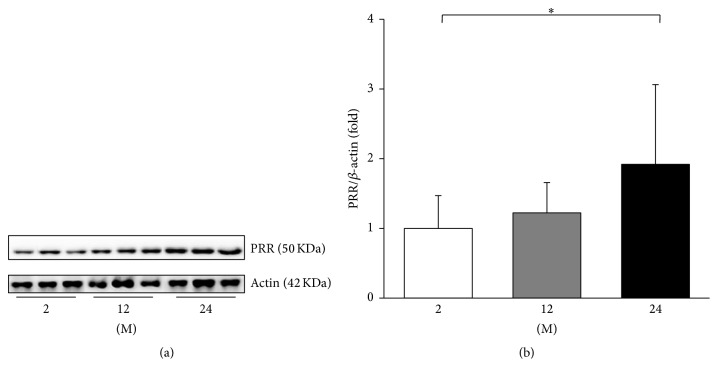
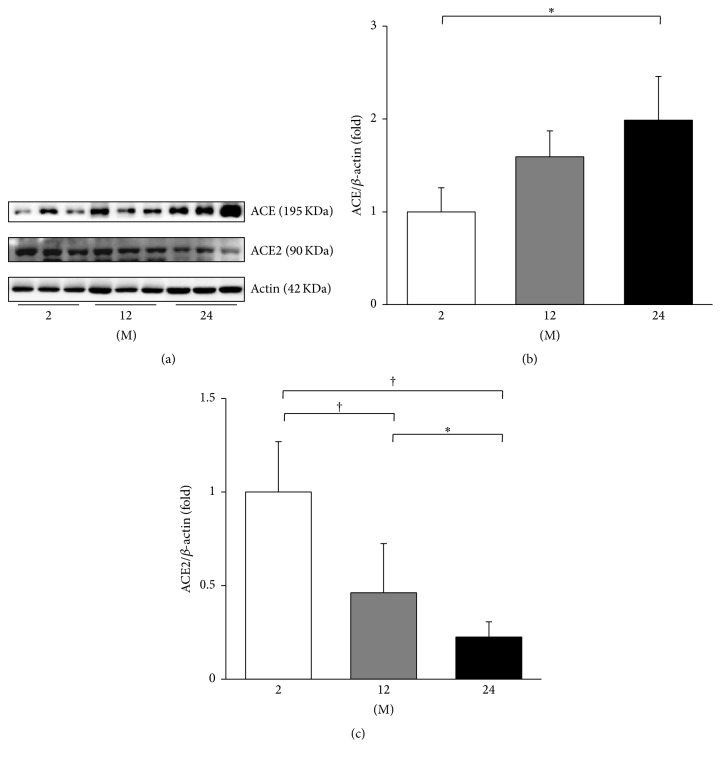
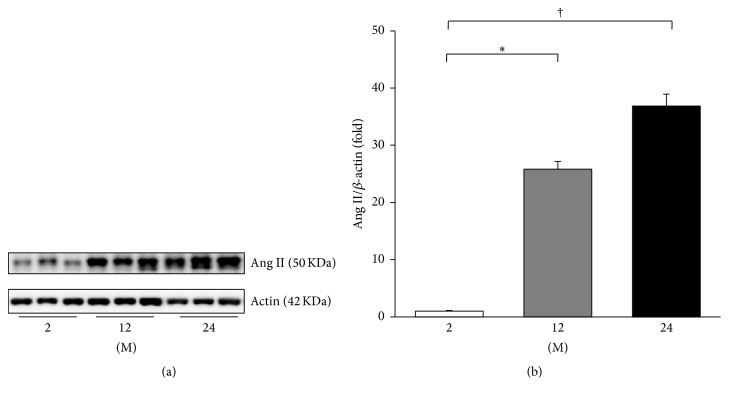
The expressions of PRR, ACE, ACE2, and Ang II were evaluated. The expression of PRR significantly increased in the 24 M group compared with the 2 M group (P = 0.045, Figure 3). ACE converts Ang I to Ang II and ACE2 metabolizes Ang II; therefore the expression of these enzymes contributes to the Ang II levels [15]. Western blot analysis showed that the expression of ACE increased in the 24 M group compared to the 2 M group (P = 0.026, Figures 4(a) and 4(b)). In contrast, the expression of ACE2 significantly decreased with age (2 M versus 12 M, P < 0.001; 2 M versus 24 M, P < 0.001; 12 M versus 24 M, P = 0.037; Figures 4(a) and 4(c)). Figure 5 shows the western blot results of Ang II. Compared with the 2 M group, the expression of Ang II gradually increased in the 12 M group (P = 0.001) and 24 M group (P < 0.001).
Figure 3.
Western blot of PRR. (a) Representative western blots of PRR. (b) There was a marked increase in the expression of PRR in the 24 M group compared with the 2 M group. ∗ P < 0.05. Values are shown as mean ± SD.
Figure 4.
Western blots of ACE and ACE2. (a) Representative western blots of ACE and ACE2. (b) There was a marked increase in the expression of ACE in the 24 M group compared with the 2 M group. (c) The expression of ACE2 markedly decreased in the 24 M group compared with the 2 M group and 12 M group. ∗ P < 0.05; † P < 0.001. Values are shown as mean ± SD.
Figure 5.
Western blot of Ang II. (a) Representative western blots of Ang II. (b) The expression of Ang II gradually increased in the 12 M group and 24 M group compared with the 2 M group. ∗ P < 0.01; † P < 0.001. Values are shown as mean ± SD.
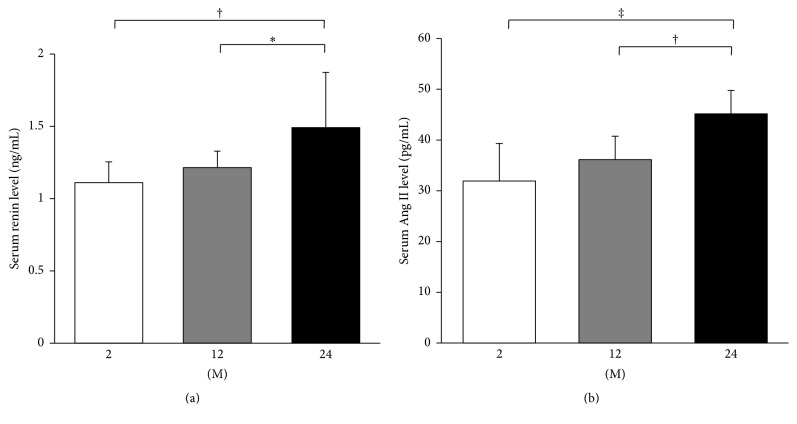
Serum levels of renin and Ang II were analyzed by enzyme immunoassay. The serum renin level significantly increased in the 24 M group compared with the 2 M group (P = 0.005) and 12 M group (P = 0.034; Figure 6(a)). Serum levels of Ang II showed similar results to those of renin. The serum Ang II level significantly increased in the 24 M group compared with the 2 M group (P < 0.001) and 12 M group (P = 0.004; Figure 6(b)).
Figure 6.
ELISA for serum levels of renin and Ang II. Serum levels of renin (a) and Ang II (b) significantly increased in the 24 M group compared to those of 2 M and 12 M groups. ∗ P < 0.05, † P < 0.01, and ‡ P < 0.001. Values are shown as mean ± SD.
3.3. Influence of Age on Expressions of AT1, AT2, and Mas Receptors
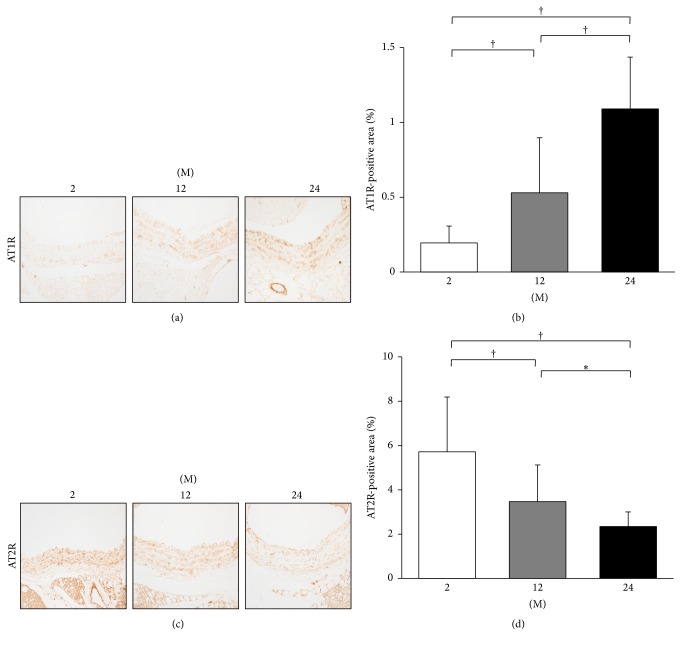
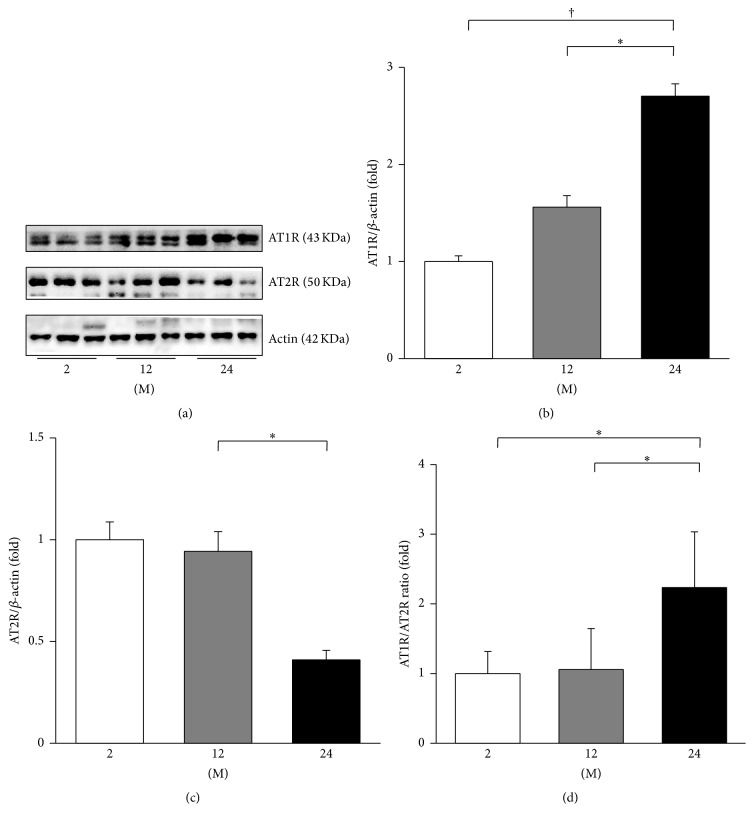
Immunohistochemistry for AT1R and AT2R was performed (Figure 7). The AT1R-positive area gradually increased with age (2 M versus 12 M; 2 M versus 24 M; 12 M versus 24 M; all P < 0.001, Figures 7(a) and 7(b)). In contrast, the AT2R-positive area significantly decreased with age (2 M versus 12 M, P < 0.001; 2 M versus 24 M, P < 0.001; 12 M versus 24 M, P = 0.009, Figures 7(c) and 7(d)). Western blot analysis of AT1R and AT2R was performed (Figure 8(a)). The expression of AT1R significantly increased in the 24 M group compared with 2 M (P < 0.001) and 12 M groups (P = 0.009; Figure 8(b)). The expression of AT2R showed a tendency of decrease in the 24 M group compared with the 2 M group (P = 0.052; Figure 8(c)). The ratio of AT1R to AT2R significantly increased in the 24 M group compared to the 2 M (P = 0.001) and 12 M groups (P = 0.001; Figure 8(d)).
Figure 7.
Immunohistochemistry for AT1R and AT2R. (a) Representative images of immunohistochemistry for AT1R (original magnification, 400x). (b) There was marked increase in the AT1R-positive area in the 24 M group (1.09 ± 0.35%) compared with 2 M group (0.19 ± 0.11%) and 12 M group (0.53 ± 0.37%). (c) Representative images of immunohistochemistry for AT2R (original magnification, 400x). (d) There was marked decrease in the AT2R-positive area in the 24 M group (2.34 ± 0.66%) compared with 2 M group (5.72 ± 2.47%) and 12 M group (3.47 ± 1.66%). ∗ P < 0.01; † P < 0.001. Values are shown as mean ± SD.
Figure 8.
Western blots of AT1R and AT2R. (a) Representative western blots of AT1R and AT2R. (b) The expression of AT1R gradually increased in the 12 M group and 24 M group compared with the 2 M group. (c) The expression of AT2R showed a tendency of decrease in the 24 M group compared with the 2 M group, but it was not statistically significant. (d) The ratio of AT1R to AT2R significantly increased in the 24 M group compared to 2 M and 12 M groups. ∗ P < 0.01; † P < 0.001. Values are shown as mean ± SD.
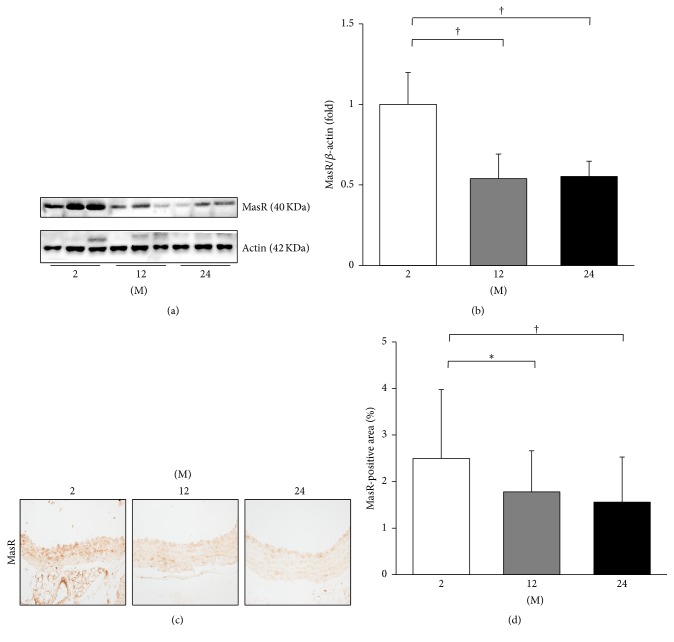
In addition, the expression of MasR was evaluated by western blot and immunohistochemistry (Figure 9). In western blot analysis, the expression of MasR significantly decreased in the 12 M group (P = 0.006) and 24 M group (P = 0.007) compared with the 2 M group (Figures 9(a) and 9(b)). The immunohistochemistry for MasR showed similar results. The MasR-positive area significantly decreased in the 12 M group (P = 0.01) and 24 M group (P = 0.001) compared with the 2 M group (Figures 9(c) and 9(d)).
Figure 9.
Western blot and immunohistochemistry for MasR. (a) Representative western blots of MasR. (b) The expression of MasR markedly decreased in the 12 M group and 24 M group compared with the 2 M group. (c) Representative images of immunohistochemistry for MasR (original magnification, 400x). (d) There was marked decrease in the MasR-positive area in the 24 M group (1.56 ± 0.97%) compared with 2 M group (2.50 ± 1.48%) and 12 M group (1.78 ± 0.88%). ∗ P < 0.05; † P < 0.01. Values are shown as mean ± SD.
3.4. Influence of Age on Expressions of eNOS, Nox2, and Nox4
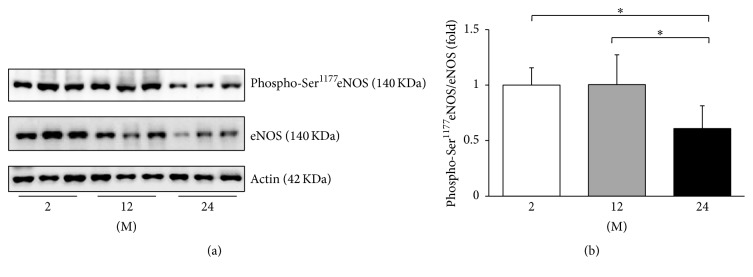
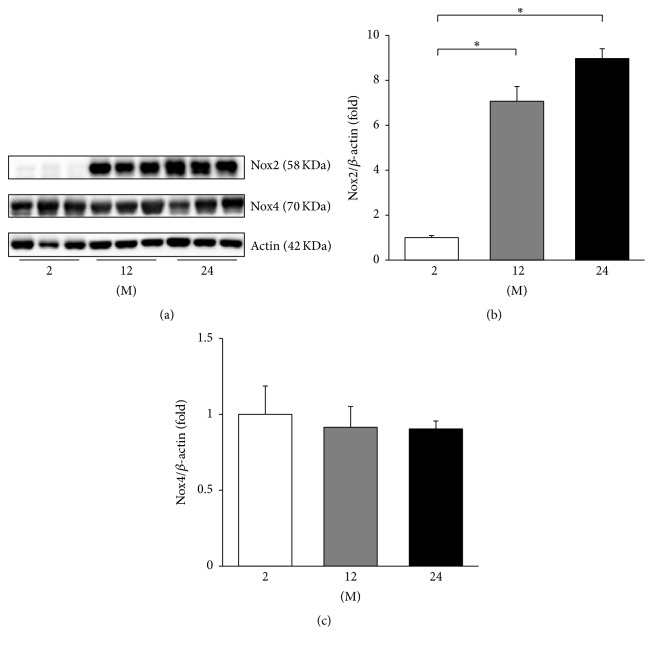
As the change in the eNOS transcription may be involved in age-related endothelial dysfunction [17], western blot analyses of phosphorylated serine 1177 (phospho-Ser1177) eNOS and eNOS were performed (Figure 10). The ratio of phospho-Ser1177eNOS to eNOS decreased in the 24 M group compared with the 2 M and 12 M groups (P = 0.019 and P = 0.018, resp.). Western blot analyses of Nox2 and Nox4 were also performed (Figure 11(a)), since the NADPH oxidases of the Nox family are known to be involved in maintaining the balance between oxidative and antioxidative systems [18]. The expression of Nox2 significantly increased in the 12 M group and 24 M group compared with the 2 M group (P < 0.001, Figure 11(b)). However, there was no significant difference in the expression of Nox4 between groups (Figure 11(c)).
Figure 10.
Western blots of phospho-Ser1177eNOS and eNOS. (a) Representative western blots of phospho-Ser1177eNOS and eNOS. (b) The ratio of phospho-Ser1177eNOS to eNOS decreased in the 24 M group compared with the 2 M and 12 M groups. ∗ P < 0.05. Values are shown as mean ± SD.
Figure 11.
Western blots of Nox2 and Nox4. (a) Representative western blots of Nox2 and Nox4. (b) The expression of Nox2 markedly increased in the 12 M group and 24 M group compared with the 2 M group. (c) There was no significant difference in the expression of Nox4 between groups. ∗ P < 0.001. Values are shown as mean ± SD.
3.5. Influence of Age on Expressions of SOD1 and SOD2 and Oxidative Stress
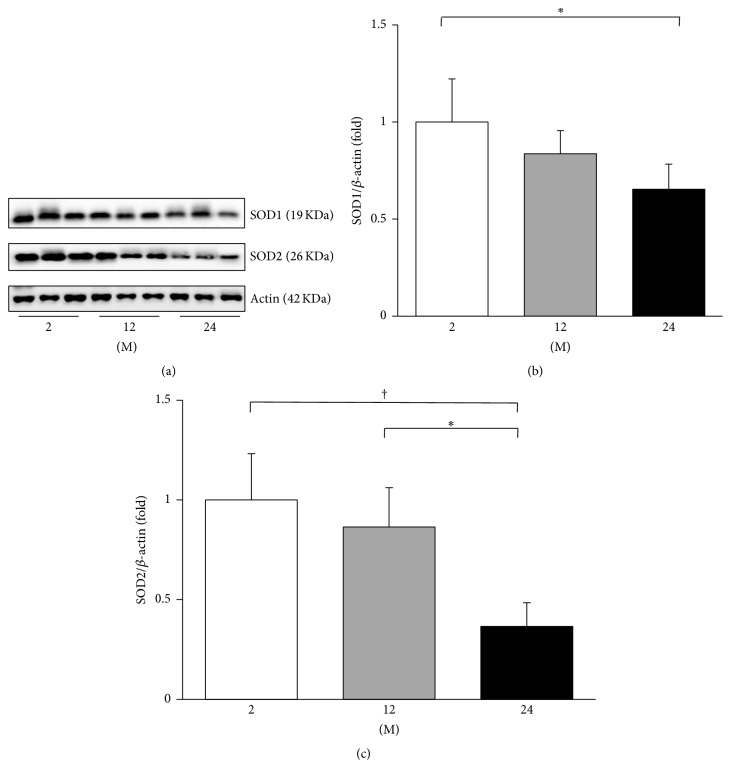
The changes in the antioxidant proteins SOD1 and SOD2 were performed by western blot analysis (Figure 12(a)). The expression of SOD1 decreased in the 24 M group compared with the 2 M group (P = 0.007, Figure 11(b)). The expression of SOD2 also decreased in the 24 M group compared with the 2 M and 12 M groups (P < 0.001 and P = 0.001, resp., Figure 12(c)).
Figure 12.
Western blots of SOD1 and SOD2. (a) Representative western blots of SOD1 and SOD2. (b) The expression of SOD1 markedly decreased in the 24 M group compared with the 2 M group. (c) The expression of SOD2 decreased in the 24 M group compared with the 2 M and 12 M groups. ∗ P < 0.01; † P < 0.001. Values are shown as mean ± SD.
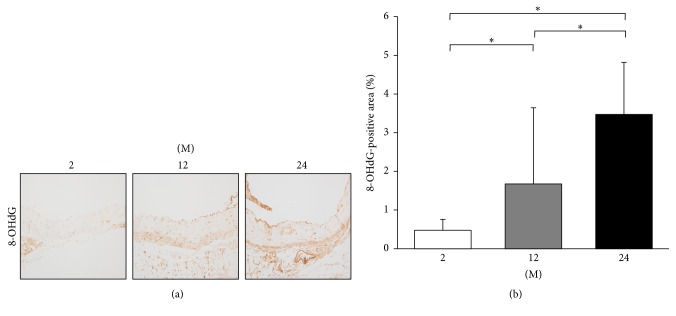
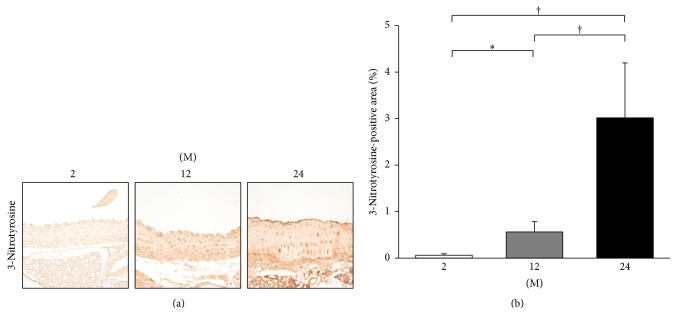
Immunohistochemistry for 8-OHdG and 3-nitrotyrosine was done for assessment of oxidative stress. Immunohistochemistry for 8-OHdG showed that the 8-OHdG-positive area gradually increased with age (2 M versus 12 M; 2 M versus 24 M; 12 M versus 24 M; all P < 0.001; Figure 13). Immunohistochemistry for 3-nitrotyrosine showed that the 3-nitrotyrosine-positive area significantly increased with age (2 M versus 12 M, P = 0.029; 2 M versus 24 M, P < 0.001; 12 M versus 24 M, P < 0.001; Figure 14).
Figure 13.
Immunohistochemistry for 8-OHdG. (a) Representative images of immunohistochemistry for 8-OHdG (original magnification, 400x). (b) There was marked increase in the 8-OHdG-positive area in the 24 M group (3.47 ± 1.34%) compared with 2 M group (0.48 ± 0.28%) and 12 M group (1.67 ± 1.97%). ∗ P < 0.001. Values are shown as mean ± SD.
Figure 14.
Immunohistochemistry for 3-nitrotyrosine. (a) Representative images of immunohistochemistry for 3-nitrotyrosine (original magnification, 400x). (b) There was marked increase in the 3-nitrotyrosine-positive area in the 24 M group (3.02 ± 1.18%) compared with 2 M group (0.06 ± 0.03%) and 12 M group (0.56 ± 0.22%). ∗ P < 0.05; † P < 0.001. Values are shown as mean ± SD.
4. Discussion
The novel finding of the present study is that the thoracic aorta of aging mice exhibits altered RAS components which are characterized by an enhanced PRR-ACE-Ang II-AT1R axis and a reduced ACE2-MasR axis. The altered expression of RAS components was associated with fibrosis, inflammation, and oxidative stress in the aging aorta.
The activation of tissue-specific RAS components has been demonstrated in various tissues. It is well known that the intrarenal RAS activation is associated with the renal aging process [4]. Age-associated cardiac remodeling involves the myocardial RAS activation [19], and the skeletal RAS is involved in the age-related osteoporosis of mice [20]. There also is evidence that RAS blockade ameliorates cognitive decline and neurodegenerative disorders associated with aging [21]. Ang II is the key peptide in the organ damage associated with RAS activation [5]. Our results showed consistent findings with previous literature. The aortic expressions of ACE, Ang II, and AT1R increased in 24-month-old mice, whereas those of ACE2 and MasR decreased. These findings not also support the classical concept of RAS activation, the upregulation of ACE-Ang II-AT1R axis, in arterial aging, but also show that the antagonizing ACE2-MasR axis is downregulated. In addition, the expression of PRR was significantly increased in 24-month-old mice. It was shown that binding of prorenin or renin to the PRR induced mesangial cells to produce TGF-β and to increase fibronectin and collagen synthesis independently of Ang II [22]. Recently, PRR was shown to be essential for cell survival and downregulation of vascular inflammation in murine vascular smooth muscle cells [23]. Moreover, our results showed that the serum levels of renin and Ang II significantly increased with age, which implicates the activation of humoral RAS. These findings altogether implicate that the arterial aging is associated with the imbalance between various RAS components.
TGF-β is one of the most important downstream events of the RAS and Ang II is implicated in arterial aging [2]. It was reported that aortic TGF-β accumulation may be related to the age-associated increase in aortic fibronectin and collagen [24, 25] and that the expression of TGF-β and fibronectin are both regulated by Ang II [26]. Consistently, our results demonstrated that the aortic media thickness and the expression of TGF-β, collagen IV, and fibronectin increased in 24-month-old mice compared with 2-month-old and 12-month-old mice.
It is known that the expression of the AT2R is ubiquitous in fetal tissues of rodents and it decreases after birth, remaining at a low level in adulthood in adrenal medulla, uterus, ovary, vascular endothelium, and distinct brain areas [27]. In this study, the western blot analysis showed that the expression of AT1R and the ratio of AT1R to AT2R increased with age. However, the expression of AT2R did not change significantly, and the expression of AT2R was similar between 2-month-old mice and 12-month-old mice. Similarly, Gao et al. reported that adult mice (10–14 week-old) exhibited significantly higher AT2R expression in total protein extracts compared to fetuses and neonates in neural tissues, heart, lung, liver and kidney [28]. They speculated that the difference in the protein measurement method may cause this discrepancy. The conventional concept on AT2R expression profiles before and after birth was derived from autoradiographic data [29–31], ligand binding experiments [32–34], and in situ hybridization [35–37]. Autoradiography and ligand binding primarily determine mature receptors only on the cell surface. In situ hybridization detects mRNA but is not a reliable technique to quantify gene expression. By contrast, western blot measures total AT2R protein including both plasma membrane (mature) and cytoplasmic (immature) protein. In addition, different regions, even in the same organ, may exhibit different AT2R expression level. These findings may support our results in which the total AT2R protein expression did not decrease in 12-month-old mice compared with 2-month-old mice.
It is well known that oxidative stress and impaired antioxidant defense mechanisms are mainly involved in the vascular aging process [38]. Ang II activates intracellular NADPH oxidase via the AT1R to generate superoxide anion (O2 −c). Excessive superoxide production promotes the uncoupling of eNOS, which in turn reduces nitric oxide availability and enhances ROS production [39, 40]. In this study, the 24-month-old mice exhibited decreased aortic expression of Nox2 and phospho-Ser1177eNOS expression, both of which might have enhanced the ROS production. In resting endothelial cells, serine 1177 (Ser1177) is usually not phosphorylated. Phosphorylation is induced when the cells are exposed to oestrogens, vascular endothelial growth factor, insulin, bradykinin, or fluid shear stress. Phosphorylation of the Ser1177 residue increases the enzyme activity [41]. Thus our results suggest that the eNOS is activated with age and thus results in oxidative stress. In our study, the phospho-Ser1177eNOS expression was nearly similar between 12-month-old mice and 24-month-old mice. Zecchin et al. previously reported a similar finding, which showed that phospho-Ser1177eNOS expression was similar in thoracic aorta of 2-month-old and 12-month-old Wistar rats [42]. This may be because the eNOS enzyme system is overactivated in aged blood vessels as a compensatory mechanism to counterbalance endothelial dysfunction induced by age-associated oxidative stress [43].
Ang II increases ROS formation also in the mitochondria level [44]. Consistently, our results showed that the aortic expressions of mitochondrial antioxidant enzymes, SOD1 and SOD2, decreased in 24-month-old mice and that the 8-OHdG-positive area, an oxidative stress marker, increased with age. The 3-nitrotyrosine-positive area, a marker for inflammation and nitric oxide production, also increased with age. However, there was no significant change in the aortic expression of Nox4. Nox2 is known to promote the development of endothelial dysfunction, hypertension, and inflammation [45]. Unlike Nox2 that primarily produce superoxide, Nox4 has been shown to produce hydrogen peroxide (H2O2) [46], which cannot scavenge nitric oxide [47]. Recent evidence suggest that Nox4 may have a protective role in the vasculature during stress [45]. An in vivo study demonstrated that endothelial-specific overexpression of Nox4 enhanced endothelial function and reduced blood pressure [48]. In Nox4−/− mice, endogenous Nox4 protected the vasculature during ischemic or inflammatory stress [49]. In addition, Nox4 expression was decreased in human abdominal aortic aneurysm in spite of increased oxidative stress [50]. In this study, although it was not significant, there was a decreasing tendency in aortic expression of Nox4. We speculate that the role of Nox4 may not be crucial in the arterial aging.
In conclusion, our results demonstrate that arterial aging is associated with enhanced PRR-ACE-Ang II-AT1R axis and reduced ACE2-MasR axis, which results in fibrosis, inflammation, and oxidative stress of the thoracic aorta. The altered expression of RAS components may explain the increased susceptibility to vascular injury and cardiovascular disease in the elderly population. Targeting these signaling molecules may provide specific therapeutic strategies for cardiovascular disease to this population.
Acknowledgments
This research was supported by the Basic Science Research Program through the National Research Foundation of Korea (NRF) funded by the Ministry of Education, Science, and Technology (2011-0023126 and Cheol Whee Park; A111055). Also, this research was supported by Basic Science Research Program through the National Research Foundation of Korea (NRF) funded by the Ministry of Science, ICT, and Future Planning (2014R1A1A3A04050919).
Competing Interests
The authors declare that they have no competing interests.
References
- 1.Lakatta E. G., Levy D. Arterial and cardiac aging: major shareholders in cardiovascular disease enterprises: Part I: aging arteries: a “set up” for vascular disease. Circulation. 2003;107(1):139–146. doi: 10.1161/01.cir.0000048892.83521.58. [DOI] [PubMed] [Google Scholar]
- 2.Lakatta E. G. Arterial and cardiac aging: Major shareholders in cardiovascular disease enterprises. Part III: cellular and molecular clues to heart and arterial aging. Circulation. 2003;107(3):490–497. doi: 10.1161/01.cir.0000048894.99865.02. [DOI] [PubMed] [Google Scholar]
- 3.Kovacic J. C., Moreno P., Nabel E. G., Hachinski V., Fuster V. Cellular senescence, vascular disease, and aging: part 2 of a 2-part review: clinical vascular disease in the elderly. Circulation. 2011;123(17):1900–1910. doi: 10.1161/circulationaha.110.009118. [DOI] [PubMed] [Google Scholar]
- 4.Yoon H. E., Choi B. S. The renin-angiotensin system and aging in the kidney. Korean Journal of Internal Medicine. 2014;29(3):291–295. doi: 10.3904/kjim.2014.29.3.291. [DOI] [PMC free article] [PubMed] [Google Scholar]
- 5.Conti S., Cassis P., Benigni A. Aging and the renin-angiotensin system. Hypertension. 2012;60(4):878–883. doi: 10.1161/HYPERTENSIONAHA.110.155895. [DOI] [PubMed] [Google Scholar]
- 6.Carey R. M. Cardiovascular and renal regulation by the angiotensin type 2 receptor: the AT2 receptor comes of age. Hypertension. 2005;45(5):840–844. doi: 10.1161/01.hyp.0000159192.93968.8f. [DOI] [PubMed] [Google Scholar]
- 7.Hunyady L., Catt K. J. Pleiotropic AT1 receptor signaling pathways mediating physiological and pathogenic actions of angiotensin II. Molecular Endocrinology. 2006;20(5):953–970. doi: 10.1210/me.2004-0536. [DOI] [PubMed] [Google Scholar]
- 8.Mehta P. K., Griendling K. K. Angiotensin II cell signaling: physiological and pathological effects in the cardiovascular system. American Journal of Physiology—Cell Physiology. 2007;292(1):C82–C97. doi: 10.1152/ajpcell.00287.2006. [DOI] [PubMed] [Google Scholar]
- 9.Benigni A., Cassis P., Remuzzi G. Angiotensin II revisited: new roles in inflammation, immunology and aging. EMBO Molecular Medicine. 2010;2(7):247–257. doi: 10.1002/emmm.201000080. [DOI] [PMC free article] [PubMed] [Google Scholar]
- 10.Donoghue M., Hsieh F., Baronas E., et al. A novel angiotensin-converting enzyme-related carboxypeptidase (ACE2) converts angiotensin I to angiotensin 1–9. Circulation Research. 2000;87(5):E1–E9. doi: 10.1161/01.res.87.5.e1. [DOI] [PubMed] [Google Scholar]
- 11.Santos R. A. S., Simoes e Silva A. C., Maric C., et al. Angiotensin-(1-7) is an endogenous ligand for the G protein-coupled receptor Mas. Proceedings of the National Academy of Sciences of the United States of America. 2003;100(14):8258–8263. doi: 10.1073/pnas.1432869100. [DOI] [PMC free article] [PubMed] [Google Scholar]
- 12.Santos R. A. S., Ferreira A. J., Simões e Silva A. C. Recent advances in the angiotensin-converting enzyme 2-angiotensin(1–7)-Mas axis. Experimental Physiology. 2008;93(5):519–527. doi: 10.1113/expphysiol.2008.042002. [DOI] [PubMed] [Google Scholar]
- 13.Nguyen G., Delarue F., Burcklé C., Bouzhir L., Giller T., Sraer J.-D. Pivotal role of the renin/prorenin receptor in angiotensin II production and cellular responses to renin. The Journal of Clinical Investigation. 2002;109(11):1417–1427. doi: 10.1172/jci200214276. [DOI] [PMC free article] [PubMed] [Google Scholar]
- 14.Cuadra A. E., Shan Z., Sumners C., Raizada M. K. A current view of brain renin-angiotensin system: is the (pro)renin receptor the missing link? Pharmacology and Therapeutics. 2010;125(1):27–38. doi: 10.1016/j.pharmthera.2009.07.007. [DOI] [PMC free article] [PubMed] [Google Scholar]
- 15.de Kloet A. D., Krause E. G., Woods S. C. The renin angiotensin system and the metabolic syndrome. Physiology and Behavior. 2010;100(5):525–534. doi: 10.1016/j.physbeh.2010.03.018. [DOI] [PMC free article] [PubMed] [Google Scholar]
- 16.Lim J. H., Kim E. N., Kim M. Y., et al. Age-associated molecular changes in the kidney in aged mice. Oxidative Medicine and Cellular Longevity. 2012;2012:10. doi: 10.1155/2012/171383.171383 [DOI] [PMC free article] [PubMed] [Google Scholar]
- 17.Paneni F., Costantino S., Cosentino F. Molecular pathways of arterial aging. Clinical Science. 2015;128(2):69–79. doi: 10.1042/cs20140302. [DOI] [PubMed] [Google Scholar]
- 18.Czypiorski P., Rabanter L. L., Altschmied J., Haendeler J. Redox balance in the aged endothelium. Zeitschrift fur Gerontologie und Geriatrie. 2013;46(7):635–638. doi: 10.1007/s00391-013-0536-2. [DOI] [PubMed] [Google Scholar]
- 19.Wang M., Zhang J., Walker S. J., Dworakowski R., Lakatta E. G., Shah A. M. Involvement of NADPH oxidase in age-associated cardiac remodeling. Journal of Molecular and Cellular Cardiology. 2010;48(4):765–772. doi: 10.1016/j.yjmcc.2010.01.006. [DOI] [PMC free article] [PubMed] [Google Scholar]
- 20.Gu S.-S., Zhang Y., Li X.-L., et al. Involvement of the skeletal renin-angiotensin system in age-related osteoporosis of ageing mice. Bioscience, Biotechnology and Biochemistry. 2012;76(7):1367–1371. doi: 10.1271/bbb.120123. [DOI] [PubMed] [Google Scholar]
- 21.Villapol S., Saavedra J. M. Neuroprotective effects of angiotensin receptor blockers. The American Journal of Hypertension. 2015;28(3):289–299. doi: 10.1093/ajh/hpu197. [DOI] [PubMed] [Google Scholar]
- 22.Huang Y., Wongamorntham S., Kasting J., et al. Renin increases mesangial cell transforming growth factor-β1 and matrix proteins through receptor-mediated, angiotensin II-independent mechanisms. Kidney International. 2006;69(1):105–113. doi: 10.1038/sj.ki.5000011. [DOI] [PubMed] [Google Scholar]
- 23.Kurauchi-Mito A., Ichihara A., Bokuda K., et al. Significant roles of the (pro)renin receptor in integrity of vascular smooth muscle cells. Hypertension Research. 2014;37(9):830–835. doi: 10.1038/hr.2014.92. [DOI] [PubMed] [Google Scholar]
- 24.Li Z., Froehlich J., Galis Z. S., Lakatta E. G. Increased expression of matrix metalloproteinase-2 in the thickened intima of aged rats. Hypertension. 1999;33(1):116–123. doi: 10.1161/01.hyp.33.1.116. [DOI] [PubMed] [Google Scholar]
- 25.Takasaki I., Chobanian A. V., Sarzani R., Brecher P. Effect of hypertension on fibronectin expression in the rat aorta. Journal of Biological Chemistry. 1990;265(35):21935–21939. [PubMed] [Google Scholar]
- 26.Crawford D. C., Chobanian A. V., Brecher P. Angiotensin II induces fibronectin expression associated with cardiac fibrosis in the rat. Circulation Research. 1994;74(4):727–739. doi: 10.1161/01.RES.74.4.727. [DOI] [PubMed] [Google Scholar]
- 27.Carey R. M. Update on the role of the AT2 receptor. Current Opinion in Nephrology and Hypertension. 2005;14(1):67–71. doi: 10.1097/00041552-200501000-00011. [DOI] [PubMed] [Google Scholar]
- 28.Gao J., Chao J., Parbhu K.-J. K., et al. Ontogeny of angiotensin type 2 and type 1 receptor expression in mice. Journal of the Renin-Angiotensin-Aldosterone System. 2012;13(3):341–352. doi: 10.1177/1470320312443720. [DOI] [PMC free article] [PubMed] [Google Scholar]
- 29.Grady E. F., Sechi L. A., Griffin C. A., Schambelan M., Kalinyak J. E. Expression of AT2 receptors in the developing rat fetus. Journal of Clinical Investigation. 1991;88(3):921–933. doi: 10.1172/JCI115395. [DOI] [PMC free article] [PubMed] [Google Scholar]
- 30.Millan M. A., Jacobowitz D. M., Aguilera G., Catt K. J. Differential distribution of at1 and at2 angiotensin II receptor subtypes in the rat brain during development. Proceedings of the National Academy of Sciences of the United States of America. 1991;88(24):11440–11444. doi: 10.1073/pnas.88.24.11440. [DOI] [PMC free article] [PubMed] [Google Scholar]
- 31.Ciuffo G. M., Viswanathan M., Seltzer A. M., Tsutsumi K., Saavedra J. M. Glomerular angiotensin II receptor subtypes during development of rat kidney. American Journal of Physiology—Renal Fluid and Electrolyte Physiology. 1993;265(2, part 2):F264–F271. doi: 10.1152/ajprenal.1993.265.2.F264. [DOI] [PubMed] [Google Scholar]
- 32.Tsutsumi K., Saavedra J. M. Characterization and development of angiotensin II receptor subtypes (AT1 and AT2) in rat brain. American Journal of Physiology-Regulatory Integrative and Comparative Physiology. 1991;261(1, part 2):R209–R216. doi: 10.1152/ajpregu.1991.261.1.R209. [DOI] [PubMed] [Google Scholar]
- 33.Tsutsumi K., Saavedra J. M. Characterization of AT2 angiotensin II receptors in rat anterior cerebral arteries. American Journal of Physiology—Heart and Circulatory Physiology. 1991;261(3, part 2):H667–H670. doi: 10.1152/ajpheart.1991.261.3.H667. [DOI] [PubMed] [Google Scholar]
- 34.Sechi L. A., Griffin C. A., Grady E. F., Kalinyak J. E., Schambelan M. Characterization of angiotensin II receptor subtypes in rat heart. Circulation Research. 1992;71(6):1482–1489. doi: 10.1161/01.RES.71.6.1482. [DOI] [PubMed] [Google Scholar]
- 35.Aguilera G., Kapur S., Feuillan P., Sunar-Akbasak B., Bathia A. J. Developmental changes in angiotensin II receptor subtypes and AT1 receptor mRNA in rat kidney. Kidney International. 1994;46(4):973–979. doi: 10.1038/ki.1994.356. [DOI] [PubMed] [Google Scholar]
- 36.Shanmugam S., Llorens-Cortes C., Clauser E., Corvol P., Gasc J. M. Expression of angiotensin II AT2 receptor mRNA during development of rat kidney and adrenal gland. American Journal of Physiology. 1995;268(5, part 2):F922–F930. doi: 10.1152/ajprenal.1995.268.5.F922. [DOI] [PubMed] [Google Scholar]
- 37.Shanmugam S., Corvol P., Gasc J.-M. Angiotensin II type 2 receptor mRNA expression in the developing cardiopulmonary system of the rat. Hypertension. 1996;28(1):91–97. doi: 10.1161/01.HYP.28.1.91. [DOI] [PubMed] [Google Scholar]
- 38.Bachschmid M. M., Schildknecht S., Matsui R., et al. Vascular aging: chronic oxidative stress and impairment of redox signaling—consequences for vascular homeostasis and disease. Annals of Medicine. 2013;45(1):17–36. doi: 10.3109/07853890.2011.645498. [DOI] [PMC free article] [PubMed] [Google Scholar]
- 39.Gilliam-Davis S., Payne V. S., Kasper S. O., Tommasi E. N., Robbins M. E., Diz D. I. Long-term AT1 receptor blockade improves metabolic function and provides renoprotection in Fischer-344 rats. American Journal of Physiology—Heart and Circulatory Physiology. 2007;293(3):H1327–H1333. doi: 10.1152/ajpheart.00457.2007. [DOI] [PubMed] [Google Scholar]
- 40.Herbert K. E., Mistry Y., Hastings R., Poolman T., Niklason L., Williams B. Angiotensin II-mediated oxidative DNA damage accelerates cellular senescence in cultured human vascular smooth muscle cells via telomere-dependent and independent pathways. Circulation Research. 2008;102(2):201–208. doi: 10.1161/CIRCRESAHA.107.158626. [DOI] [PMC free article] [PubMed] [Google Scholar]
- 41.Förstermann U., Sessa W. C. Nitric oxide synthases: regulation and function. European Heart Journal. 2012;33(7):829–837. doi: 10.1093/eurheartj/ehr304. [DOI] [PMC free article] [PubMed] [Google Scholar]
- 42.Zecchin H. G., Bezerra R. M. N., Carvalheira J. B. C., et al. Insulin signalling pathways in aorta and muscle from two animal models of insulin resistance—the obese middle-aged and the spontaneously hypertensive rats. Diabetologia. 2003;46(4):479–491. doi: 10.1007/s00125-003-1073-0. [DOI] [PubMed] [Google Scholar]
- 43.van der Loo B., Labugger R., Skepper J. N., et al. Enhanced peroxynitrite formation is associated with vascular aging. The Journal of Experimental Medicine. 2000;192(12):1731–1743. doi: 10.1084/jem.192.12.1731. [DOI] [PMC free article] [PubMed] [Google Scholar]
- 44.Basso N., Paglia N., Stella I., et al. Protective effect of the inhibition of the renin-angiotensin system on aging. Regulatory Peptides. 2005;128(3):247–252. doi: 10.1016/j.regpep.2004.12.027. [DOI] [PubMed] [Google Scholar]
- 45.Konior A., Schramm A., Czesnikiewicz-Guzik M., Guzik T. J. NADPH oxidases in vascular pathology. Antioxidants and Redox Signaling. 2014;20(17):2794–2814. doi: 10.1089/ars.2013.5607. [DOI] [PMC free article] [PubMed] [Google Scholar]
- 46.Dikalov S. I., Dikalova A. E., Bikineyeva A. T., Schmidt H. H. H. W., Harrison D. G., Griendling K. K. Distinct roles of Nox1 and Nox4 in basal and angiotensin II-stimulated superoxide and hydrogen peroxide production. Free Radical Biology and Medicine. 2008;45(9):1340–1351. doi: 10.1016/j.freeradbiomed.2008.08.013. [DOI] [PMC free article] [PubMed] [Google Scholar]
- 47.Rey F. E., Cifuentes M. E., Kiarash A., Quinn M. T., Pagano P. J. Novel competitive inhibitor of NAD(P)H oxidase assembly attenuates vascular O2 − and systolic blood pressure in mice. Circulation Research. 2001;89(5):408–414. doi: 10.1161/hh1701.096037. [DOI] [PubMed] [Google Scholar]
- 48.Ray R., Murdoch C. E., Wang M., et al. Endothelial Nox4 NADPH oxidase enhances vasodilatation and reduces blood pressure in vivo. Arteriosclerosis, Thrombosis, and Vascular Biology. 2011;31(6):1368–1376. doi: 10.1161/ATVBAHA.110.219238. [DOI] [PubMed] [Google Scholar]
- 49.Schröder K., Zhang M., Benkhoff S., et al. Nox4 Is a protective reactive oxygen species generating vascular NADPH oxidase. Circulation Research. 2012;110(9):1217–1225. doi: 10.1161/CIRCRESAHA.112.267054. [DOI] [PubMed] [Google Scholar]
- 50.Guzik B., Sagan A., Ludew D., et al. Mechanisms of oxidative stress in human aortic aneurysms—association with clinical risk factors for atherosclerosis and disease severity. International Journal of Cardiology. 2013;168(3):2389–2396. doi: 10.1016/j.ijcard.2013.01.278. [DOI] [PMC free article] [PubMed] [Google Scholar]


