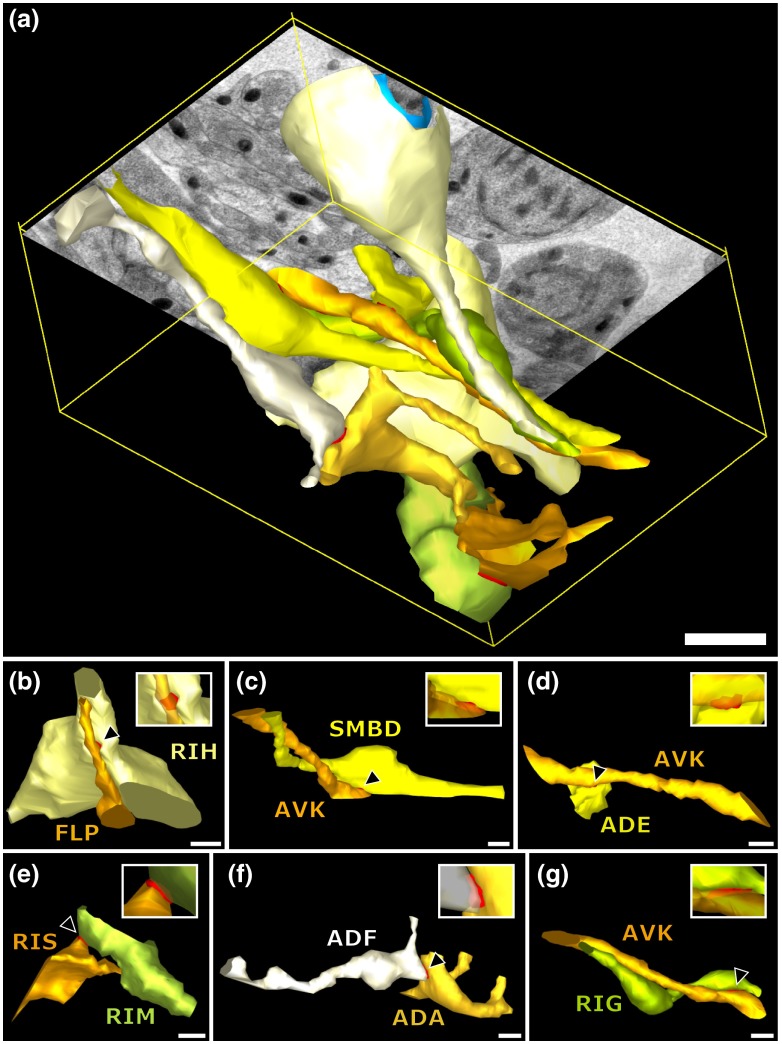
Fig. 6.
3-D models of neurite projections of 10 UNC-7::GFP gap junction forming neurons and SAAD somatic region. (a) Overview with first section of the SEM data set shown. Red: gap junctions. Light blue: nucleus of SAAD (shown for context). Yellowish colors: plasma membranes. Scale bar: . (b)–(g) Individual pairs of neurons connected by a UNC-7::GFP-positive gap junctions. Black arrowheads: gap junctions (also shown in red). Insets: closer look on the gap junctions though partially transparent neurons. Neuronal identities are color coded. Scale bars: 500 nm.

