

Abstract
Protein methylation and acetylation play important roles in biological processes, and misregulation of these modifications is involved in various diseases. Therefore, it is critical to understand the activities of the enzymes responsible for these modifications. Herein we describe a sensitive method for ratiometric quantification of methylated and acetylated peptides via MALDI-MS by direct spotting of enzymatic methylation and acetylation reaction mixtures without tedious purification procedures. The quantifiable detection limit for peptides with our method is approximately 10 fmol. This is achieved by increasing the signal-to-noise ratio through the addition of NH4H2PO4 to the matrix solution and reduction of the matrix α-cyanohydroxycinnamic acid concentration to 2 mg/ml. We have demonstrated the application of this method in enzyme kinetic analysis and inhibition studies. The unique feature of this method is the simultaneous quantification of multiple peptide species for investigation of processivity mechanisms. Its wide buffer compatibility makes it possible to be adapted to investigate the activity of any protein methyltransferase or acetyltransferase.
Keywords: Protein methyltransferase, Protein acetyltransferase, Methylation, Acetylation, MALDI-MS, Enzymatic activity assay
Protein methylation and acetylation have emerged as critical regulators of biological and pathological processes such as cell growth and differentiation, cytoskeletal regulation, DNA damage response, immune and inflammatory pathways, and many other diseases [1–4]. Due to their essential functions, the studies of protein methylation and acetylation have experienced exponential growth over the past decade. Understanding the mechanisms of protein methyltransferases and acetyltransferases is an important step toward the rational development of specific inhibitors to modulate their mediated processes and to serve as potential therapeutic agents. Therefore, it is important to have convenient methods available to support the enzymatic studies.
Currently there are two main approaches to monitoring methylation and acetylation. One strategy is the indirect detection of the products. Antibodies targeted toward specific histone modifications are excellent for examining the cellular distribution of a certain modification, but this method relies on the availability and efficiency of specific antibodies [5,6]. Another method is to monitor the formation of S-adenosylhomocysteine (AdoHcy)1 and coenzyme A (CoA) for methylation and acetylation, respectively. Reaction of these species with UV or fluorescent dyes can be monitored by spectrophotometer [7–10]. However, substances that interfere with the dyes, such as thiols, cannot be used, and the inhibitory activity of AdoHcy or CoA cannot be measured.
Another strategy for monitoring methyltransferase and acetyltransferase activities is the direct detection of the methylated or acetylated products. Utilization of a radiolabeled ligand, such as 3H- or 14C-labeled S-adenosylmethionine (AdoMet) or acetyl-CoA (Ac-CoA) allows for the detection of labeled products by scintillation counting [11,12]. However, this method requires removal of the unreacted radiolabeled ligands, as well as the handling of hazardous radioactive materials [13,14]. Some drawbacks of the above methods are the complication of analysis by automethylation or autoacetylation of the enzymes and lack of information about the progression of methylation with respect to the individual methylated states. Liquid chromatography methods in conjunction with MS have been widely used to quantify the formation of methylated or acetylated peptides [15–19]. Column methods can result in some loss of material, however, necessitating a standard calibration curve for quantitative analysis, and elution conditions must be optimized for separation of the substrates and products. Matrix-assisted laser desorption/ionization (MALDI)–MS is excellent for the detection of peptides with small modifications such as methylation and acetylation, but alkali salts or buffer components commonly utilized in in vitro assays usually affect the sensitivity of the signal [20–28]. Interfering species can be removed by purification methods, such as C18 Ziptips pipette tips [29,30]. However, this can result in material loss, affecting sensitivity and reproducibility. There have been studies that attempted to quantify methylation by direct spotting, but to our knowledge no studies have reported kinetic analyses for peptide substrates, most likely because of the limited sensitivity. The MassSQUIRM technique has been developed to utilize isotopic enrichment to increase sensitivity, but requires deuterated formaldehyde to generate the substituted peptides [31].
To provide a more convenient and sensitive method to quantify methylation and acetylation, we have developed a direct, ratiometric, and quantitative (DRQ)–MALDI–MS assay for protein methyl-transferases and acetyltransferases. This assay directly measures the relative amounts of different peptide species in near real time without extra purification steps. In addition, we have tested this assay in the presence of various buffer components; thus it could be widely applicable for enzyme analyses.
We selected two enzymes to exemplify the application of our method: the protein N-terminal methyltransferase 1 (NTMT1) and the protein N-terminal acetyltransferase A (NatA). Both enzymes are responsible for protein α-N-terminal modifications. NTMT1 is an AdoMet-dependent methyltransferase that methylates the α-N-amino group of its protein substrates [32]. Known substrates include regulator of chromosome condensation 1 (RCC1), centromere proteins A and B, and the SET1α oncoprotein [33–35]. The NatA heterodimeric complex accounts for the majority of N-terminal acetylation and acetylates substrates with an N-terminal A, C, G, S, T, or V [36–38]. We applied our DRQ– MALDI–MS method to examine the progression of N-terminal modification for NTMT1 and NatA and determine how modifications proceed over time.
Materials and methods
Materials
All reagents were used as purchased except α-cyanohydroxycinnamic acid (CHCA), which was purified as described below. Synthetic peptides SCL1-12 (SGAAAASAAGYE), human RCC1-10 (SPKRIAKRRS), and SET1α-10 (APKRQSPLPP) were prepared using standard Fmoc chemistry with a CEM Liberty microwave peptide synthesizer. Methylated and acetylated peptides were prepared from RCC1-10 according to the literature [39–41]. All peptides were purified by reverse-phase HPLC (Waters) and quantified. Spectra were obtained with an Applied Biosystems Voyager MALDI time-of-flight mass spectrometer in reflector mode. Data analysis was performed with Data Explorer and Microsoft Excel. Curve-fitting analysis was performed with Prism GraphPad. The human NTMT1 (EC 2.1.1.244, Addgene) and NatA (EC 2.3.1.88) were expressed and purified according to the literature [32,38,41].
Preparation of MALDI-MS matrix solution
CHCA was recrystallized by dissolving in hot methanol until saturation and then the clear supernatant was separated and cooled slowly to room temperature. Crystals were filtered, rinsed with ice-cold methanol, and dried under reduced pressure. Dried CHCA (100 mg) was suspended in 10 ml water, and ammonium hydroxide (reagent grade, 28–30% NH3 basis, about 0.5 ml) was added dropwise until the solution was clear. The solution was filtered to remove any precipitate and adjusted to pH 2 with concentrated hydrochloric acid to precipitate CHCA. The pellet was washed with 0.1 M hydrochloric acid and dried under reduced pressure to provide a faint yellow, fine powder, which was stored at −20 °C.
Optimization of matrix solution conditions
Mixture 1 was prepared from standardized stocks of RCC1-10 and Me-RCC1-10 (9:1) in each individual buffer component (Table 1). An aliquot of each solution was mixed in a 1:1 ratio with a “ quenching solution” containing 0–20 mM NH4H2PO4 and directly spotted on matrix solutions containing 0–20 mM NH4H2PO4 as well. Trifluoroacetic acid (TFA) was increased to 0.2% (v/v) to lower the pH of the solutions to ∼2.0. The final amount of each peptide spotted on each well was 90 and 10 fmol, respectively. We used the S/N calculator in Data Explorer to determine the S/N ratios of the monoisotopic peaks for Me-RCC1-10.
Table 1.
Optimization of signal-to-noise ratio for Me-RCC1 (10 fmol) in common buffer components.
| CHCA | 10 mg/mL | 2 mg/mL | ||||
|---|---|---|---|---|---|---|
|
|
||||||
| NH4H2PO4 | 0 mM | 0 mM | 5 mM | 10 mM | 15 mM | 20 mM |
| Hepes, 50 mM | 132 | 221 | 299 | 488 | 367 | 326 |
| Tris, 50 mM | ND | 564 | 562 | 742 | 731 | 797 |
| PBS, 50 mM | 42 | 502 | 494 | 346 | 514 | 395 |
| NaCl, 100 mM | 7 | 197 | 472 | 417 | 639 | 716 |
| KCl, 100 mM | ND | 231 | 441 | 233 | 340 | 324 |
| KOAc, 50 mM | 29 | ND | ND | 597 | 141 | 234 |
| EDTA, 1 mM | ND | 388 | 620 | 611 | 620 | 1122 |
| MgCl2, 5 mM | ND | 564 | 480 | 426 | 507 | 957 |
| DTT, 5 mM | 8 | 635 | 415 | 53 | 531 | 699 |
| Na ascorbate, 5 mM | ND | 454 | 265 | 305 | 462 | 607 |
| Me2SO, 5% | ND | 69 | 304 | 226 | 158 | 181 |
ND = not detectable above background noise.
Enzymatic methylation and acetylation assays
Peptide methylation was performed under the following conditions: 0.2 µM NTMT1, 25 mM Tris, pH 7.5, 50 mM KOAc, 2 mM DTT and peptide substrate at either 30 or 37 °C for 5 min [41]. AdoMet was added to initiate the reaction. Peptide acetylation was performed under the following conditions: 0.2 µM NatA, 100 mM Tris, pH 8.0, 50 mM NaCl at 25 °C [38]. Ac-CoA(500 µM) was added to initiate the reaction. For kinetic analyses, substrate concentrations were varied from 1 to 32 µM. The methylation rate for each trial was determined by calculating the slope from three separate aliquots taken at differing time points. Aliquots at desired time points were quenched in a 1:1 ratio with a quenching solution (either 20 or 40 mM NH4H2PO4, 0.4% TFA in 1/1 acetonitrile/water), vortexed briefly, and kept at 4 °C before being spotted on the MALDI plate. For the inhibition studies, inhibitors were incubated in buffer with NTMT1 in the absence of both enzyme substrates for 5 min. Three independent trials were performed for all experiments.
MALDI-MS acquisition and data analysis
The MALDI plate was cleaned by rinsing alternatively with deionized water and methanol, and wiping with a Kimwipe. The plate was then sonicated in 100% acetic acid for 15–20 min, rinsed with deionized water, and then sonicated in 50/47/3 (v/v/v) methanol/water/acetic acid for 15–20 min. Sonication was repeated as needed to remove any recalcitrant contamination. The plate was rinsed with methanol and dried before use. Each well was spotted with 0.5 µl CHCA matrix solution and allowed to dry before the addition of 0.5 µl analyte. An average of five acquisitions was obtained for each well. Processing of all spectra in Data Explorer included application of a noise filter (correlation factor of 0.7) and a baseline correction. Peak areas of the monoisotopic masses for all relevant species were combined to obtain a total area for each sample. The fraction of each methylation state was determined by summing the areas of the monoisotopic peaks for that state ([M+H]+, [M+Na]+, and [M+K]+) and dividing by the total area. Concentration of each methylation state was determined by multiplying its fraction by the original concentration of the peptide in solution.
Results and discussion
Optimization of DRQ-MALDI-MS assay conditions
Our initial attempts to quantify peptide methylation states with direct spotting in MALDI–MS were hindered by a detection limit of ∼5 pmol due to the presence of buffer salts in the samples. We analyzed the individual components in the NTMT1 assay buffer and noticed that Tris salt significantly suppressed the signal. Dilution of samples to lower concentrations of Tris ameliorated this effect; however, the dilution factor resulted in a loss of sensitivity for lower concentrations of peptides. Thus, we decided to systematically investigate the MALDI matrix and sample components with the goal of increasing sensitivity with minimal procedurs. Quality and concentration of the matrix components are critical, as recrystallized CHCA and decreased concentration of CHCA have been shown to greatly improve sensitivity [42]. CHCA can form adducts with alkali salts, resulting in greater background signal [43]. Washing dried matrix spots with NH4H2PO4 can remove some of the salts and ameliorate signal suppression but can affect the reproducibility [44]. Addition of ammonium salts to the matrix solution, such as NH4H2PO4 and ammonium citrate, can reduce matrix ionization and cluster formation [43-46]. The acidity of the matrix solution can also play a role. Cohen and Chait [47] empirically determined that the pH range 1.8–2.3 is optimal for peptide detection over a wide mass range. We sought to combine these techniques to identify optimized conditions for sample analysis.
We explored a variety of common buffer components to determine the optimal NH4H2PO4 concentrations for our assays. Under conventional conditions, represented by the first column in Table 1, Me-RCC1-10 was not detectable in most of the buffer components tested. Reduced concentration of the CHCA enabled detection in all tested solutions except KOAc. We then explored the optimal NH4H2PO4 concentrations in a variety of common buffer components. Addition of NH4H2PO4 increased the total S/N ratio 1.5- to 6-fold for most of the salts. It is interesting to note that some components fared better at lower concentrations of NH4H2PO4, in particular KOAc, which is a major constituent in our assay buffer. Therefore, empirical determination of the optimal NH4H2PO4 concentration will be necessary for other buffer systems. One limitation of our method is incompatibility with glycerol. Even with 0.02% glycerol, significant signal suppression was observed. One solution is dialysis of enzymes into a buffer lacking glycerol before use with this method. As the sensitivity under these optimized conditions is increased, it is critical to have high-quality matrix components. Hence, we used recrystallized CHCA and prepared the matrix and quench solutions fresh daily. It is well known that S/N is improved with an increasing number of laser shots. We also examined how the number of laser shots affected the signal-to-noise ratio under our optimized conditions. We determined the S/N ratio for Me-RCC1-10 in mixture 1 as outlined under Materials and methods for 5 × 50, 250, 500, and 1000 continuous laser shots (Supplementary Fig. S1). We found that averaging five 50-shot spectra gave a better S/N with the smaller amount of peptides present in the sample buffer under our optimized condition. Thus, we chose to average five 50-shot spectra for this study.
Precision and accuracy of DRQ-MALDI-MS method
To confirm the precision and accuracy of our DRQ–MALDI–MS method for quantification, we analyzed three mixtures of RCC1-10 peptides. In addition to the previously utilized mixture 1, we prepared mixture 2, in which an acetylated peptide was added to simulate the presence of an inhibitor, and mixture 3, which comprised equal portions of the un-, mono-, di-, and trimethylated peptides to simulate the results obtained during a progression analysis (Table 2). Each mixture was spotted on three different wells to ascertain reproducibility. Single acquisitions (one spot, 50 laser pulses total) as well as multiple acquisitions (average of five different spots, 250 laser pulses total) were obtained for each well to determine the effect of sample heterogeneity. p values of 0.002 or less were obtained for all three mixtures (Table 2). For methylated peptides, there are overlaps between [M+nCH3+Na]+ and [M+(n − 1)CH3+K]+ peaks. For mixture 3, the species were present in equal ratios, which amplified the contribution of the overlaps to the total peak area. However, the p values and standard errors were within acceptable values, indicating that these overlaps did not affect the results significantly. Very little difference was apparent between single and multiple acquisitions, so sample heterogeneity does not adversely affect the results. Overall, these results show that all peptides tested here have comparable ionization efficiency and that relative populations can be accurately and reproducibly determined via our method.
Table 2.
Quantification of peptide mixtures by DRQ–MALDI–MS.
| Actual % value | Experimental % value | ||
|---|---|---|---|
|
|
|||
| 1 Acquisition | 5 Acquisitions | ||
| Mixture #1: | |||
| RCC1 | 89.8 | 87.3 ± 2.8 | 86.4 ± 2.1 |
| Me-RCC1 | 10.2 | 12.8 ± 2.8 | 13.6 ± 2.1 |
| P-value: | <0.001 | <0.001 | |
| Mixture #2: | |||
| RCC1 | 48.9 | 50.3 ± 5.0 | 49.4 ± 2.4 |
| Me-RCC1 | 5.5 | 6.3 ± 0.3 | 7.1 ± 0.4 |
| Ac-RCC1 | 45.6 | 43.4 ± 5.0 | 43.6 ± 2.8 |
| P-value: | <0.001 | <0.001 | |
| Mixture #3: | |||
| RCC1 | 22.4 | 21.5 ± 4.7 | 19.9 ± 2.4 |
| Me-RCC1 | 22.8 | 29.0 ± 1.0 | 29.9 ± 1.9 |
| Me2-RCC1 | 23.6 | 13.5 ± 4.0 | 15.7 ± 1.6 |
| Me3-RCC1 | 31.2 | 36.0 ± 2.3 | 34.4 ± 0.1 |
| P-value: | 0.002 | 0.002 | |
Kinetic studies ofNTMT1 substrates
Next we sought to ascertain whether this method could be used to determine kinetic constants. We performed kinetic analysis for NTMT1 by determining the Michaelis–Menten constants for RCC1-10 peptide and AdoMet (Table 3). Kinetic constants obtained from DRQ–MALDI–MS are comparable with results from a fluorescence assay, which demonstrates the application of our method in enzyme kinetic studies and further validates the accuracy of the results [41]. For more extensive assay analysis, such as kinetics, automation of data analysis is necessary.
Table 3.
Michaelis–Menten constants for RCC1 and AdoMet with NTMT1.
| Substrate | Km (µM) | Vmax (µM/min) | kcat (min−1) | kcat/Km (µM min−1) |
|---|---|---|---|---|
| RCC1 | 4.83 ± 0.30 | 0.19 | 1.0 | 0.21 |
| AdoMet | 4.85 ± 0.53 | 0.21 | 1.0 | 0.21 |
Progression of methylation of NTMT1
For methyltransferases with multiple methylation events, it is important to study the progression of methylation to understand the enzyme processivity mechanism. We selected a SET1α-10 peptide as the NTMT1 substrate to determine the relative methylation distribution over time. We monitored the methylation assay by quenching aliquots at various time points over a 2-h period. Representative spectral data and the quantification of each methylated species are shown in Fig. 1. The SET1α-10 peptide was mainly present as the dimethylated substrate after 2 h. These results correlate with published evidence that APK substrates are mainly mono- and dimethylated [48]. An advantage of our DRQ–MALDI–MS is that it clearly indicates that SET1α-10 methylation catalyzed by NTMT1 follows a distributive pattern, as the maximum concentrations of the intermediate methylation states were higher than the NTMT1 concentration (0.2 μM) used in the assay.
Fig.1.
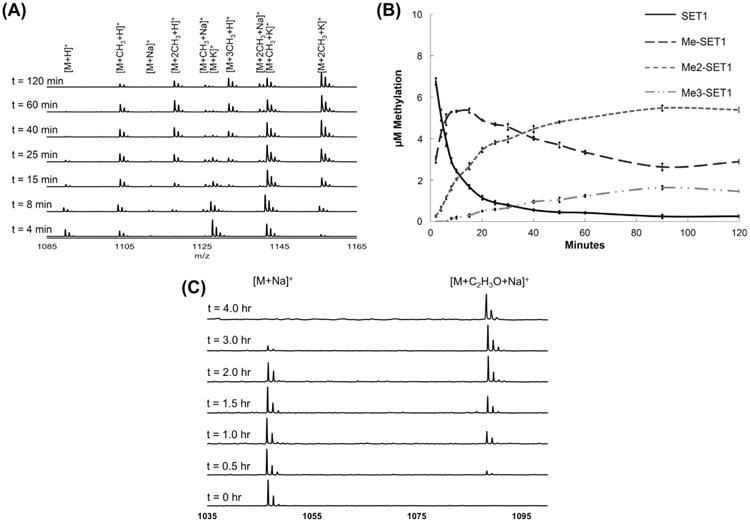
Monitoring progression of enzymatic activity over time. (A) Stacked plot of representative MS data at selected time points for progression analysis of SET1α-10 peptide with NTMT1. (B) Line graph depicting simultaneous quantification of individual states of SET1α-10 (un-, mono-, di-, and trimethylated) over time. (C) Stacked plot of representative MS data at selected time points for progression analysis of SCL1-12 peptide with NatA.
Acetylation of SCL1-12 peptide by NatA
To determine if our method could be used to study acetyltransferases, we assayed NatA with a peptide substrate representative of the N-terminus of SCL1 [49]. SCL1 has been shown to be involved in biofilm formation in group A Streptococcus, making it an interesting target for antibiotic studies [50]. We initially applied the optimal conditions for NTMT1 to detect acetylation. The 100 mM Tris and 0.5 mM Ac-CoA required for the NatA assay caused significant signal suppression. Increasing the NH4H2PO4 concentration from 10 to 40 mM alleviated this issue and enabled monitoring of the acetylation progression via our method (Fig. 1C).
Inhibition of NTMT1 methylation
We conducted inhibition studies for NTMT1 to demonstrate the application of our method in screening small-molecule inhibitors. We selected AdoHcy since it is a known methyltransferase inhibitor. In Fig. 2A, we used two concentrations of AdoHcy to demonstrate that dose-dependent inhibition could be measured with our method. With 5 μM AdoHcy, methylation was reduced approximately 40% in comparison to the control, while 50 μM AdoHcy almost completely suppressed the methylation. We then selected assay conditions such that multiple methylation states would be produced, to observe the effect of an inhibitor on their distribution. Our results (Fig. 2B) showed that AdoHcy decreased the population ratio for each methylated state, which resulted in a threefold increase in the relative population of the unmethylated SETα-10 peptide. While trimethylation was completely suppressed, dimethylation was reduced by 75%, and monomethylation was reduced by only 30%. Thus, this method enables simultaneous monitoring of the inhibitory effect on individual methylation states.
Fig.2.
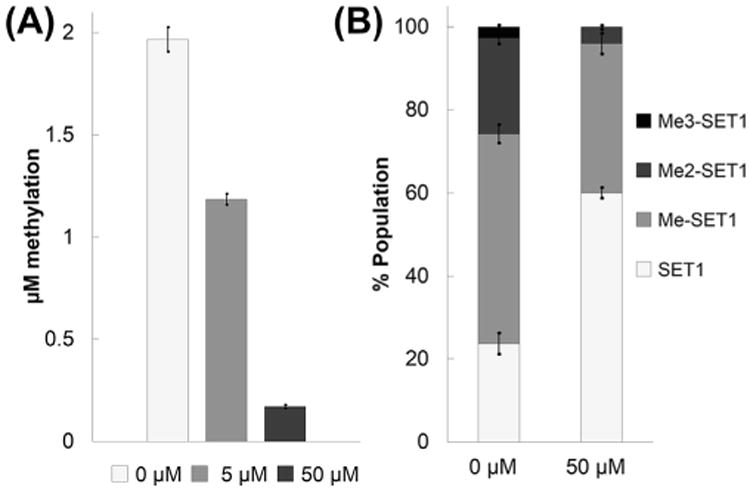
Inhibition studies of AdoHcy with NTMT1. (A) Dose-dependent inhibition of SET1α-10 monomethylation in the presence of 4 μM AdoMet and 0, 5, or 50 μM AdoHcy. (B) Inhibition of multiple SET1α-10 methylation events in the presence of 15 μM AdoMet and 0 or 50 μM AdoHcy.
Conclusion
Herein we report a DRQ–MALDI–MS method for direct analysis of the activities of protein N-terminal methyltransferases and acetyltransferases. We were able to reproducibly detect and quantify low-femtomole quantities (∼10 fmol) of peptides by directly spotting samples with the addition of NH4H2PO4 and reduction of matrix CHCA concentration. We have demonstrated that the overall precision and accuracy of this method are sufficient to perform kinetic analyses and inhibition studies. The greatest advantage to this method is the ability to compare the relative populations of all modified peptide species present in a sample simultaneously and directly monitor the progression of methylation or acetylation over time, which is valuable to understand the progression of the enzymatic reaction. Compatibility with a number of common buffer components suggests that this method could easily be adapted for analysis of other methyltransferases and acetyltransferases.
Supplementary Material
Acknowledgments
We thank Dr. Matthew C.T. Hartman for his advice and help with the operation of the MALDI-MS. We thank Dr. Ronen Mamorstein (University of Pennsylvania) for providing the NatA plasmid. We thank Mr. Yunfei Mao for performing fluorescence kinetic studies. This work was supported by the Virginia Commonwealth University CTSA (UL1TR000058 from the National Center for Advancing Translational Sciences) as well as the A.D. Williams' Fund.
Footnotes
Abbreviations used: AdoHcy, S-adenosylhomocysteine; AdoMet, S-adenosylmethionine; CHCA, α-cyanohydroxycinnamic acid; DRQ, direct ratiometric quantification; DTT, dithiothreitol; MALDI, matrix-assisted laser desorption/ionization; NatA, protein N-terminal acetyltransferase A; NTMT1, protein N-terminal methyl-transferase 1; RCC1, regulator of chromosome condensation 1; SCL1, streptococcal collagen-like protein 1; TFA, trifluoroacetic acid.
Appendix A. Supplementary data: Supplementary data associated with this article can be found, in the online version, at http://dx.doi.org/10.1016/j.ab.2015.03.007.
References
- 1.Mellor J, Dudek P, Clynes D. A glimpse into the epigenetic landscape of gene regulation. Curr Opin Genet Dev. 2008;18:116–122. doi: 10.1016/j.gde.2007.12.005. [DOI] [PubMed] [Google Scholar]
- 2.Berdasco M, Esteller M. Aberrant epigenetic landscape in cancer: how cellular identity goes awry. Dev Cell. 2010;19:698–711. doi: 10.1016/j.devcel.2010.10.005. [DOI] [PubMed] [Google Scholar]
- 3.Bernstein BE, Meissner A, Lander ES. The mammalian epigenome. Cell. 2007;128:669–681. doi: 10.1016/j.cell.2007.01.033. [DOI] [PubMed] [Google Scholar]
- 4.Jones PA, Baylin SB. The epigenomics of cancer. Cell. 2007;128:683–692. doi: 10.1016/j.cell.2007.01.029. [DOI] [PMC free article] [PubMed] [Google Scholar]
- 5.Guo A, Gu H, Zhou J, Mulhern D, Wang Y, Lee KA, Yang V, Aguiar M, Kornhauser J, Jia X, Ren J, Beausoleil SA, Silva JC, Vemulapalli V, Bedford MT, Comb MJ. Immunoaffinity enrichment and mass spectrometry analysis of protein methylation. Mol Cell Proteomics. 2014;13:372–387. doi: 10.1074/mcp.O113.027870. [DOI] [PMC free article] [PubMed] [Google Scholar]
- 6.Choudhary C, Kumar C, Gnad F, Nielsen ML, Rehman M, Walther TC, Olsen JV, Mann M. Lysine acetylation targets protein complexes and co-regulates major cellular functions. Science. 2009;325:834–840. doi: 10.1126/science.1175371. [DOI] [PubMed] [Google Scholar]
- 7.Allali-Hassani A, Wasney GA, Siarheyeva A, Hajian T, Arrowsmith CH, Vedadi M. Fluorescence-based methods for screening writers and readers of histone methyl marks. J Biomol Screen. 2012;17:71–84. doi: 10.1177/1087057111422256. [DOI] [PubMed] [Google Scholar]
- 8.Collazo E, Couture J, Bulfer S, Trievel RC. A coupled fluorescent assay for histone methyltransferases. Anal Biochem. 2005;342:86–92. doi: 10.1016/j.ab.2005.04.007. [DOI] [PubMed] [Google Scholar]
- 9.Dorgan KM, Wooderchak WL, Wynn DP, Karschner EL, Alfaro JF, Cui Y, Zhou ZS, Hevel JM. An enzyme-coupled continuous spectrophotometric assay for S-adenosylmethionine-dependent methyltransferases. Anal Biochem. 2006;350:249–255. doi: 10.1016/j.ab.2006.01.004. [DOI] [PubMed] [Google Scholar]
- 10.Schäberle TF, Siba C, Höver T, König GM. An easy-to-perform photometric assay for methyltransferase activity measurements. Anal Biochem. 2013;432:38–40. doi: 10.1016/j.ab.2012.09.026. [DOI] [PubMed] [Google Scholar]
- 11.Wooderchak W. Assays for S-adenosylmethionine (AdoMet/SAM)-dependent methyltransferases. Curr Protoc Toxicol. 2008;38:4.26.1–4.26.12. doi: 10.1002/0471140856.tx0426s38. [DOI] [PubMed] [Google Scholar]
- 12.Berndsen CE, Denu JM. Assays for mechanistic investigations of protein/histone acetyltransferases. Methods. 2005;36:321–331. doi: 10.1016/j.ymeth.2005.03.002. [DOI] [PubMed] [Google Scholar]
- 13.Lakowski TM, Frankel A. A kinetic study of human protein arginine N-methyltransferase 6 reveals a distributive mechanism. J Biol Chem. 2008;283:10015–10025. doi: 10.1074/jbc.M710176200. [DOI] [PubMed] [Google Scholar]
- 14.Suh-Lailam BB, Hevel JM. A fast and efficient method for quantitative measurement of S-adenosyl-l-methionine-dependent methyltransferase activity with protein substrates. Anal Biochem. 2010;398:218–224. doi: 10.1016/j.ab.2009.09.005. [DOI] [PubMed] [Google Scholar]
- 15.Salyan MEK, Pedicord DL, Bergeron L, Mintier GA, Hunihan L, Kuit K, Balanda LA, Robertson BJ, Feder JN, Westphal R, Shipkova PA, Blat Y. A general liquid chromatography/mass spectroscopy-based assay for detection and quantitation of methyltransferase activity. Anal Biochem. 2006;349:112–117. doi: 10.1016/j.ab.2005.10.040. [DOI] [PubMed] [Google Scholar]
- 16.Li S, Gu XJ, Hao Q, Fan H, Li L, Zhou S, Zhao K, Chan HM, Wang YK. A liquid chromatography/mass spectrometry-based generic detection method for biochemical assay and hit discovery of histone methyltransferases. Anal Biochem. 2013;443:214–221. doi: 10.1016/j.ab.2013.08.029. [DOI] [PubMed] [Google Scholar]
- 17.Lakowski TM, Zurita-Lopez C, Clarke SG, Frankel A. Approaches to measuring the activities of protein arginine N-methyltransferases. Anal Biochem. 2010;397:1–11. doi: 10.1016/j.ab.2009.09.021. [DOI] [PMC free article] [PubMed] [Google Scholar]
- 18.Fiedler KL, Bheda P, Dai J, Boeke JD, Wolberger C, Cotter RJ. A quantitative analysis of histone methylation and acetylation isoforms from their deuteroacetylated derivatives: application to a series of knockout mutants. J Mass Spectrom. 2013;48:608–615. doi: 10.1002/jms.3198. [DOI] [PMC free article] [PubMed] [Google Scholar]
- 19.Hart-Smith G, Chia SZ, Low JKK, McKay MJ, Molloy MP, Wilkins MR. Stoichiometry of Saccharomyces cerevisiae lysine methylation: insights into non-histone protein lysine methyltransferase activity. J Proteome Res. 2014;13:1744–1756. doi: 10.1021/pr401251k. [DOI] [PubMed] [Google Scholar]
- 20.Patnaik D, Chin HG, Estève P, Benner J, Jacobsen SE, Pradhan S. Substrate specificity and kinetic mechanism of mammalian G9a histone H3 methyltransferase. J Biol Chem. 2004;279:53248–53258. doi: 10.1074/jbc.M409604200. [DOI] [PubMed] [Google Scholar]
- 21.Pahlich S, Bschir K, Chiavi C, Belyanskaya L, Gehring H. Different methylation characteristics of protein arginine methyltransferase 1 and 3 toward the Ewing Sarcoma protein and a peptide. Proteins. 2005;61:164–175. doi: 10.1002/prot.20579. [DOI] [PubMed] [Google Scholar]
- 22.Horton JR, Upadhyay AK, Qi HH, Zhang X, Shi Y, Cheng X. Enzymatic and structural insights for substrate specificity of a family of jumonji histone lysine demethylases. Nat Struct Mol Biol. 2010;17:38–43. doi: 10.1038/nsmb.1753. [DOI] [PMC free article] [PubMed] [Google Scholar]
- 23.Kudithipudi S, Kusevic D, Jeltsch A. Non-radioactive protein lysine methyltransferase microplate assay based on reading domains. ChemMedChem. 2014;9:554–559. doi: 10.1002/cmdc.201300111. [DOI] [PubMed] [Google Scholar]
- 24.Rusinova R, Shen YA, Dolios G, Padovan J, Yang H, Kirchberger M, Wang R, Logothetis DE. Mass spectrometric analysis reveals a functionally important PKA phosphorylation site in a Kir3 channel subunit. Pflugers Arch, EJP. 2009;458:303–314. doi: 10.1007/s00424-008-0628-9. [DOI] [PMC free article] [PubMed] [Google Scholar]
- 25.Greis KD. Mass spectrometry for enzyme assays and inhibitor screening: an emerging application in pharmaceutical research. Mass Spectrom Rev. 2007;26:324–339. doi: 10.1002/mas.20127. [DOI] [PubMed] [Google Scholar]
- 26.Guitot K, Scarabelli S, Drujon T, Bolbach G, Amoura M, Burlina F, Jeltsch A, Sagan S, Guianvarc'h D. Label-free measurement of histone lysine methyltransferases activity by matrix-assisted laser desorption/ionization time-of-flight mass spectrometry. Anal Biochem. 2014;456:25–31. doi: 10.1016/j.ab.2014.04.006. [DOI] [PubMed] [Google Scholar]
- 27.Greis KD, Zhou S, Burt TM, Carr AN, Dolan E, Easwaran V, Evdokimov A, Kawamoto R, Roesgen J, Davis GF. MALDI-TOF MS as a label-free approach to rapid inhibitor screening. J Am Soc Mass Spectrom. 2006;17:815–822. doi: 10.1016/j.jasms.2006.02.019. [DOI] [PubMed] [Google Scholar]
- 28.Smith AME, Awuah E, Capretta A, Brennan JD. A matrix-assisted laser desorption/ionization tandem mass spectrometry method for direct screening of small molecule mixtures against an aminoglycoside kinase. Anal Chim Acta. 2013;786:103–110. doi: 10.1016/j.aca.2013.05.027. [DOI] [PubMed] [Google Scholar]
- 29.Osborne TC, Obianyo O, Zhang X, Cheng X, Thompson PR. Protein arginine methyltransferase 1: positively charged residues in substrate peptides distal to the site of methylation are important for substrate binding and catalysis. Biochemistry. 2007;46:13370–13381. doi: 10.1021/bi701558t. [DOI] [PMC free article] [PubMed] [Google Scholar]
- 30.Rust HL, Zurita-Lopez CI, Clarke S, Thompson PR. Mechanistic studies on transcriptional coactivator protein arginine methyltransferase 1. Biochemistry. 2011;50:3332–3345. doi: 10.1021/bi102022e. [DOI] [PMC free article] [PubMed] [Google Scholar]
- 31.Blair LP, Avaritt NL, Huang R, Cole PA, Taverna SD, Tackett AJ. MassSQUIRM: an assay for quantitative measurement of lysine demethylase activity. Epigenetics. 2011;6:490–499. doi: 10.4161/epi.6.4.14531. [DOI] [PMC free article] [PubMed] [Google Scholar]
- 32.Tooley CES, Petkowski JJ, Muratore-Schroeder TL, Balsbaugh JL, Shabanowitz J, Sabat M, Minor W, Hunt DF, Macara IG. NRMT is an alpha-N-methyltransferase that methylates RCC1 and retinoblastoma protein. Nature. 2010;466:1125–1128. doi: 10.1038/nature09343. [DOI] [PMC free article] [PubMed] [Google Scholar]
- 33.Chen T, Muratore TL, Schaner-Tooley CE, Shabanowitz J, Hunt DF, Macara IG. N-terminal alpha-methylation of RCC1 is necessary for stable chromatin association and normal mitosis. Nat Cell Biol. 2007;9:596–603. doi: 10.1038/ncb1572. [DOI] [PMC free article] [PubMed] [Google Scholar]
- 34.Bailey AO, Panchenko T, Sathyan KM, Petkowski JJ, Pai P, Bai DL, Russell DH, Macara IG, Shabanowitz J, Hunt DF, Black BE, Foltz DR. Posttranslational modification of CENP-A influences the conformation of centromeric chromatin. Proc Natl Acad Sci USA. 2013;110:11827–11832. doi: 10.1073/pnas.1300325110. [DOI] [PMC free article] [PubMed] [Google Scholar]
- 35.Dai X, Otake K, You C, Cai Q, Wang Z, Masumoto H, Wang Y. Identification of novel alpha-N-methylation of CENP-B that regulates its binding to the centromeric DNA. J Proteome Res. 2013;12:4167–4175. doi: 10.1021/pr400498y. [DOI] [PMC free article] [PubMed] [Google Scholar]
- 36.Hwang C, Shemorry A, Varshavsky A. N-terminal acetylation of cellular proteins creates specific degradation signals. Science. 2010;327:973–977. doi: 10.1126/science.1183147. [DOI] [PMC free article] [PubMed] [Google Scholar]
- 37.Starheim KK, Gevaert K, Arnesen T. Protein N-terminal acetyltransferases: when the start matters. Trends Biochem Sci. 2012;37:152–161. doi: 10.1016/j.tibs.2012.02.003. [DOI] [PubMed] [Google Scholar]
- 38.Liszczak G, Goldberg JM, Foyn HV, Petersson EJ, Arnesen T, Marmorstein R. Molecular basis for N-terminal acetylation by the heterodimeric NatA complex. Nat Struct Mol Biol. 2013;20:1098–1105. doi: 10.1038/nsmb.2636. [DOI] [PMC free article] [PubMed] [Google Scholar]
- 39.Fraga MF, Ballestar E, Villar-Garea A, Boix-Chornet M, Espada J, Schotta G, Bonaldi T, Haydon C, Ropero S, Petrie K, Iyer NG, Pérez-Rosado A, Calvo E, Lopez JA, Cano A, Calasanz MJ, Colomer D, Piris MA, Ahn N, Imhof A, Caldas C, Jenuwein T, Esteller M. Loss of acetylation at Lys16 and trimethylation at Lys20 of histone H4 is a common hallmark of human cancer. Nat Genet. 2005;37:391–400. doi: 10.1038/ng1531. [DOI] [PubMed] [Google Scholar]
- 40.Santhiya D, Dias RS, Shome A, Das PK, Miguel MG, Lindman B, Maiti S. Role of linker groups between hydrophilic and hydrophobic moieties of cationic surfactants on oligonucleotide-surfactant interactions. Langmuir. 2009;25:13770–13775. doi: 10.1021/la901546t. [DOI] [PubMed] [Google Scholar]
- 41.Richardson SL, Mao Y, Zhang G, Hanjra P, Peterson DL, Huang R. Kinetic mechanism of protein N-terminal methyltransferase 1. J Biol Chem. 2015 doi: 10.1074/jbc.M114.626846. [DOI] [PMC free article] [PubMed] [Google Scholar]
- 42.Rechthaler J, Pittenauer E, Schaub TM, Allmaier G. Detection of amine impurity and quality assessment of the MALDI matrix alpha-cyano-4-hydroxy-cinnamic acid for peptide analysis in the amol range. J Am Soc Mass Spectrom. 2013;24:701–710. doi: 10.1007/s13361-013-0614-0. [DOI] [PubMed] [Google Scholar]
- 43.Smirnov IP, Zhu X, Taylor T, Huang Y, Ross P, Papayanopoulos IA, Martin SA, Pappin DJ. Suppression of alpha-cyano-4-hydroxycinnamic acid matrix clusters and reduction of chemical noise in MALDI-TOF mass spectrometry. Anal Chem. 2004;76:2958–2965. doi: 10.1021/ac035331j. [DOI] [PubMed] [Google Scholar]
- 44.Dave KA, Headlam MJ, Wallis TP, Gorman JJ. Preparation and analysis of proteins and peptides using MALDI TOF/TOF mass spectrometry. Curr Protoc Protein Sci. 2011;63:16.13.1–16.13.21. doi: 10.1002/0471140864.ps1613s63. [DOI] [PubMed] [Google Scholar]
- 45.Zhu X, Papayannopoulos IA. Improvement in the detection of low concentration protein digests on a MALDI TOF/TOF workstation by reducing alpha-cyano-4-hydroxycinnamic acid adduct ions. J Biomol Tech. 2003;14:298–307. [PMC free article] [PubMed] [Google Scholar]
- 46.Kang J, Toita R, Oishi J, Niidome T, Katayama Y. Effect of the addition of diammonium citrate to alpha-cyano-4-hydroxycinnamic acid (CHCA) matrix for the detection of phosphorylated peptide in phosphorylation reactions using cell and tissue lysates. J Am Soc Mass Spectrom. 2007;18:1925–1931. doi: 10.1016/j.jasms.2007.08.002. [DOI] [PubMed] [Google Scholar]
- 47.Cohen SL, Chait BT. Influence of matrix solution conditions on the MALDI- MS analysis of peptides and proteins. Anal Chem. 1996;68:31–37. doi: 10.1021/ac9507956. [DOI] [PubMed] [Google Scholar]
- 48.Petkowski J, Schaner Tooley CE, Anderson LC, Shumilin IA, Balsbaugh JL, Shabanowittz J, Hunt DF, Minor W, Macara IG. Substrate specificity of mammalian N-terminal α-amino methyltransferase. Biochemistry. 2012;51:5942–5950. doi: 10.1021/bi300278f. [DOI] [PMC free article] [PubMed] [Google Scholar]
- 49.Perrot M, Massoni A, Boucherie H. Sequence requirements for N-α-terminal acetylation of yeast proteins by NatA. Yeast. 2008;25:513–527. doi: 10.1002/yea.1602. [DOI] [PubMed] [Google Scholar]
- 50.Oliver-Kozup HA, Elliott M, Bachert BA, Martin KH, Reid SD, Schwegler-Berry DE, Green BJ, Lukomski S. The streptococcal collagen-like protein-1 (Scl1) is a significant determinant for biofilm formation by group A Streptococcus. BMC Microbiol. 2011;11:262–275. doi: 10.1186/1471-2180-11-262. [DOI] [PMC free article] [PubMed] [Google Scholar]
Associated Data
This section collects any data citations, data availability statements, or supplementary materials included in this article.