Abstract
Purpose
To determine the effects of age and sex on the amplitude and latency scores obtained by the RAPDx® pupillometer, and to determine the standard values for detecting relative afferent pupillary defect (RAPD) in healthy subjects.
Methods
The study was conducted on 84 healthy subjects (52 males, 32 females), who had no ophthalmic diseases other than refractive errors with a mean age of 32 years. The amplitude and latency scores of the males were compared to that of females and also among the different age groups. The correlations between the amplitude and latency scores and age were determined. The standard values with the 90%, 95%, and 99% prediction intervals of the measured values were also calculated.
Results
The differences in the amplitude and latency scores between the sexes were not significant. In addition, both scores were not significantly related with age. The mean amplitude score for all subjects with prediction intervals of 90%, 95%, and 99% was 0.02 (−0.26 to 0.30, −0.32 to 0.35, and −0.42 to 0.46, respectively); the latency score was −0.02 (−0.24 to 0.20, −0.28 to 0.25, and −0.37 to 0.33, respectively).
Conclusions
RAPD is not present when the absolute values of the amplitude score and latency scores, measured by the RAPDx® pupillometer, are ≤ 0.2 log units. RAPD is present when either of the values are ≥ 0.5 log units.
Translational Relevance
Results of this study can be used for detection of RAPD in the clinic and it will be the basic data of RAPDx® pupillometer for future research.
Keywords: relative afferent pupillary defect, standard values, age, gender
Introduction
The normal response of the pupils to light stimulation is an equal constriction of both pupils, the direct and consensual light reflexes. If the stimulation light is moved quickly from one eye to the other, both pupils hold their level of constriction, but in patients with a relative afferent pupillary defect (RAPD), both pupils dilate when the light is moved from the good to the affected eye. This RAPD is caused by an imbalance in the neural output from the two eyes,1 and it can be detected by swinging a flashlight quickly between the unaffected to the affected eyes. Detecting RAPD is important because its presence is a sign of a lesion in the retina or the optic nerve. However, the detection of the pupillary changes is made by the clinician, which is difficult when the pupils are small or when the findings are varied.
To overcome this qualitative method, a method was developed that consisted of attenuating the intensity of the light stimulus to the normal eye by neutral density (ND) filters until the pupillary dilation is not present when the stimulus light is switched to the affected eye. However, this method still requires a subjective evaluation by the clinician.2
The RAPDx® pupillometer (Konan Medical USA, Inc., Irvine, CA) that can determine the presence and quantify the degree of RAPD objectively was developed. This instrument records the time course of the pupillary responses of the two eyes that is elicited by alternating the light stimulus between the two eyes. The software embedded in the RAPDx® pupillometer can determine the amplitude and latency scores from the pupillary constriction after stimulating the unaffected eye and after stimulating the affected eye. The software uses the scores to determine whether RAPD is present. Unstable data, e.g., blinking and fixation loss, prompts the RAPDx® pupillometer to retest the responses automatically, and only artifact-free data are analyzed. The instrument can be used after a dark-adaptation period of only 1 minute,3 whereas a dark-adaptation of up to 15 minutes is necessary when examining the conventional light reflexes. Thus, the RAPDx® pupillometer has become a useful clinical instrument.
In our previous study, we found that the data obtained by the RAPDx® pupillometer were valid, reproducible, and reliable.3 This instrument has been used to determine whether RAPD was present in patients with glaucoma,4–9 amblyopia,10 and optic nerve diseases.11 However, there have not been any studies determining the standard values of the amplitude and latency scores of the RAPDx® pupillometer in healthy eyes.
Thus, the purpose of this study was to determine the effects of age and sex on the amplitude and latency scores recorded by the RAPDx® pupillometer. Another purpose of this study was to determine the standard values that can be used to diagnose the presence of RAPD.
Methods
Subjects
This was a cross-sectional study conducted on 84 healthy subjects (52 males and 32 females) who had no ophthalmic diseases other than refractive errors. The subjects ranged in age from 20 to 53 years with a mean of 32 years. There were 37 subjects who were 20 to 29 years old, 33 subjects who were 30 to 39 years old, and 14 subjects who were 40 to 53 years old.
The procedures used in this study were approved by the Institutional Review Board of Kitasato University (approval number B15-35), and they conformed to the tenets of the Declaration of Helsinki. A written informed consent was obtained from each of the volunteers after an explanation of the purpose, risks, potential discomfort, and steps of the study.
Study
After 5 minutes of dark-adaptation, the pupillary responses of both eyes were recorded with the RAPDx® pupillometer under the following conditions5: background illuminance of 0.5 lx, field of view of 30 degrees, white stimulus illuminance of 30.9 lx, stimulus duration of 0.2 seconds, stimulation interval of 2.1 seconds, and number of stimuli summated 18. Recordings were made during the stimulation of the right and left eyes.
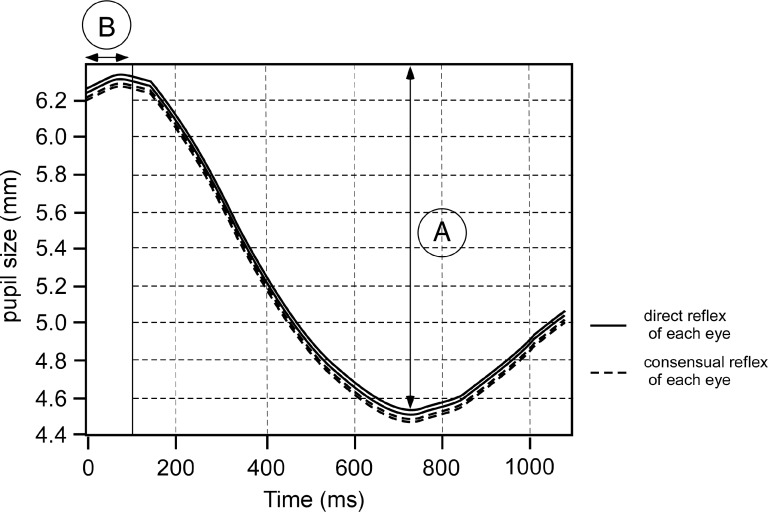
For the 18 stimuli, the first two were excluded and the remaining 16 stimuli were summated. The relative amplitude of the pupillary constriction was defined as the ratio of the maximum constricted pupil size divided by the resting pupil size, e.g., a 5 -mm pupil contracting to 4 mm had a relative amplitude change of 4/5 or 0.2. The latency was defined as the interval between the beginning of the stimulus to the detection of a significant pupillary constriction5 (Fig. 1).
Figure 1.
Definitions of amplitude (%) and latency (msec). Solid line: direct light reflex of the eye. Dotted line: indirect light reflex of the eye. (A) Amplitude. (B) Latency.
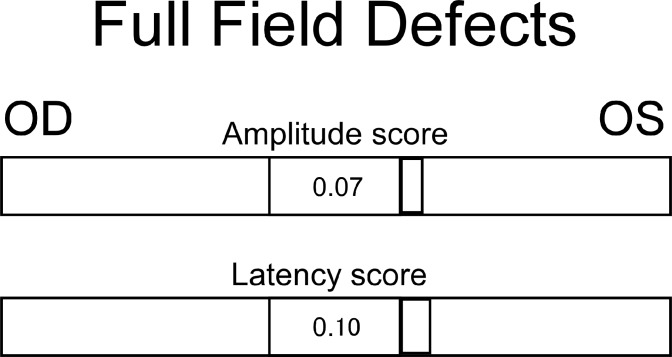
The amplitude score was calculated as 10 × log10 (amplitude of left eye/amplitude of right eye), and the latency score as 10 × log10 (latency of left eye/latency of right eye) automatically by RAPDx® pupillometer. The values obtained by these formulae were defined as the “measured values.” Positive RAPD values indicated the presence of RAPD of the right eye, and negative RAPD values indicated the presence of RAPD of the left eye. For example, if the amplitude of right eye was 0.3 and the amplitude of left eye was 0.2, the amplitude score was 1.76, and a diagnosis of RAPD of the left eye would be made. The measured values are displayed automatically (Fig. 2). The “absolute value” is the absolute value of the “measured values,” and it is used to evaluate magnitude of the RAPD. Both the measured and absolute values were analyzed.
Figure 2.
Results of amplitude scores and latency scores. An amplitude score of 0.07 log units indicates that a RAPD is present in the left eye. A latency score of 0.10 log units indicates that RAPD is present in the left eye.
Statistical Analyses
We confirmed that the amplitude and the latency scores were normally distributed by Chi-square tests. The measured and absolute values were compared between the sexes and among the age groups. In the comparison between the sexes, the measured values were analyzed using t tests, and the absolute values using the Mann-Whitney test. In the comparisons among the age groups, the measured values were analyzed using analysis of variance, and the absolute values using the Kruskal-Wallis test. In addition, the correlation of RAPD scores with age was determined by the Pearson product-moment correlation coefficients. As the standard values, 90%, 95%, and 99% prediction intervals were determined from the measured values: the average values and the upper and lower limits. A P value of < 0.05 was considered statistically significant. Statistical analysis was performed using commercially available statistical software (SPSS, version 19.0; IBM Corporation, Armonk, NY).
Results
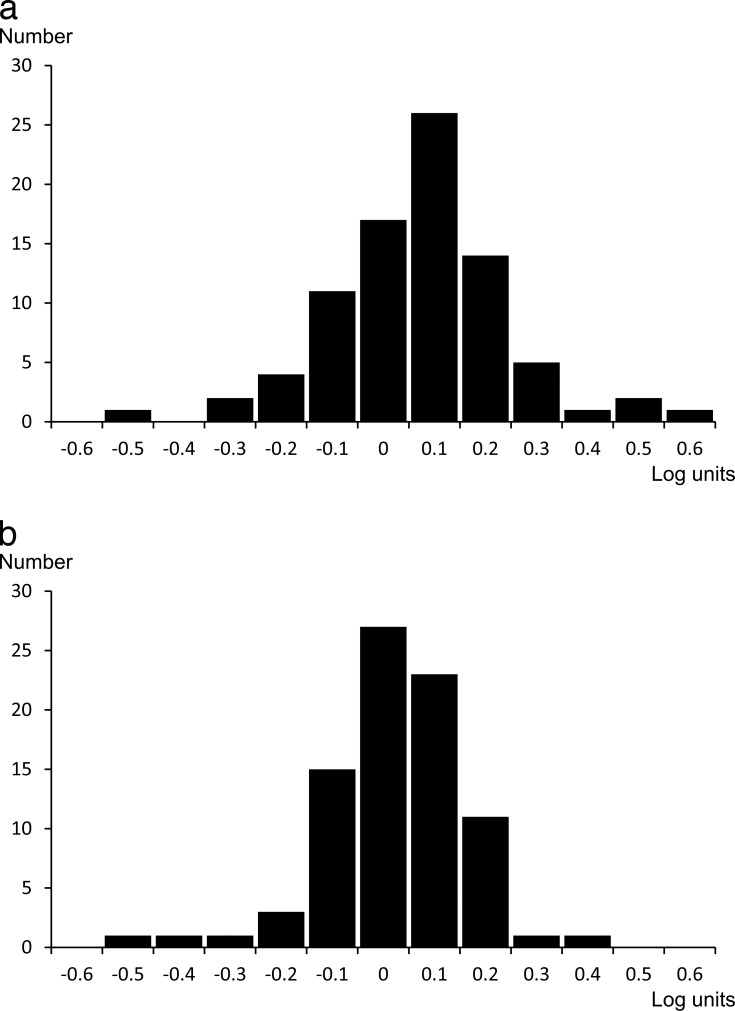
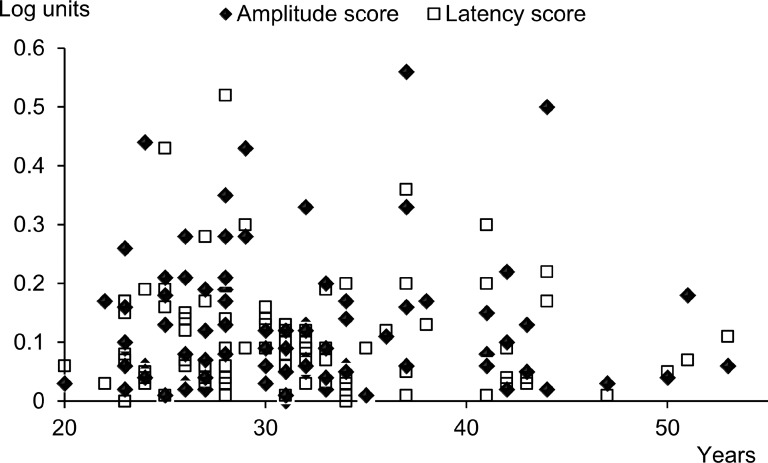
The amplitude score (P > .05; Fig. 3a) and the latency score (P > .05; Fig. 3b) were normally distributed. The measured and absolute amplitude scores and latency scores are shown in Tables 1 and 2. None of the measured or absolute values for the males differed significantly from that of females (P > 0.05), and neither the absolute amplitude score nor the latency score was significantly correlated with the age (P > 0.05; Fig. 4). The mean measured value (90%, 95%, 99% prediction interval) of the amplitude score in all subjects was 0.02 (−0.26 to 0.30, −0.32 to 0.35, −0.42 to 0.46, respectively), and that of the latency score was −0.02 (−0.24 to 0.20, −0.28 to 0.25, −0.37 to 0.33).
Figure 3.
Histogram of amplitude scores and latency scores. (a) Amplitude scores. (b) Latency scores.
Table 1.
Comparison of Sex with Regard to Amplitude Score and Latency Score

Table 2.
Comparison of Age Groups with Regard to Amplitude Score and Latency Score
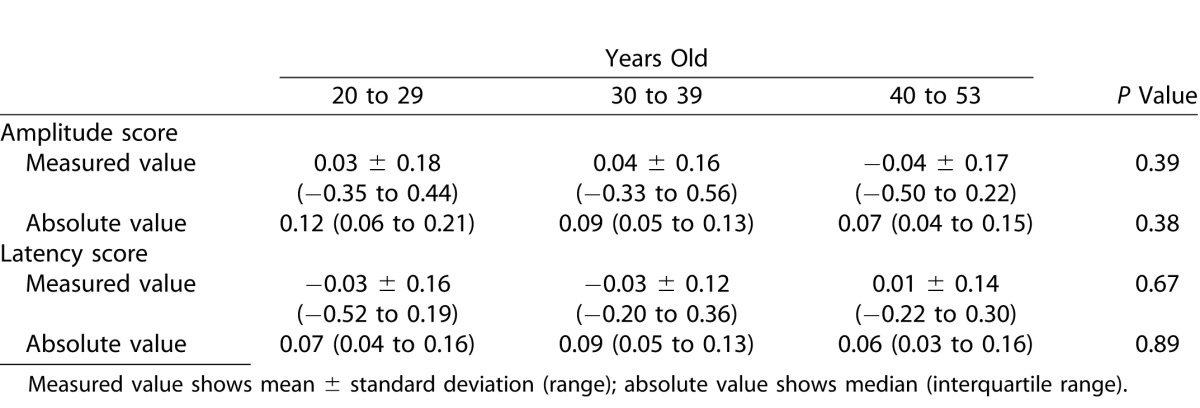
Figure 4.
Correlation between amplitude score, latency score, and age. The absolute values of the amplitude score and the absolute values of the latency score are not significantly correlated with age (P = 0.21 and P = 0.54, respectively).
Discussion
Our results using the RAPDx® pupillometer showed that the measured and absolute amplitude and latency scores of males did not differ significantly from that of females. In addition, these values were also not significantly different among the different age groups. In addition, the absolute values of these parameters were not significantly correlated with age.
This absence of significant differences is because the measurements with the RAPDx® pupillometer was always carried out under the same conditions for both eyes, and both the amplitude and latency scores were ratios of the left to the right eye scores. Therefore, the amplitude and latency scores should not be affected by the sex or age. These findings indicated that both the amplitude and latency scores can be used easily.
The average of the measured values of both parameters was 0.02 log units, and the 95% prediction interval was approximately −0.3 to 0.3 log units. Kawasaki et al.12,13 introduced a method for quantifying the presence of a RAPD using ND filters. However, there were large variations in the confidence intervals of > 0.5 log units even in normal subjects, and a RAPD of 0.3 log units could be present in normal eyes.
The RAPDx® pupillometer is different from the subjective method of neutralizing the differences in the pupillary constriction by ND filters in that it quantitatively evaluates the differences in the degree of pupillary constriction of the two eyes. However, both methods are based on the degree of light-induced constriction, so it may be that the amplitude and latency scores should have some variability. When we evaluated the reproducibility of the results in healthy subjects,3 the amplitude scores and latency scores of the pupillary responses recorded with the RAPDx® pupillometer had a variability of approximately 0.3 log units.
The mean and median values of the absolute values for the amplitude and latency scores of RAPDx® pupillometer in healthy eyes have been reported by Chang et al.4 and Tatham et al.,8 and our values are comparable with their scores. Thus in healthy subjects, both parameters have a range of approximately 0.3 log units as was the case with the ND filter method, i.e., a RAPD of approximately 0.3 log units can be present in healthy subjects.
In healthy subjects with the 90% prediction interval that excludes the 5% at both ends of the distribution, the amplitude score was −0.26 to 0.30 and the latency score was −0.24 to 0.20 for normal eyes. If both parameters are within this range, RAPD does not exist. Considering the 99% prediction interval that excludes 0.5% of the eyes at both ends of the distribution, the amplitude score was −0.42 to 0.46 and the latency score was −0.37 to 0.33. If both parameters are outside these ranges, RAPD exists.
In conclusion, our study determined the standard values for detecting RAPD using the RAPDx® pupillometer that can be used in the clinic. RAPD is not present when the absolute values of both the amplitude and latency scores are ≤ 0.2 log units, and RAPD is present when the absolute values are ≥ 0.5 log units.
Acknowledgments
Disclosure: T. Satou, None; T. Goseki, None; K. Asakawa, None; H. Ishikawa, None; K. Shimizu, None
References
- 1. Levatin P. Pupillary escape in disease of the retina or optic nerve. Arch Ophthalmol. 1959; 62: 768–779. [DOI] [PubMed] [Google Scholar]
- 2. Thompson HS,, Corbett JJ,, Cox TA. How to measure the relative afferent pupillary defect. Surv Ophthalmol. 1981; 26: 39–42. [DOI] [PubMed] [Google Scholar]
- 3. Satou T,, Goseki T,, Asakawa K,, Ishikawa H,, Shimizu K. Effects of dark adaptation time on measurement values and its reproducibility using RAPDx® device in healthy subjects. Neuro-Ophthalmol Jpn. 2015; 32: 263–268. [in Japanese]. [Google Scholar]
- 4. Chang DS,, Arora KS,, Boland MV,, Supakontanasan W,, Friedman DS. Development and validation of an associative model for the detection of glaucoma using pupillography. Am J Ophthalmol. 2013; 156: 1285–1296. [DOI] [PMC free article] [PubMed] [Google Scholar]
- 5. Ozeki N,, Yuki K,, Shiba D,, Tsubota K. Pupillographic evaluation of relative afferent pupillary defect in glaucoma patients. Br J Ophthalmol. 2013; 97: 1583–1542. [DOI] [PubMed] [Google Scholar]
- 6. Chang DS,, Boland MV,, Arora KS,, Supakontanasan W,, Chen BB,, Friedman DS. Symmetry of the pupillary light reflex and its relationship to retinal nerve fiber layer thickness and visual field defect. Invest Ophthalmol Vis Sci. 2013; 54: 5596–5601. [DOI] [PMC free article] [PubMed] [Google Scholar]
- 7. Tatham AJ,, Meira-Freitas D,, Weinreb RN,, Marvasti AH,, Zangwill LM,, Medeiros FA. Estimation of retinal ganglion cell loss in glaucomatous eyes with a relative afferent pupillary defect. Invest Ophthalmol Vis Sci. 2014; 55: 513–522. [DOI] [PMC free article] [PubMed] [Google Scholar]
- 8. Tatham AJ,, Meira-Freitas D,, Weinreb RN,, Zangwill LM,, Medeiros FA. Detecting glaucoma using automated pupillography. Ophthalmology. 2014; 121: 1185–1193. [DOI] [PMC free article] [PubMed] [Google Scholar]
- 9. Waisbourd M,, Lee B,, Ali MH,, et al. Detection of asymmetric glaucomatous damage using automated pupillography, the swinging flashlight method and the magnified-assisted swinging flashlight method. Eye (Lond). 2015; 29: 1321–1328. [DOI] [PMC free article] [PubMed] [Google Scholar]
- 10. Law CL,, Siu M,, Modica P,, Backus B. Stimulus characteristics affect assessment of pupil defects in amblyopia. Optom Vis Sci 2015; 92: 551–558. [DOI] [PubMed] [Google Scholar]
- 11. Takizawa G,, Miki A,, Maeda F,, et al. Association between a relative afferent pupillary defect using pupillography and inner retinal atrophy in optic nerve disease. Clin Ophthalmol. 2015; 9: 1895–1903. [DOI] [PMC free article] [PubMed] [Google Scholar]
- 12. Kawasaki A,, Moore P,, Kardon RH. Variability of the relative afferent pupillary defect. Am J Ophthalmol. 1995; 120: 622–633. [DOI] [PubMed] [Google Scholar]
- 13. Kawasaki A,, Moore P,, Kardon RH. Long-term fluctuation of relative afferent pupillary defect in subjects with normal visual function. Am J Ophthalmol. 1996; 122: 875–882. [DOI] [PubMed] [Google Scholar]


