

Abstract
Background
Pregnant women are an especially important population to monitor for environmental exposures given the vulnerability of the developing fetus. During pregnancy and lactation chemical body burdens may change due to the significant physiological changes that occur. Developmental exposures to some persistent organic pollutants (POPs) have been linked with adverse health outcomes.
Methods
First trimester maternal and cord blood plasma concentrations of several POPs including polychlorinated biphenyls (PCBs), organochlorine pesticides (OCs), polybrominated diphenyl ethers (PBDE)s and perfluoroalkyl substances (PFASs) were measured in samples from 1983 pregnant women enrolled in the Maternal-Infant Research on Environmental Chemicals (MIREC) cohort. Predictors of exposure were also identified.
Results
In maternal plasma, there was >90 % detection for the perfluoroalkyl substances (PFASs) perfluorooctanoic acid (PFOA), perfluoroctane sulfonate (PFOS), perfluorohexane sulfonate (PFHxS), and dichlorodiphenyldichloroethylene (DDE), oxychlordane and PCB 138 and 153. Cord blood plasma had much lower detection rates with low or very limited detection for most PCBs and PBDEs. The PFASs were the most frequently detected (23–64 %) chemical class in cord plasma. In a subset of 1st and 3rd trimester paired samples, PFAS concentrations were found to be strongly correlated and had ICCs ranging from 0.64 (PFOA) to 0.83 (PFHxS). The cord:maternal plasma concentration ratios ranged from 0.14 (PFOS) to 0.87 (oxychlordane, lipid adjusted). Similar to other studies, we found parity, maternal age, income, education, smoking status, pre-pregnancy BMI and fish consumption to be significant predictors for most chemicals. Those participants who were foreign-born had significantly higher concentrations of organochlorinated pesticides and PCBs.
Conclusions
In the MIREC study, multiple chemical contaminants were quantified in the plasma of pregnant women. In cord plasma PFOA had the highest detection rate. However, compared to other Canadian and international population studies, the MIREC participants had lower contaminant concentrations of these substances.
Electronic supplementary material
The online version of this article (doi:10.1186/s12940-016-0143-y) contains supplementary material, which is available to authorized users.
Keywords: POPs, DDT, PCBs, PBDEs, PFASs, Cord plasma, Maternal plasma, Pregnant
Background
Persistent organic pollutants (POPs), including organochlorine pesticides (OCs), industrial chemicals and their by-products are chemicals that persist in the environment and tend to bioaccumulate, possess toxic properties, and resist degradation [1]. Several biomonitoring studies have measured POPs in human plasma [2–4], milk [5, 6], and cord blood [7–9].
Perfluoroalkyl substances (PFASs) are heat stable, non-flammable and able to repel water and oils. They are used in a wide variety of products including non-stick cookware, breathable all weather clothing, wiper blades, wire and cable insulation, fire retardant foams, lubricants, paper coatings, pharmaceuticals, and nail polish [2]. They are very stable compounds and therefore highly persistent in the environment [10]. In 2002, 3M, the main manufacturer of PFOS ceased production in the U.S. and the EPA finalized new rules to help limit the future manufacturing and importation of these substances [11]. Efforts were implemented in 2006 to drastically reduce emissions of PFOA and its precursors by 95 % by 2010 and to work towards eliminating emissions and product content by 2015 [12]. Exposures to humans mainly occur through diet [13, 14].
PBDEs are a class of brominated flame retardants that are environmentally persistent, bioaccumulate and biomagnify in terrestrial food chains [15]. Studies have found PBDEs in fish, dairy products and eggs [16, 17]. House dust [18, 19] has also been suggested as a significant source of exposure, especially for children [20]. The Government of Canada has placed restrictions on some PBDEs under the Canadian Environmental Protection Act, 1999 in order to protect the environment. As of 2008 regulation prohibit the manufacturing of all PBDEs in Canada, and restrict the import and sale of PBDEs in mixtures [21]. Furthermore, as of 2009 there has been a phasing out of penta- and octa-BDEs had occurred in North America, Europe, Australia and Japan [22].
Pregnant women are an especially important population to include in biomonitoring and epidemiological studies given the susceptibility of the developing fetus [10, 23, 24] to the potential adverse health effects arising from exposure to environmental chemicals. During pregnancy and lactation, body burdens of chemicals may change due to the significant physiological changes that occur. The pregnant woman experiences increased blood volume, enhanced metabolism, increased renal perfusion as well as substantial changes to circulating hormones, essential elements and serum lipids [25, 26]. These changes may have an impact on absorption, distribution, metabolism and excretion of environmental contaminants, which has potentially serious implications for developmental exposures of the fetus. Some POP exposures during fetal developmental have been linked with thyroid hormone disruption [23, 27–29], adverse birth outcomes [30–32], poorer respiratory health [33], obesity [34], and neurotoxicity [35, 36].
This article describes both maternal and cord plasma concentrations of several POPs including polychlorinated biphenyls (PCBs), OC pesticides, polybrominated diphenyl ethers (PBDE)s and perfluoroalkyl substances (PFASs) measured in the Canadian prospective cohort, Maternal-Infant Research on Environmental Chemicals (MIREC). We also explored maternal and infant characteristics to identify elevated exposure groups.
Methods
The MIREC Study is a national-level pregnancy cohort of approximately 2000 women recruited from 10 cities across Canada and has been previously described [37]. The MIREC study is based on a convenience sample and enrolled pregnant women from the general population who were attending prenatal clinics (ultrasound, midwife and/or doctor’s clinics) during the first trimester of pregnancy (6 to <14 weeks) between 2008 and 2011. Research Ethics Board approval was obtained from all participating sites and Health Canada. Women who gave informed consented scheduled visits in each trimester, at delivery and in the postpartum period (up to 8-10 weeks). At each pregnancy visit women completed questionnaires and provided both blood and urine samples. The questionnaires collected information such as sociodemographics, current and previous pregnancies, diet, smoking and lifestyle. Maternal blood was collected in 10 mL K2 EDTA tubes; plasma was transferred into 2.5 mL pre-cleaned glass vials (Supelco®) for the POPs analysis and a 5 mL Sarstedt® tube for the PFASs analysis. Cord blood was collected at delivery using a Baxter bag® and then transferred into tubes as described above for maternal blood. Samples were stored at -20 °C.
In the MIREC study there were close to 300 chemical metabolites measured in maternal urine, blood, cord blood, meconium and breast milk which have been described elsewhere [37]. These chemicals were chosen based on evidence of potential reproductive toxicity, and valid laboratory methods available for biomarkers. A subset of chemicals was also chosen based on that measured in Cycle 1 (2007–2009) of the Canadian Health Measures Survey [2] so that comparisons could be made to the general population biomonitoring data, given that measurements were made by the same laboratory. Only the persistent organic pollutants and PFASs measured in maternal and cord plasma are reported in this article. A total of 24 polychlorinated biphenyls (PCB 28, 52, 66, 74, 99, 101, 105, 118, 128, 138, 146, 153, 156, 163, 167, 170, 178, 180, 183, 187, 194, 201, 203 and 206), 14 organochlorinated pesticides (aldrin, beta-hexachlorocyclohexane (β-HCH), gamma-hexachlorocyclohexane (γ-HCH), hexachlorobenzene, cis-nonachlor, trans-nonachlor, α-chlordane, γ-chlordane, oxychlordane, dichlorodiphenyldichloroethylene (DDE), p,p’-dichlorodiphenyltrichloroethane (DDT), mirex, toxaphenes Parlar 26 and 50) and 9 polybrominated diphenyl ethers (PBDE 15, 17, 25, 28, 33, 47, 99, 100, 153) and hexabromobiphenyl (PBB 153) were measured by the Centre de Toxicologie du Québec (CTQ) of the Institut National de Santé Publique du Québec (INSPQ) in 1st trimester maternal plasma samples as well as cord plasma samples. The PFASs perfluorooctane sulfonate (PFOS), perfluorooctanoic acid (PFOA) and perfluorohexane sulfonate (PFHxS) were also measured in both 1st trimester maternal and cord plasma. For a subset of participants (n = 48) PFASs were also measured in the 3rd trimester.
Analytical methods
Two mL of plasma was enriched with labeled internal standards (PCB 141-13C12, PCB 153, -13C12, PCB 180-13C12, PCB 194-13C12, hexachlorobenzene-13C6, α-HCH-13C6, trans-nonachlor-13C10, oxychlordane-13C10, p,p’-DDE-13C12, Parlar 26-13C10, Parlar 50-13C10, PBDE-77-13C12) plus analogous internal standards (3,6-F2-PBDE 99, PBDE 101) and proteins were denaturated with reagent grade alcohol. POP compounds were extracted with hexane from the aqueous matrix using a liquid-liquid extraction in the presence of a saturated ammonium sulfate solution for salting out. Thereafter, the extracts were evaporated to dryness before they were redissolved in 0.5 mL of hexane. These extracts were further purified on activated florisil columns and which were eluted with a mixture of dichloromethane:hexane (9 mL; 25:75) prior to GC-MS analysis.
The solvent was then evaporated, the residual taken up in 20 μL of hexane and analyzed for POP compounds on an Agilent 6890 Network or 7890A gas chromatograph (GC) coupled to an Agilent 5973 Network or 5975C mass spectrometer (MS) (Agilent Technologies; Mississauga, Ontario, Canada). The GC was fitted with an Agilent 60 m DB-XLB column (0.25 mm i.d., 0.25 μm film thickness) for detection by MS and with an Agilent Ultra-1 50 m (0.20 mm i.d., 0.33 μm film thickness) (Agilent Technologies; Mississauga, Ontario, Canada) column for the Electron Capture Detector (ECD). The carrier gas was helium and the injections were 3 μL in splitless mode. The mass spectrometer was operated in selected ion monitoring (SIM) mode, using negative chemical ionization (NCI) with methane (99.97 %) as the reagent gas. The ECD serves only to quantify PCB congeners 28 and 52 when the detection limits for these compounds were not achieved with the mass detector.
Concentrations were reported in units of micrograms per liter (μg/L) and the limits of detection (LOD) were between 0.005 and 0.3 μg/L for POPs. LODs were determined by first estimating concentrations of analytes yielding a signal to noise ratio of 3. Plasma samples spiked with analytes in concentrations ranging from 4 to 10 times the estimated LODs were analyzed (10 replicates) and standard deviations were multiplied by three to obtain the LODs. The method recoveries for each analyte varied from 68 to 90 %. The intra-day precision (repeatability) and the inter-day precision (reproducibility) of the method were respectively between 1.2 to 8.3 % and 2.8 to 13 %. Total cholesterol (TC), free cholesterol (FC), triglycerides (TG) and phospholipids (PL) levels were also measured in these samples by enzymatic methods combined with colorimetry (in g/L) at the laboratory of Centre Hospitalier de l’Université Laval (CHUL; Quebec, Quebec) and used to calculate the total lipid level as 1.677*(TC-FC) + FC + TG + PL [38].
The PFAS analysis was performed as described in the Canadian Health Measures Survey (CHMS) Cycle 1 report [2]. The LODs were between 0.1 to 0.3 μg/L for the compounds PFHxS, PFOA and PFOS. The intra-day precision varied between 5.4 and 6.3 % and the inter-day precision varied between 4.9 and 10 %.
The internal reference materials used to control the quality of the analyses were the certified reference material SRM-1958 (POPs and PFASs) from the National Institute of Standards and Technology (NIST; Gaithersburg, MD), the reference materials W-09-02 and W-10-06 (POPs) from the External Quality Assessment Scheme within the Arctic Monitoring and Assessment Program (AMAP) (Centre de toxicologie du Québec (CTQ), Institut National de Santé Publique du Québec (INSPQ), Québec, Canada) and some in-house reference materials for PFASs.
The overall quality and accuracy for both analytical methods was monitored by participation in the interlaboratory program AMAP External Quality Assessment Scheme (Centre de toxicologie du Québec (CTQ), Institut National de Santé Publique du Québec (INSPQ), Québec, Canada) as well as the German External Quality Assessment Scheme (G-EQUAS; Erlangen, Germany).
Statistical analysis
As most contaminants had values below the limit of detection, censoring methods [39] were implemented for descriptive statistics, hypothesis tests and linear regressions. Such techniques are classified as either parametric methods, such as maximum likelihood (ML) estimation, or nonparametric methods, such as Kaplan-Meier (KM) and the generalized Wilcoxon test [39]. Total lipids were included in the models of all POPs other than the PFASs as a covariate.
Descriptive statistics including sample size, detection limit, percentage of observations below the limit of detection (LOD), minimum, median, 95th percentile, maximum, geometric mean, geometric standard error and associated 95 % confidence interval were reported for maternal and cord plasma concentrations of POPs, both adjusted and unadjusted for total lipids, with the exception of PFASs which were not lipid-adjusted. Note that the highest detection limit is presented in tables when several detection limits were noted.
For censoring methods, the geometric mean and 95 % confidence interval were calculated using the ML method and compared to the empirical median from the KM approach. The Greenwood estimate of variance was used for determination of Kaplan-Meier confidence intervals. Contaminants having the % < LOD of approximately 50 % were analyzed using the censored methods. Justification for including contaminants with up to 50 % censoring is provided in Helsel [39].
Demographic variables which were considered as potential predictors of contaminant concentrations, including parity, maternal age group (<25, 25–29, 30–34, 35+), smoking status (current, former, never), household income in Canadian dollars (≤$50,000, $50,001–$100,000, >$100,000), pre-pregnancy body mass index (BMI) based on self-reported pre-pregnancy weight and measured height and categorized as Underweight to Normal (BMI < 25); Overweight (25 < = BMI < 30); and Obese (BMI > =30), place of birth (foreign-born, Canadian born), fasting status (yes, no), maternal education (high school or less, some college or college degree, undergraduate degree or higher), sample collection year (2008–2011), consumption of: any kind of fish (never, 1, or 2+ times per week), bacon (never, 1, or 2+ times per week), hamburger (never, 1, 2, or >2 times per week), pork (never, 1, or 2+ times per week), poultry (never, 1, 2, or >2 times per week) and steak (never, 1, or 2+ times per week), use of non-stick cooking vessels (only for PFASs) and infant gender for cord plasma. Hypothesis tests were performed for contaminants with at least 50 % of observations above LOD [39] using the likelihood ratio test for parametric ML estimation and the nonparametric Wilcoxon rank-sum test. Bonferroni-adjusted confidence intervals were calculated and used to identify the different groups when overall tests were significant. To aid model selection, a test for log-normality with left-censored observations developed by Nysen et. al. [40] was used. If the assumption of normality failed, then nonparametric testing results were presented. Lipid adjusted models included total lipids of each sample as a covariate in the linear model with the potential predictor of interest.
In addition to performing the analysis described above, we also considered evaluation of infant cord plasma based on three demographic variables: infant gender, maternal smoking status and season of cord plasma collection. The maximum likelihood estimation (MLE) method was employed to account for left–censored repeated measures (twins and triplets), using nonlinear mixed models, analogous to Jin et. al. [41] and Thiebaut and Jacqmin-Gadda [42] which employed the NLMIXED procedure in SAS. Hypothesis testing was performed using likelihood ratio tests that followed a chi-square distribution.
Furthermore, prediction intervals were computed for geometric mean contaminant concentrations by the three demographic variables of interest, using Empirical Bayes estimates of the random effects [43]. Interpretations of these geometric means are similar to those computed for the previous models.
Linear associations among all unadjusted chemicals with >70 % detection were examined using the correlation coefficient. Spearman’s rho (ρ) was calculated since the contaminant concentrations were not normally distributed. Observations below the LOD were imputed by LOD/2. A heat map was plotted to represent Spearman correlation coefficient matrix.
For the 48 participants who had PFAS measurements in both the 1st and 3rd trimester we calculated intra-class correlation coefficients (ICCs). ICCs were calculated using a one-way random effects model (Proc Mixed) to estimate the between- and within-subject variability across both time points. The ICC measures the ratio of between-subject variance to total variance. It ranges from 0 to 1, with 0 meaning no within person reproducibility and 1 meaning perfect reproducibility.
Placental transfer was described by the calculation of the concentration ratios between paired cord and maternal samples for each compound on unadjusted and lipid adjusted concentrations (excluding the PFASs) using the formula Rcm = Cuc / Cm where Cuc is the umbilical cord concentration and Cm is the maternal concentration. Ratio calculations are only presented for those chemicals that had ≥10 pairs above the LOD [9].
Statistical analysis was performed using software packages SAS (Statistical Analysis System) Enterprise Guide 4.2 and R (R Core Development Team). For the censoring methods, functions from the R packages NADA and SURVIVAL were used for analysis. Unless otherwise indicated, a 5 % significance level (α = 0.05) was implemented throughout.
Results
We found high detection rates in maternal blood for a number of chemicals but limited detection in cord blood. The PFASs were found to be highly reproducible in a small subset of samples that had PFASs measured in the 1st and 3rd trimester. Associations were found between and number of covariates, including parity, maternal age, income, and fish consumption in line with other studies. Foreign born participants appear to have higher levels of some chemicals. The maternal:cord plasma ratios are described and all fall below 1.
There were a total of 1983 pregnant women in the MIREC study [37]. The mean maternal age was 32.2 years and most of the women were in their 1st or 2nd pregnancy. The vast majority were Canadian born (81.3 %) and married (71.8 %) and close to 60 % had at least one university degree. Only 12 % were current smokers, while 27 % were former smokers. The majority were in the normal pre-pregnancy BMI ranges, however more than a third were overweight or obese. There were a total of 1959 live births in the study and 1517 cord plasma samples were collected. There were 1934 singletons, and 49 multiple births. The infants were 53 % male and 47 % female (See Table 1).
Table 1.
Study population
| Characteristic | Frequency | Percent |
|---|---|---|
| Maternal age group | ||
| <25 | 139 | 7.01 |
| 25–29 | 459 | 23.15 |
| 30–34 | 709 | 35.75 |
| 35+ | 676 | 34.09 |
| Smoking status | ||
| Current | 237 | 11.96 |
| Former | 542 | 27.36 |
| Never | 1202 | 60.68 |
| Country of birth | ||
| Foreign born | 371 | 18.71 |
| Canadian born | 1612 | 81.29 |
| Maternal education | ||
| High school or less | 175 | 8.83 |
| Some college or college degree | 572 | 28.87 |
| Undergraduate degree or higher | 1234 | 62.29 |
| Marital status | ||
| Married | 1424 | 71.81 |
| Other | 559 | 28.19 |
| Income | ||
| ≤$50,000 | 347 | 17.49 |
| $50,001–$100,000 | 786 | 39.64 |
| More than $100,000 | 757 | 38.17 |
| Parity | ||
| 0 | 874 | 44.12 |
| 1 | 800 | 40.38 |
| 2+ | 307 | 15.5 |
| Body mass index (BMI) | ||
| Underweight to normal (BMI <25) | 1164 | 63.36 |
| Overweight (25 ≤ BMI <30) | 404 | 21.99 |
| Obese (BMI >30) | 269 | 14.64 |
| Fasting status | ||
| No | 1914 | 98 |
| Yes | 39 | 2 |
| Season of sampling (1st trimester) | ||
| Fall | 575 | 29.41 |
| Spring | 448 | 22.92 |
| Summer | 464 | 23.73 |
| Winter | 468 | 23.94 |
| Infant gender | ||
| Male | 1034 | 52.51 |
| Female | 926 | 47.03 |
| Babies | ||
| Singletons | 1934 | 97.53 |
| Twins | 47 | 2.37 |
| Triplets | 2 | 0.10 |
Note: for income and infant gender, sum of percent is not 100, because there is a group (don’t know) was not included
Tables 2, 3, 4, 5, 6 and 7 report the overall summary statistics for each contaminant. In Table 2, the highest PFAS geometric mean (GM) in maternal plasma was PFOS (4.56 μg/L). PFOA, PFOS and PFHxS were detected in 23–64 % of the cord plasma. The GM of maternal PFOA was 4 times higher than that of cord plasma (1.65 vs 0.35 μg/L). There was a moderate and positive linear association among all the PFASs in maternal plasma (See Table 3). There was also a significant and positive correlation between maternal and cord plasma for PFOA.
Table 2.
Descriptive statistics for PFASs in maternal and cord blood plasma (wet weight—μg/L)
| Contaminant | Aliquot | N | LOD | % < LOD | Min | Median | 95th Percentile | Max | KM Median | 95 % CI | GM MLE | 95 % CI | ||
|---|---|---|---|---|---|---|---|---|---|---|---|---|---|---|
| PFHxS | Maternal | 1940 | 0.3 | 5.31 | ND | 1 | 4.3 | 40 | 1 | 0.96 | 1.05 | 1.03 | 0.99 | 1.07 |
| Cord | 1385 | 0.3 | 77.11 | ND | ND | 0.626 | 1.9 | NA | NA | NA | NA | NA | NA | |
| PFOA | Maternal | 1940 | 0.1 | 0.15 | ND | 1.7 | 4.1 | 16 | 1.7 | 1.65 | 1.75 | 1.65 | 1.60 | 1.69 |
| Cord | 1384 | 0.3 | 36.42 | ND | 0.39 | 1.1 | 5.6 | 0.39 | 0.37 | 0.41 | 0.35 | 0.33 | 0.36 | |
| PFOS | Maternal | 1940 | 0.3 | 0.15 | ND | 4.6 | 11 | 36 | 4.6 | 4.47 | 4.73 | 4.56 | 4.45 | 4.68 |
| Cord | 1385 | 0.3 | 52.27 | ND | ND | 1.5 | 5.8 | NA | NA | NA | NA | NA | NA | |
ND Non-detects (value below the limit of detection)
NA Non-applicable (KM median and GM MLE of contaminants with less than 50 % of observations detected were not calculated)
Table 3.
Correlations among PFOA, PFOS and PFHxS
| Maternal plasma (1st trimester) | Spearman correlation | Maternal (1st trimester): Cord Plasma | Spearman correlation |
|---|---|---|---|
| PFOA: PFOS | 0.56 | PFOA: PFOA | 0.67 |
| PFOA: PFHxS | 0.50 | ||
| PFOS: PFHxS | 0.53 |
Correlations between maternal and cord blood for PFOS and PFHxS not presented since more than 70 % of the observations were undetected
Table 4.
Comparison of 1st trimester and 3rd trimester PFAS concentrations
| % below LOD | 1st trimester GM | 3rd trimester GM | ICC | Spearman correlation | |
|---|---|---|---|---|---|
| PFOA | 0 | 1.71 | 1.06 | 0.64 (0.46, 0.78) | 0.90 |
| PFOS | 0 | 5.70 | 3.78 | 0.69 (0.53, 0.82) | 0.91 |
| PFHxS | 5 | 0.98 | 0.70 | 0.83 (0.73, 0.90) | 0.98 |
N = 48 paired samples measured in both the 1st and 3rd trimester of pregnancy
Table 5.
Descriptive statistics for MIREC PCBs concentrations in maternal and cord blood plasma (lipid-adjusted—μg/kg)
| Contaminanta | Aliquot | N | LOD | % < LOD | Min | Median | 95th Percentile | Max | KM Median | 95 % CI | GM | 95 % CI | ||
|---|---|---|---|---|---|---|---|---|---|---|---|---|---|---|
| Mono-ortho Dioxin-Like PCBs | ||||||||||||||
| PCB105 | Maternal | 1935 | 0.01 | 95.71 | ND | ND | ND | 13.62 | NA | NA | NA | NA | NA | NA |
| Cord | 1382 | 0.01 | 99.86 | ND | ND | ND | 100 | NA | NA | NA | NA | NA | NA | |
| PCB118 | Maternal | 1935 | 0.01 | 26.61 | ND | 2.33 | 6.78 | 37.93 | 2.30 | 2.22 | 2.37 | 2.36 | 2.29 | 2.43 |
| Cord | 1382 | 0.01 | 98.34 | ND | ND | ND | 100 | NA | NA | NA | NA | NA | NA | |
| PCB156 | Maternal | 1935 | 0.01 | 79.07 | ND | ND | 3.52 | 17.46 | NA | NA | NA | NA | NA | NA |
| Cord | 1380 | 0.01 | 99.71 | ND | ND | ND | 100.00 | NA | NA | NA | NA | NA | NA | |
| PCB167 | Maternal | 1935 | 0.01 | 98.40 | ND | ND | ND | 4.49 | NA | NA | NA | NA | NA | NA |
| Non-dioxin-like PCBs | ||||||||||||||
| PCB28 | Maternal | 1934 | 0.05 | 99.74 | ND | ND | ND | 260 | NA | NA | NA | NA | NA | NA |
| PCB66 | Maternal | 1934 | 0.03 | 99.28 | ND | ND | ND | 28 | NA | NA | NA | NA | NA | NA |
| PCB74 | Maternal | 1935 | 0.03 | 96.54 | ND | ND | ND | 18.4 | NA | NA | NA | NA | NA | NA |
| PCB99 | Maternal | 1934 | 0.03 | 97.16 | ND | ND | ND | 12.93 | NA | NA | NA | NA | NA | NA |
| PCB101 | Maternal | 1934 | 0.03 | 99.90 | ND | ND | ND | 12.07 | NA | NA | NA | NA | NA | NA |
| PCB128 | Maternal | 1935 | 0.01 | 99.79 | ND | ND | ND | 5 | NA | NA | NA | NA | NA | NA |
| PCB138 | Maternal | 1935 | 0.01 | 7.03 | ND | 4.07 | 14.77 | 71.67 | 4.07 | 3.91 | 4.23 | 4.21 | 4.08 | 4.35 |
| Cord | 1382 | 0.01 | 95.08 | ND | ND | ND | 100 | NA | NA | NA | NA | NA | NA | |
| PCB146 | Maternal | 1935 | 0.01 | 85.43 | ND | ND | 2.93 | 16 | NA | NA | NA | NA | NA | NA |
| Cord | 1382 | 0.01 | 99.86 | ND | ND | ND | 100 | NA | NA | NA | NA | NA | NA | |
| PCB153 | Maternal | 1935 | 0.01 | 1.29 | ND | 7 | 25.95 | 155 | 7 | 6.73 | 7.27 | 7.30 | 7.07 | 7.54 |
| Cord | 1382 | 0.01 | 84.01 | ND | ND | 45.26 | 101.45 | NA | NA | NA | NA | NA | NA | |
| PCB170 | Maternal | 1935 | 0.01 | 46.82 | ND | 2 | 7.22 | 71.67 | 1.69 | 1.62 | 1.76 | 1.67 | 1.59 | 1.75 |
| Cord | 1382 | 0.01 | 98.34 | ND | ND | ND | 100 | NA | NA | NA | NA | NA | NA | |
| PCB163 | Maternal | 1935 | 0.01 | 68.11 | ND | ND | 4.70 | 23.81 | NA | NA | NA | NA | NA | NA |
| Cord | 1382 | 0.01 | 99.20 | ND | ND | ND | 100 | NA | NA | NA | NA | NA | NA | |
| PCB178 | Maternal | 1935 | 0.01 | 95.71 | ND | ND | ND | 9.02 | NA | NA | NA | NA | NA | NA |
| PCB180 | Maternal | 1935 | 0.01 | 7.39 | ND | 4.72 | 19.70 | 183.33 | 4.72 | 4.53 | 4.91 | 4.88 | 4.70 | 5.06 |
| Cord | 1382 | 0.01 | 93.63 | ND | ND | 41.67 | 100 | NA | NA | NA | NA | NA | NA | |
| PCB183 | Maternal | 1935 | 0.01 | 91.21 | ND | ND | 2.50 | 23.33 | NA | NA | NA | NA | NA | NA |
| Cord | 1382 | 0.01 | 99.93 | ND | ND | ND | 100 | NA | NA | NA | NA | NA | NA | |
| PCB187 | Maternal | 1935 | 0.01 | 57.21 | ND | ND | 5.88 | 45 | NA | NA | NA | NA | NA | NA |
| Cord | 1382 | 0.01 | 99.57 | ND | ND | ND | 100 | NA | NA | NA | NA | NA | NA | |
| PCB194 | Maternal | 1928 | 0.01 | 81.17 | ND | ND | 3.39 | 30 | NA | NA | NA | NA | NA | NA |
| Cord | 1382 | 0.01 | 99.93 | ND | ND | ND | 100 | NA | NA | NA | NA | NA | NA | |
| PCB201 | Maternal | 1935 | 0.01 | 83.72 | ND | ND | 2.97 | 20 | NA | NA | NA | NA | NA | NA |
| PCB203 | Maternal | 1935 | 0.01 | 89.35 | ND | ND | 2.56 | 14.17 | NA | NA | NA | NA | NA | NA |
| PCB206 | Maternal | 1928 | 0.01 | 97.67 | ND | ND | ND | 6.61 | NA | NA | NA | NA | NA | NA |
ND Due to a high percentage of non-detects, descriptive statistics were not reported
NA Non-applicable (KM median and GM MLE of contaminants with less than 50 % of observations detected were not calculated)
a Contaminants PCB 52 was not detected in both maternal and cord blood samples. Contaminants PCB 101, PCB 128, PCB 167, PCB 178, PCB 201, PCB 203, PCB 206, PCB 28, PCB 66, PCB 74, PCB 99, were not detected in the cord blood
Table 6.
Descriptive statistics for MIREC Organochorine concentrations in maternal and cord blood plasma (lipid-adjusted—μg/kg)
| Contaminanta | Aliquot | N | LOD | % < LOD | Min | Median | 95th Percentile | Max | KM Median | 95 % CI | GM | 95 % CI | ||
|---|---|---|---|---|---|---|---|---|---|---|---|---|---|---|
| Beta-HCH | Maternal | 1898 | 0.01 | 31.88 | ND | 2.31 | 18.97 | 1108.11 | 2.24 | 2.15 | 2.32 | 2.32 | 2.19 | 2.46 |
| Cord | 1379 | 0.01 | 93.55 | ND | ND | 47.62 | 740.74 | NA | NA | NA | NA | NA | NA | |
| Cis-nonachlor | Maternal | 1934 | 0.005 | 88.31 | ND | ND | 1.25 | 3.91 | NA | NA | NA | NA | NA | NA |
| DDE | Maternal | 1935 | 0.09 | 1.03 | ND | 48.33 | 262.55 | 5306.12 | 48.33 | 46.68 | 49.99 | 56.02 | 54.02 | 58.08 |
| Cord | 1382 | 0.09 | 87.48 | ND | ND | 452.50 | 1827.96 | NA | NA | NA | NA | NA | NA | |
| DDT | Maternal | 1935 | 0.05 | 96.28 | ND | ND | ND | 175.44 | NA | NA | NA | NA | NA | NA |
| Cord | 1381 | 0.05 | 99.71 | ND | ND | ND | 500 | NA | NA | NA | NA | NA | NA | |
| HCB | Maternal | 1934 | 0.04 | 69.54 | ND | ND | 11.73 | 101.67 | NA | NA | NA | NA | NA | NA |
| Cord | 1380 | 0.04 | 99.86 | ND | ND | ND | 400 | NA | NA | NA | NA | NA | NA | |
| Mirex | Maternal | 1934 | 0.01 | 91.83 | ND | ND | 2.50 | 38.03 | NA | NA | NA | NA | NA | NA |
| Oxychlordane | Maternal | 1933 | 0.005 | 7.81 | ND | 2.09 | 4.60 | 17.5 | 2.09 | 2.02 | 2.15 | 2.01 | 1.96 | 2.06 |
| Cord | 1378 | 0.005 | 97.97 | ND | ND | ND | 50 | NA | NA | NA | NA | NA | NA | |
| Parlar26 | Maternal | 1934 | 0.005 | 97.47 | ND | ND | ND | 3.65 | NA | NA | NA | NA | NA | NA |
| Parlar50 | Maternal | 1934 | 0.005 | 87.28 | ND | ND | 1.22 | 5 | NA | NA | NA | NA | NA | NA |
| Transnonachlor | Maternal | 1934 | 0.01 | 15.87 | ND | 2.89 | 7.30 | 34.33 | 2.88 | 2.78 | 2.99 | 2.90 | 2.83 | 2.98 |
| Cord | 1381 | 0.01 | 98.99 | ND | ND | ND | 100 | NA | NA | NA | NA | NA | NA | |
ND Due to a high percentage of non-detects, descriptive statistics were not reported
NA Non-applicable (KM median and GM MLE of contaminants with less than 50 % of observations detected were not calculated)
a Aldrin, Alpha-chlordane, Gamma-Chlordane, and Gamma-HCH were not detected in both maternal and cord blood samples. Contaminants cis-nonachlor, Mirex, Parlar-26, and Parlar-50 were not detected in the cord blood
Table 7.
Descriptive statistics for MIREC PBB and PBDEs concentrations in maternal and cord blood plasma (lipid-adjusted—μg/kg)
| Contaminanta | Aliquot | N | LOD | % < LOD | Min | Median | 95th Percentile | Max | KM Median | 95 % CI | GM | 95 % CI | ||
|---|---|---|---|---|---|---|---|---|---|---|---|---|---|---|
| PBB153 | Maternal | 1928 | 0.02 | 99.48 | ND | ND | ND | 13.62 | NA | NA | NA | NA | NA | NA |
| PBDE100 | Maternal | 1927 | 0.02 | 78.46 | ND | ND | 10.16 | 327.27 | NA | NA | NA | NA | NA | NA |
| Cord | 1379 | 0.02 | 99.06 | ND | ND | ND | 200 | NA | NA | NA | NA | NA | NA | |
| PBDE153 | Maternal | 1928 | 0.02 | 55.60 | ND | ND | 36.36 | 527.27 | NA | NA | NA | NA | NA | NA |
| Cord | 1381 | 0.02 | 96.96 | ND | ND | ND | 221.05 | NA | NA | NA | NA | NA | NA | |
| PBDE28 | Maternal | 1928 | 0.03 | 99.07 | ND | ND | ND | 27.14 | NA | NA | NA | NA | NA | NA |
| PBDE33 | Maternal | 1927 | 0.03 | 99.90 | ND | ND | ND | 8.57 | NA | NA | NA | NA | NA | NA |
| PBDE47 | Maternal | 1928 | 0.03 | 34.28 | ND | 7.19 | 37.78 | 727.27 | 7.00 | 6.65 | 7.35 | 7.02 | 6.68 | 7.38 |
| Cord | 1379 | 0.03 | 94.63 | ND | ND | 125 | 411.76 | NA | NA | NA | NA | NA | NA | |
| PBDE99 | Maternal | 1927 | 0.02 | 80.85 | ND | ND | 8.36 | 169.09 | NA | NA | NA | NA | NA | NA |
| Cord | 1379 | 0.02 | 98.55 | ND | ND | ND | 1148.15 | NA | NA | NA | NA | NA | NA | |
ND Due to a high percentage of non-detects, descriptive statistics were not reported
NA Non-applicable (KM median and GM MLE of contaminants with less than 50 % of observations detected were not calculated)
a PBDE 15, PBDE 17, and PBDE 25 were not detected in both maternal and cord blood samples. PBB 153, PBDE 28, PBDE 33, were not detected in the cord blood
Table 4 describes the correlation between the paired 1st and 3rd trimester PFAS concentrations for a subset of women who had them measured at both time points. The 1st and 3rd trimester samples were highly correlated and had moderate to high reproducibility with ICCs ranging from 0.6 to 0.8. The 1st trimester samples were consistently higher than the 3rd trimester samples. The PCBs 118, 138, 153, and180 were the most highly detected PCBs (Table 5). DDE and oxychlordane were the most highly detected organochlorines (Table 6) while PBDE47 was the most highly detected flame retardant (See Table 7). Certain contaminants, namely aldrin, α-chlordane, γ-chlordane, γ-HCH, PBDE 15, PBDE 17, PBDE 25 and PCB 52 were not detected in either maternal or cord plasma samples. Cord plasma concentrations were very low or not detected for most of the PCBs and PBDEs.
In Table 8 we present the median cord:maternal plasma concentration ratios. The unadjusted median ratios (0.08–0.28) are much lower than the lipid adjusted (0.60–0.87).
Table 8.
Cord-maternal plasma median concentration ratios (Cm = Cuc / Cm)
| MIREC (plasma) | Vizcaino et al. 2014 [9] (serum) | Needham et al. 2011 [70] (serum) | ||||
|---|---|---|---|---|---|---|
| Chemical | No. of pairs | Median | Median lipid adjusted | Median | Median lipid adjusted | Median |
| Beta-HCH | 88 | 0.16 | 0.78 | 0.34 | 0.70 | |
| DDE | 168 | 0.15 | 0.74 | 0.34 | 0.68 | |
| Oxychlordane | 28 | 0.21 | 0.87 | |||
| PBDE100 | 12 | 0.08 | 0.60 | |||
| PBDE153 | 40 | 0.10 | 0.48 | 0.31 | 0.58 | 0.34a |
| PBDE47 | 67 | 0.15 | 0.84 | 0.58 | 0.90 | |
| PCB118 | 23 | 0.21 | 0.80 | 0.45 | 0.98 | |
| PCB138 | 67 | 0.16 | 0.70 | 0.39 | 0.81 | |
| PCB153 | 215 | 0.14 | 0.72 | 0.37 | 0.75 | |
| PCB163 | 11 | 0.23 | 0.80 | |||
| PCB170 | 23 | 0.14 | 0.71 | |||
| PCB180 | 86 | 0.13 | 0.67 | 0.28 | 0.57 | |
| Transnonachlor | 14 | 0.19 | 0.79 | |||
| PFHxS | 315 | 0.23 | 0.74 | |||
| PFOA | 865 | 0.28 | 0.72 | |||
| PFOS | 648 | 0.14 | 0.34 | |||
Note: only chemicals with >10 pairs shown (where both the maternal and cord blood concentrations were above the LOD)
amean
Note that these ratios are only presented for pairs of maternal and cord plasma samples that are both above the LOD. The highest number of pairs was for PFOA (n = 865) while the highest median ratios (lipid adjusted) were for oxychlordane and PBDE47.
The median number of POPs detected in maternal plasma above the LOD was 14 (mean 15) with a maximum of 33. In cord plasma, very few chemicals were detected with a mean and median of 2 chemicals per cord plasma sample and a maximum of 19 chemicals. Figure 1 describes the correlation across chemicals in maternal plasma for those chemicals with >70 % above the LOD. The organochorine pesticides and PCBs showed moderate to high correlation with each other but low correlation with the PFASs. The PFASs were moderately correlated with each other.
Fig. 1.
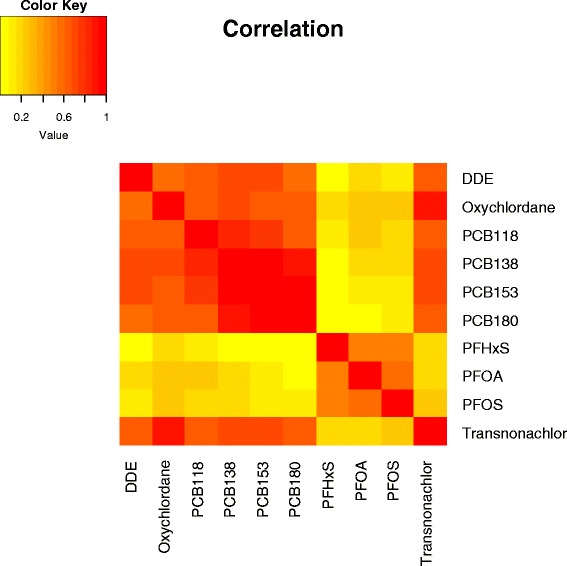
Correlation Heat Map (Maternal Plasma). All chemicals with >70 % detection
Demographic variables were explored for contaminants having at least 50 % of the observations above the LOD and included: β-HCH, DDE, oxychlordane, PBDE153, PBDE47, PCB118, PCB138, PCB153, PCB180, trans-nonachlor, PFHxS, PFOA, and PFOS. Sufficient detection permitted consideration of PCB 170 levels by parity and place of birth only (See Table 9 for summary and Additional file 1 for further details).
Table 9.
Hypothesis testing summary
| Beta-HCH | DDE | Oxychlordane | PBDE47 | PCB118 | PCB138 | PCB153 | PCB180 | Transnonachlor | PFHxS | PFOA | PFOS | |
|---|---|---|---|---|---|---|---|---|---|---|---|---|
| Increasing parity | - | - | - | NS | - | - | - | NS* | - | - | - | - |
| Increasing maternal age | NA | + | + | NS* | NA | + | + | + | NA | - | - | NS* |
| Current smokers | - | - | - | NS* | - | - | + | - | - | NS* | - | NS* |
| High household income > $100,000 CDN | + | NS* | + | NS* | + | + | + | + | + | NS* | + | + |
| High pre-pregnancy BMI | + | - | - | + | - | - | - | - | - | NS* | NS | NS |
| Foreign born | + | + | + | - | + | + | + | + | + | - | NS | - |
| Fasting at time of sample | NS | - | - | NS | NS | - | NS | NS | - | NS | NS | NS |
| Lower maternal education | - | - | - | NS* | - | - | - | - | - | NS | NS* | - |
| Sampling year (2011 vs 2008) | NA | - | - | - | - | - | - | - | - | NS | - | - |
| Fish consumption | + | + | + | NS* | + | + | + | + | + | NS | NS | NS |
| Bacon consumption | NA* | - | NS | NA* | NS* | NS | NS | NS | NS | NS | NS | NS |
| Hamburger consumption | - | - | NS* | NS | - | - | - | - | NS* | NS | NS | NS |
| Pork consumption | NS | NS | NS | NS | NS | NS | NS | NS | NS | NS | NS | NS |
| Poultry consumption | NS | NS | NS* | NS | NS* | NS | NS* | NS* | NS | NS | NS | NS |
| Steak consumption | NS | NS | NS | NS | NS | NS | NS | NS | NS | NS | NS | NS |
| Cook with non-stick cooking vessels | NS | + | NS |
NA = not sufficient detection (>70 % below LOD) in categories for analysis
NA* = significant interaction with chemical and lipids. See Additional file 1 for details
NS = No statistically significant differences between groups
NS* = overall a significant effect was seen for this characteristic (i.e. parity, maternal age, smoking status, income, BMI, education level) but the test could not identify with sufficient confidence which pairs of means differ. The Bonferroni-adjusted confidence intervals are a very conservative method
- means a significant negative association (e.g. as parity increases DDE concentrations decrease)
+ means a significant positive association (e.g. as maternal age increases DDE concentrations increase)
Significant differences in contaminant concentrations were found by parity group for all contaminants considered except PBDE 47, with and without lipid adjustment. Generally, as the parity increases, the contaminant concentrations tended to decrease. We saw that contaminant levels were significantly higher in the older participants for the contaminants DDE, oxychlordane, PCB 138, PCB 153, and PCB180. However for two of the PFASs, the age group 35+ had significantly lower concentrations of PFHxS and PFOA than the younger age groups.
There were significant differences by smoking status for all contaminants considered with and without lipid adjustment except for PFOS. In general, non-smokers and former smokers had higher contaminant concentrations compared to current smokers. Only PBDE153 had higher concentrations in current smokers than non-smokers.
For household income we saw significant differences with and without lipid adjustment. Generally, as household income increased, the contaminant concentrations tended to increase in many cases, hence mothers with a household income of more than $100,000 CDN had significantly higher contaminant residue levels.
The majority of the lipid adjusted contaminants had significantly higher concentrations in underweight/normal weight mothers compared to obese mothers. However, there was an exception for β-HCH and PBDE-47, where significantly higher concentrations were seen for obese women in most cases.
Contaminant concentrations were significantly higher (unadjusted and lipid adjusted) in foreign-born mothers compared to Canadian-born mothers for all contaminants except PBDE 47 and the PFASs (PFHxS and PFOS), where higher concentrations were seen in Canadian-born mothers.
Fasting status demonstrated significant differences for DDE, oxychlordane, PCB 138 and trans-nonachlor with and without lipid adjustment. Contaminant residue levels were higher among those mothers who did not fast. For the other chemicals, no significant difference at the 5 % significance level was found with lipid adjustment.
There were significant differences by education level for nearly all contaminants. Generally, mothers with higher education had higher contaminant concentrations. Sampling year showed a significant effect for nearly all POPs. Further to this, women who participated in the study in 2011 had significantly lower concentrations of nearly all POPs compared to women who participated in 2008.
Fish consumers had significantly higher levels of nearly all POPs excluding the PFASs. Bacon, pork, poultry and steak consumption showed little effect on contaminant concentrations however participants who ate hamburger 2 or more times per week showed significantly lower levels of the OC pesticides β-HCH, DDE, and the PCBs (PCBs 118, 138, 153, 180). Only PFOA levels were higher for participants who cooked with non-stick cooking vessels. However no association was observed if they microwaved with non-stick cooking vessels.
No significant differences were detected when grouping by infant gender, maternal smoking status or season of collection for PFOA in cord plasma (See Additional file 1).
Discussion
In maternal plasma, there was >90 % detection for DDE, oxychlordane, PCB 138, PCB 153, and the PFASs. Cord plasma had much lower detection rates with low or very limited detection for most PCBs and PBDEs. The highest detection rate in cord plasma was for the PFASs at 23 (PFHxS), 48 (PFOS) and 64 (PFOS) percent. In a small subsample we found maternal plasma PFASs concentrations to be highly correlated and to have good reproducibility between the 1st and 3rd trimester (ICCs 064-0.83). The cord:maternal plasma concentration ratios ranged from 0.14 (PFOS) to 0.87 (oxychlordane, lipid adjusted). Similar to other studies, we found parity, maternal age, income, education, smoking status, pre-pregnancy BMI and fish consumption to be significant predictors for most chemicals. Those participants who were foreign-born had significantly higher concentrations of organochlorinated pesticides and PCBs.
In comparison to other national surveys, the participants of the MIREC cohort had lower geometric mean concentrations of DDE. MIREC’s DDE concentrations were lower than those measured in females from the population-based Canadian Health Measures Survey (CHMS) [2] as well as females [4] and pregnant women [44] from the U.S. National Health And Nutrition Examination Survey (NHANES) study. Maternal trans-nonachlor and oxychlordane concentrations appear to be similar in MIREC to those found in the CHMS [2] and another Canadian study [45], and lower than that found in NHANES. The predominant PCB congeners were 138, 153, and 180 in the MIREC maternal plasma samples. This is consistent with other biomonitoring surveys in Canada [46]. Among the dioxin-like PCBs measured in MIREC, only PCB 118 was consistently detected in maternal plasma. PCB 118 concentrations were similar to those found in the CHMS [2] however, lower than other similar studies [4, 34, 45, 47, 72]. In cord plasma PCBs were rarely detected.
In the MIREC study cord plasma, the PFASs were detected more frequently than any other POPs. PFOA and PFOS had detection rates of 64 and 48 %, which is in contrast to the OC pesticides and PCBs that had only a 7–15 % detection rate. The 1st and 3rd trimester PFASs were found to be strongly correlated and moderately to strongly reproducible, with 1st trimester levels consistently higher, and ICCs ranging from 0.64 (PFOA) to 0.83 (PFHxS). Fei et al. [48] also found a high degree of correlation between 1st and 2nd trimester concentration of PFOA (r = 0.88) and PFOS (r = 0.87), with mean levels being higher in the 1st trimester. The MIREC maternal PFASs concentrations were similar to those found in females aged 20–39 in the population based study CHMS and another Canadian pregnancy cohort study based in Vancouver (CHiRP) [49] both conducted around the same time as MIREC. The MIREC PFOA and PFOS maternal concentrations are lower than those observed in earlier studies from the U.S. [3, 44], Norway [50], Denmark [51] and the Family study [52] from Hamilton, Ontario Canada. Cord plasma PFOA was significantly correlated with maternal plasma concentrations (p < 0.0001), as seen in other studies [8]. The MIREC PFOA cord plasma concentrations are also lower than those seen in other Canadian, and international studies, but similar to those reported in the Norwegian Birth Cohort (MoBa) [53].
PBDE 47 was the most frequently detected PBDE in the MIREC study. However, the MIREC PBDE 47 concentrations are notably lower than those found in earlier studies of pregnant women [44] and females [4] from the U.S. NHANES study and the Family study from Hamilton, Ontario [54]. Concentrations are similar to that found in the CHMS [2], conducted at the same time as MIREC, and the Canadian centres of an earlier Trinational study [45].
Parity, maternal age, income, education, smoking status, pre-pregnancy BMI, year of collection and fish consumption were found to be significant predictors for most chemicals. Foreign Born participants had higher levels of PCBs and organochlorinated pesticides.
Generally, as parity increases contaminant concentrations tended to decrease. The organochlorinated concentrations were significantly higher in older age groups, except the PFASs where both PFHxS and PFOA had lower concentrations in older mothers. Fei et al. [48, 51] also found declining PFASs concentrations with increasing age. In MIREC, obese participants had lower concentrations of DDE, oxychlordane, and the PCBs, and higher concentrations of β-HCH, and PBDE 47 compared to other lower weight categories. Other studies have shown lower PCB concentrations with increasing BMI [55] or no association with BMI [56].
Most contaminants were found to be higher in non-smokers and former smokers than current smokers, except for PFOS. This is in contrast to the findings in other studies which have shown a positive association with smoking and POP concentrations [57–61] or show no difference by smoking status for DDE [55], PCBs [55], and PFASs [50]. Our finding may be due to unmeasured confounders given we looked at the characteristics univariately. However results from Ayotte et al. [62] suggested that smoking induces liver CYP1A2 activity, which alters porphyrin metabolism and increases the biotransformation of mono-ortho PCBs.
OCs are highly lipophilic and partition among various tissues depending on their lipid content. Phillips et al. [63] showed increases of 20 % in PCB, HCB and DDE concentrations in 20 adults following a meal. However, they found no difference when concentrations were lipid adjusted. In the MIREC study, the few participants who fasted (n = 39) had significantly lower OC concentrations (DDE, oxychlordane, PCB 138 and trans-nonachlor) with and without lipid adjustment, suggesting that lipid adjustment alone may be insufficient to account for postprandial changes in these contaminant concentrations in pregnant women and other confounding measures must be considered.
Foreign-born participants had significantly higher concentrations of organochlorinated pesticides and PCBs. Foreign born participants were mainly from Europe (35 %) and Asia (19 %), followed by the Caribbean, South America and the U.S (all 9 %), Africa (8 %), Middle East (7 %) and Oceania (1 %). A Trinational Biomonitoring study [45] also showed consistently higher concentrations in Canadian immigrants than in Canadian born participants. Curren et al. [64] found that foreign-born Canadians had higher concentrations of DDE and β-HCH compared to Canadian-born and Inuit mothers. These exposures may originate from imported foods or exposures that occurred outside of Canada [65] or it may be due to different cultural habits and lifestyles related to their country of origin.
Both fish and hamburger consumption showed significant effects on contaminant concentrations albeit in different directions. Fish consumers had significantly higher levels of most POPs (excluding the PFASs). Fish consumption is known to affect the levels of POPs [66–68]. Hamburger consumption had a significant negative effect on POP levels. This finding is not supported in the literature as several studies have reported POPs in meat [69] and may reflect the fact that these participants are less likely to eat fish, where we saw a strong association with POPs. Among the women who reported eating hamburger 2 or more times per week, 60 % reported never eating fish.
We found that the year of the sample collection had a significant effect on POP concentrations. Lower levels were seen in 2011 compared to 2008 for nearly all POPs except PFHxS. This could reflect the fact that POP levels are decreasing over time as a result of bans. It may also reflect a difference in recruitment methods over time (e.g. older moms) and should be noted as an important consideration in cohort studies collecting data over a number of years.
The lipid adjusted cord:maternal serum concentration ratios for the OC pesticides, PBDEs and PCBs are all less than 1 and similar to a recent study from Spain [9] which analyzed samples from 308 mother-cord plasma pairs between 2004-08 (See Table 8). For the PFASs, PFOA had the highest median ratio (0.28) but is much lower than in a study of 15 women from a Faroe Islands fishing community where elevated exposures to marine contaminants occur [70]. It has been suggested that pollutant properties may affect the transport of pollutants from the mother to the fetus however Vizcaino et al. [9] did not show any correlation with pollutant properties such as molecular weight, molar volume, number of halogen substituents or log octanol water partition coefficient (Kow) and concentration ratios. Further exploration into the predictors of the maternal:fetal concentration ratio is warranted.
An examination of the chemicals measured in the serum of the pregnant women shows that most women had multiple PCBs, PBDEs and PFASs detected in their plasma. This result is supported by the work by Woodruff et al. [44] who showed that each pregnant woman in the NHANES study had at least 2 OC pesticides, one PBDE, two PFASs and four phthalates. Traditionally research has focused on single chemicals in the exposure assessment; however, there is growing recognition of the need to better assess the risk of mixtures and to understand the cumulative effects of multiple exposures and stressors [71].
One limitation and possible reason for lower concentrations in pregnant women compared to non-pregnant females in the CHMS is that we did not adjust for albumin. Albumin measurements can be used as a surrogate for plasma volume expansion in pregnancy. This plasma volume expansion may dilute environmental chemical concentrations in the plasma [44, 72]. Woodruff et al. [44] found that adjusting for albumin generally increased the GM estimates of persistent compounds (e.g. DDE) but not for non-persistent compounds. However, they suggest that the role of albumin as a transport protein during pregnancy requires further investigation. MIREC was also based on a convenience sample and is therefore not population-based and representative. Our results may also be biased towards women with higher age at delivery, education and income [37].
Conclusions
Multiple chemicals were detectable in the serum of the pregnant women in our study cohort, however the concentrations were much lower than those seen in other studies. We found parity, maternal age, income, education, smoking status, pre-pregnancy BMI, fish consumption and year of collection to be significant predictors for most chemicals. Foreign-born participants had significantly higher concentrations of OCs and PCBs. In maternal plasma the highest detection rates were seen for the PFOS, PFOA, DDE, and PCB153. However in cord plasma, PFOA had the highest detection rate. In a small subset of participants we found the PFASs maternal plasma concentrations to be highly correlated and to have moderate to high reproducibility between the 1st and 3rd trimester.
Acknowledgements
We would like to sincerely thank the participants of the MIREC study for their contributions to the study. We greatly value the hard work and dedication of the Study Coordinating Centre, Site Staff and the MIREC Study Group. This study was funded by Health Canada’s Chemicals Management Plan, the Ontario Ministry of the Environment and the Canadian Institute for Health Research (MOP-81285).
Abbreviations
- BMI
body mass index
- CHMS
Canadian Health Measures Survey
- CTQ
Centre de Toxicologie du Québec
- DDE
dichlorodiphenyldichloroethylene
- DDT
p,p’-Dichlorodiphenyltrichloroethane
- HCB
hexachlorobenzene
- INSPQ
Institute National de Santé Publique
- KM
Kaplan-Meier
- LOD
limit of detection
- MIREC
maternal-infant research on environmental chemicals
- ML
maximum likelihood
- MLE
maximum likelihood estimation
- OCs
organochlorines
- PBDEs
polybrominated diphenyl ethers
- PCB
polychlorinated biphenyls
- PFASs
perfluoroalkyl substances
- PFASs
perfluoroalkyl substances
- PFHxS
perfluorohexane sulfonate
- PFOA
perfluorooctanoic acid
- PFOS
perfluoroctane sulfonate
- POPs
persistent organic pollutants
- Tox 26
toxaphene parlar 26
- Tox50
toxaphene parlar 50
- β-HCH
β-Hexachlorocylcohexane
- γ-HCH
γ-Hexachlorocylcohexane
Additional file
Results of Statistical Hypothesis Testing—MIREC Persistent Organic Pollutants Analysis-Using censoring methods. Table S1 Results for MIREC persistent organic pollutants in maternal blood by Parity (μg/L). Table S2 Results for MIREC persistent organic pollutants in maternal blood by maternal age (μg/L). Table S3 Results for MIREC persistent organic pollutants in maternal blood by smoking status (μg/L). Table S4 Results for MIREC persistent organic pollutants in maternal blood by household income (μg/L). Table S5 Results for MIREC persistent organic pollutants in maternal blood by pre-BMI (μg/L). Table S6 Results for MIREC persistent organic pollutants in maternal blood by place of birth (μg/L). Table S7 Results for MIREC persistent organic pollutants in maternal blood by fasting (μg/L). Table S8 Results for MIREC persistent organic pollutants in maternal blood by maternal education (μg/L). Table S9 Results for MIREC persistent organic pollutants in maternal blood by whether using non-stick cooking vessels. Table S10 Results for MIREC persistent organic pollutants in maternal blood by whether using non-stick cooking vessels in the microwave. Table S11 Results for MIREC persistent organic pollutants in maternal blood by year of collection. Table S12 Results for MIREC persistent organic pollutants in maternal blood by intake of bacon. Table S13 Results for MIREC persistent organic pollutants in maternal blood by intake of fish. Table S14 Results for MIREC persistent organic pollutants in maternal blood by intake of Hamburger. Table S15 Results for MIREC persistent organic pollutants in maternal blood by intake of pork. Table S16 Results for MIREC persistent organic pollutants in maternal blood by intake of poultry. Table S17 Results for MIREC persistent organic pollutants in maternal blood by intake of steak. Table S18 Comparison of demographic groups when the INTERACTION between BMI and total lipid was significant. Table S19 Comparison of demographic groups when the INTERACTION was significant between year of collection and total lipid. Table S20 Comparison of demographic groups when the INTERACTION was significant between intake of bacon and total lipid. Table S21 Results for MIREC persistent organic pollutants in cord blood by infant gender (μg/L). Table S22 Results for MIREC persistent organic pollutants in cord blood by season of collection (μg/L). Table S23 Results for MIREC persistent organic pollutants in cord blood by smoking status of mother (µg/L). (DOCX 207 kb)
Footnotes
Competing interests
The authors declare no competing interests.
Authors’ contributions
MF: was involved in the design, implementation and analysis of the study. She is also the lead author on the article. TEA: is the co-principal investigator of the MIREC Study and contributed to the interpretation of the results of this article. DH: was involved in the initial design, selection of environmental chemicals, and policy for the MIREC study. He also contributed to the results of this article. CLL: performed the statistical analysis. KD: provided advice and input on the statistical analysis. AL: was involved in the chemical analysis writing of methods. EG: was involved in the chemical analysis and writing of methods. WGF: was a site investigator for MIREC and contributed to the results of this paper. WDF: is the co-principal investigator of MIREC and contributed to the interpretation of the results of this paper. All authors read and approved the final manuscript.
Authors’ information
Mandy Fisher is a nurse epidemiologist at Health Canada. She has worked on the MIREC study since 2008.
References
- 1.The Secretariat of the Stockholm Convention. Stockholm Convention on Persistent Organic Pollutants (POPs) as amended in 2009. http://chm.pops.int/Convention/ThePOPs/ListingofPOPs/tabid/2509/Default.aspx Accessed 21 Feb 2016.
- 2.Health Canada . Report on Human Biomonitoring of Environmental Chemicals in Canada: Results of the Canadian Health Measures Survey Cycle 1 (2007-2009) Ottawa: Health Canada; 2010. [Google Scholar]
- 3.CDC. Fourth National Report on Human Exposure to Environmental Chemicals. Atlanta, GA: Department of Health, Centers for Disease Control and Prevention, 2009. http://www.cdc.gov/exposurereport/. Accessed 12 Apr 2016.
- 4.CDC . Fourth National Report on Human Exposure to Environmental Chemicals: Updated Tables, August 2014. Atlanta: U.S. Department of Health and Human Services; 2014. [Google Scholar]
- 5.Sundstrom M, Ehresman DJ, Bignert A, et al. A temporal trend study (1972-2008) of perfluorooctanesulfonate, perfluorohexanesulfonate, and perfluorooctanoate in pooled human milk samples from Stockholm, Sweden. Environ Int. 2011;37(1):178–183. doi: 10.1016/j.envint.2010.08.014. [DOI] [PubMed] [Google Scholar]
- 6.Ryan JJ, Rawn DF. The brominated flame retardants, PBDEs and HBCD, in Canadian human milk samples collected from 1992 to 2005; concentrations and trends. Environ Int. 2014;70:1–8. doi: 10.1016/j.envint.2014.04.020. [DOI] [PubMed] [Google Scholar]
- 7.Ode A, Rylander L, Lindh CH, et al. Determinants of maternal and fetal exposure and temporal trends of perfluorinated compounds. Environ Sci Pollut Res Int. 2013;20(11):7970–7978. doi: 10.1007/s11356-013-1573-5. [DOI] [PubMed] [Google Scholar]
- 8.Porpora MG, Lucchini R, Abballe A, et al. Placental transfer of persistent organic pollutants: a preliminary study on mother-newborn pairs. Int J Environ Res Public Health. 2013;10(2):699–711. doi: 10.3390/ijerph10020699. [DOI] [PMC free article] [PubMed] [Google Scholar]
- 9.Vizcaino E, Grimalt JO, Fernandez-Somoano A, Tardon A. Transport of persistent organic pollutants across the human placenta. Environ Int. 2014;65:107–115. doi: 10.1016/j.envint.2014.01.004. [DOI] [PubMed] [Google Scholar]
- 10.Lau C, Anitole K, Hodes C, Lai D, Pfahles-Hutchens A, Seed J. Perfluoroalkyl acids: a review of monitoring and toxicological findings. Toxicol Sci. 2007;99(2):366–394. doi: 10.1093/toxsci/kfm128. [DOI] [PubMed] [Google Scholar]
- 11.ATSDR. Draft Toxicolgoical Profile: Perfluoroalkyls (Chapter 5: Production, Import/Export, Use and Disposal). U.S. Department of Health and Human Services, 2009. http://www.atsdr.cdc.gov/toxprofiles/tp.asp?id=1117&tid=237. Accessed 12 Apr, 2016.
- 12.EPA. PFOA Stewardship Program. https://www.epa.gov/assessing-and-managing-chemicals-under-tsca/20102015-pfoa-stewardship-program. Accessed 12 Apr 2016.
- 13.Clarke DB, Bailey VA, Routledge A, et al. Dietary intake estimate for perfluorooctanesulphonic acid (PFOS) and other perfluorocompounds (PFCs) in UK retail foods following determination using standard addition LC-MS/MS. Food Addit Contam Part A Chem Anal Control Expo Risk Assess. 2010;27(4):530–545. doi: 10.1080/19440040903476590. [DOI] [PubMed] [Google Scholar]
- 14.D'Hollander W, Herzke D, Huber S, et al. Occurrence of perfluorinated alkylated substances in cereals, salt, sweets and fruit items collected in four European countries. Chemosphere. 2015;129:179–185. doi: 10.1016/j.chemosphere.2014.10.011. [DOI] [PubMed] [Google Scholar]
- 15.Voorspoels S, Covaci A, Jaspers VL, Neels H, Schepens P. Biomagnification of PBDEs in three small terrestrial food chains. Environ Sci Technol. 2007;41(2):411–416. doi: 10.1021/es061408k. [DOI] [PubMed] [Google Scholar]
- 16.Rawn DF, Sadler A, Quade SC, et al. Brominated flame retardants in Canadian chicken egg yolks. Food Addit Contam Part A Chem Anal Control Expo Risk Assess. 2011;28(6):807–815. doi: 10.1080/19440049.2010.545443. [DOI] [PMC free article] [PubMed] [Google Scholar]
- 17.Voorspoels S, Covaci A, Neels H, Schepens P. Dietary PBDE intake: a market-basket study in Belgium. Environ Int. 2007;33(1):93–97. doi: 10.1016/j.envint.2006.08.003. [DOI] [PubMed] [Google Scholar]
- 18.Fromme H, Korner W, Shahin N, et al. Human exposure to polybrominated diphenyl ethers (PBDE), as evidenced by data from a duplicate diet study, indoor air, house dust, and biomonitoring in Germany. Environ Int. 2009;35(8):1125–1135. doi: 10.1016/j.envint.2009.07.003. [DOI] [PubMed] [Google Scholar]
- 19.Meeker JD, Johnson PI, Camann D, Hauser R. Polybrominated diphenyl ether (PBDE) concentrations in house dust are related to hormone levels in men. Sci Total Environ. 2009;407(10):3425–3429. doi: 10.1016/j.scitotenv.2009.01.030. [DOI] [PMC free article] [PubMed] [Google Scholar]
- 20.Wilford BH, Shoeib M, Harner T, Zhu J, Jones KC. Polybrominated diphenyl ethers in indoor dust in Ottawa, Canada: implications for sources and exposure. Environ Sci Technol. 2005;39(18):7027–7035. doi: 10.1021/es050759g. [DOI] [PubMed] [Google Scholar]
- 21.Government of Canada. Polybrominated Diphenyl Ethers (PBDEs). http://www.chemicalsubstanceschimiques.gc.ca/fact-fait/glance-bref/pbde-eng.php. Accessed 3 Feb 2015.
- 22.UNEP . Guidance on Alternative Flame Retardants to the Use of Commercial Pentabromodiphenyether. Oslo, Norway: United National Environment Program; 2009. [Google Scholar]
- 23.Gilbert ME, Rovet J, Chen Z, Koibuchi N. Developmental thyroid hormone disruption: prevalence, environmental contaminants and neurodevelopmental consequences. Neurotoxicology. 2012;33(4):842–852. doi: 10.1016/j.neuro.2011.11.005. [DOI] [PubMed] [Google Scholar]
- 24.Fox DA, Grandjean P, de Groot D, Paule MG. Developmental origins of adult diseases and neurotoxicity: epidemiological and experimental studies. Neurotoxicology. 2012;33(4):810–816. doi: 10.1016/j.neuro.2011.12.016. [DOI] [PMC free article] [PubMed] [Google Scholar]
- 25.Hansen S, Nieboer E, Odland JO, Wilsgaard T, Veyhe AS, Sandanger TM. Levels of organochlorines and lipids across pregnancy, delivery and postpartum periods in women from Northern Norway. J Environ Monit. 2010;12(11):2128–2137. doi: 10.1039/c0em00346h. [DOI] [PubMed] [Google Scholar]
- 26.Hansen S, Nieboer E, Sandanger TM, et al. Changes in maternal blood concentrations of selected essential and toxic elements during and after pregnancy. J Environ Monit. 2011;13(8):2143–2152. doi: 10.1039/c1em10051c. [DOI] [PubMed] [Google Scholar]
- 27.Chevrier J, Harley KG, Bradman A, Gharbi M, Sjodin A, Eskenazi B. Polybrominated diphenyl ether (PBDE) flame retardants and thyroid hormone during pregnancy. Environ Health Perspect. 2010;118(10):1444–1449. doi: 10.1289/ehp.1001905. [DOI] [PMC free article] [PubMed] [Google Scholar]
- 28.Meeker JD. Exposure to environmental endocrine disruptors and child development. Arch Pediatr Adolesc Med. 2012;166(10):952–958. doi: 10.1001/archpediatrics.2012.241. [DOI] [PubMed] [Google Scholar]
- 29.Crofton KM, Craft ES, Hedge JM, et al. Thyroid-hormone-disrupting chemicals: evidence for dose-dependent additivity or synergism. Environ Health Perspect. 2005;113(11):1549–1554. doi: 10.1289/ehp.8195. [DOI] [PMC free article] [PubMed] [Google Scholar]
- 30.Casas M, Nieuwenhuijsen M, Martinez D, et al. Prenatal exposure to PCB-153, p, p'-DDE and birth outcomes in 9000 mother-child pairs: exposure-response relationship and effect modifiers. Environ Int. 2015;74:23–31. doi: 10.1016/j.envint.2014.09.013. [DOI] [PubMed] [Google Scholar]
- 31.Govarts E, Nieuwenhuijsen M, Schoeters G, et al. Birth weight and prenatal exposure to polychlorinated biphenyls (PCBs) and dichlorodiphenyldichloroethylene (DDE): a meta-analysis within 12 European Birth Cohorts. Environ Health Perspect. 2012;120(2):162–170. doi: 10.1289/ehp.1103767. [DOI] [PMC free article] [PubMed] [Google Scholar]
- 32.Ferguson KK, O'Neill MS, Meeker JD. Environmental contaminant exposures and preterm birth: a comprehensive review. J Toxicol Environ Health B Crit Rev. 2013;16(2):69–113. doi: 10.1080/10937404.2013.775048. [DOI] [PMC free article] [PubMed] [Google Scholar]
- 33.Gascon M, Sunyer J, Casas M, et al. Prenatal exposure to DDE and PCB 153 and respiratory health in early childhood: a meta-analysis. Epidemiology. 2014;25(4):544–553. doi: 10.1097/EDE.0000000000000097. [DOI] [PubMed] [Google Scholar]
- 34.Inadera H. Developmental origins of obesity and type 2 diabetes: molecular aspects and role of chemicals. Environ Health Prev Med. 2013;18(3):185–197. doi: 10.1007/s12199-013-0328-8. [DOI] [PMC free article] [PubMed] [Google Scholar]
- 35.Grandjean P, Landrigan PJ. Neurobehavioural effects of developmental toxicity. Lancet Neurol. 2014;13(3):330–338. doi: 10.1016/S1474-4422(13)70278-3. [DOI] [PMC free article] [PubMed] [Google Scholar]
- 36.Mone SM, Gillman MW, Miller TL, Herman EH, Lipshultz SE. Effects of environmental exposures on the cardiovascular system: prenatal period through adolescence. Pediatrics. 2004;113(4 Suppl):1058–1069. [PubMed] [Google Scholar]
- 37.Arbuckle TE, Fraser WD, Fisher M, et al. Cohort profile: the maternal-infant research on environmental chemicals research platform. Paediatr Perinat Epidemiol. 2013;27(4):415–425. doi: 10.1111/ppe.12061. [DOI] [PubMed] [Google Scholar]
- 38.Patterson DG, Jr, Isaacs SG, Alexander LR, Turner WE, Hampton L, Bernert JT, Needham LL. Method 6: Determination of specific polychlorinated dibenzo-p-dioxins and dibenzofurans in blood and adipose tissue by isotope dilution high resolution mass spectrometry. IARC Sci Publ. 1991;108:229–342. [PubMed] [Google Scholar]
- 39.Helsel DR. Statistics for Censored Environmental Data Using Minitab and R. 2. Hoboken: Wiley; 2012. [Google Scholar]
- 40.Nysen R, Aerts M, Faes C. Testing goodness of fit of parametric models for censored data. Stat Med. 2012;31(21):2374–2385. doi: 10.1002/sim.5368. [DOI] [PubMed] [Google Scholar]
- 41.Jin Y, Hein MJ, Deddens JA, Hines CJ. Analysis of Lognormally Distributed Exposure Data with Repeated Measures and Values below the limit of Detection Using SAS. Ann Occup Hyg. 2011;55(1):97–112. doi: 10.1093/annhyg/meq061. [DOI] [PubMed] [Google Scholar]
- 42.Thiebaut R, Jacqmin-Gadda H. Mixed models for longitudinal left-censored repeated measures. Comput Methods Programs Biomed. 2004;74(3):255–260. doi: 10.1016/j.cmpb.2003.08.004. [DOI] [PubMed] [Google Scholar]
- 43.McCulloch CE, Searle SR, Neuhaus JM. Generalized, Linear, and Mixed Models. 2. Hoboken: John Wiley; 2008. [Google Scholar]
- 44.Woodruff TJ, Zota AR, Schwartz JM. Environmental chemicals in pregnant women in the United States: NHANES 2003-2004. Environ Health Perspect. 2011;119(6):878–885. doi: 10.1289/ehp.1002727. [DOI] [PMC free article] [PubMed] [Google Scholar]
- 45.Foster WG, Cheung AP, Davis K, et al. Circulating metals and persistent organic pollutant concentrations in Canadian and non-Canadian born primiparous women from five Canadian centres: results of a pilot biomonitoring study. Sci Total Environ. 2012;435–436:326–336. doi: 10.1016/j.scitotenv.2012.06.070. [DOI] [PubMed] [Google Scholar]
- 46.Rawn DF, Ryan JJ, Sadler AR, et al. PCDD/F and PCB concentrations in sera from the Canadian Health Measures Survey (CHMS) from 2007 to 2009. Environ Int. 2012;47:48–55. doi: 10.1016/j.envint.2012.05.008. [DOI] [PubMed] [Google Scholar]
- 47.Ibarluzea J, Alvarez-Pedrerol M, Guxens M, et al. Sociodemographic, reproductive and dietary predictors of organochlorine compounds levels in pregnant women in Spain. Chemosphere. 2011;82(1):114–120. doi: 10.1016/j.chemosphere.2010.09.051. [DOI] [PubMed] [Google Scholar]
- 48.Fei C, McLaughlin JK, Tarone RE, Olsen J. Perfluorinated chemicals and fetal growth: a study within the Danish National Birth Cohort. Environ Health Perspect. 2007;115(11):1677–1682. doi: 10.1289/ehp.10506. [DOI] [PMC free article] [PubMed] [Google Scholar]
- 49.Webster GM, Venners SA, Mattman A, Martin JW. Associations between perfluoroalkyl acids (PFASs) and maternal thyroid hormones in early pregnancy: a population-based cohort study. Environ Res. 2014;133:338–347. doi: 10.1016/j.envres.2014.06.012. [DOI] [PubMed] [Google Scholar]
- 50.Wang Y, Starling AP, Haug LS, et al. Association between perfluoroalkyl substances and thyroid stimulating hormone among pregnant women: a cross-sectional study. Environ Health. 2013;12(1):76. doi: 10.1186/1476-069X-12-76. [DOI] [PMC free article] [PubMed] [Google Scholar]
- 51.Fei C, McLaughlin JK, Lipworth L, Olsen J. Maternal levels of perfluorinated chemicals and subfecundity. Hum Reprod. 2009;24(5):1200–1205. doi: 10.1093/humrep/den490. [DOI] [PubMed] [Google Scholar]
- 52.Monroy R, Morrison K, Teo K, et al. Serum levels of perfluoroalkyl compounds in human maternal and umbilical cord blood samples. Environ Res. 2008;108(1):56–62. doi: 10.1016/j.envres.2008.06.001. [DOI] [PubMed] [Google Scholar]
- 53.Gutzkow KB, Haug LS, Thomsen C, Sabaredzovic A, Becher G, Brunborg G. Placental transfer of perfluorinated compounds is selective--a Norwegian Mother and Child sub-cohort study. Int J Hyg Environ Health. 2012;215(2):216–219. doi: 10.1016/j.ijheh.2011.08.011. [DOI] [PubMed] [Google Scholar]
- 54.Foster WG, Gregorovich S, Morrison KM, et al. Human maternal and umbilical cord blood concentrations of polybrominated diphenyl ethers. Chemosphere. 2011;84(10):1301–1309. doi: 10.1016/j.chemosphere.2011.05.028. [DOI] [PubMed] [Google Scholar]
- 55.Bachelet D, Truong T, Verner MA, et al. Determinants of serum concentrations of 1,1-dichloro-2,2-bis(p-chlorophenyl)ethylene and polychlorinated biphenyls among French women in the CECILE study. Environ Res. 2011;111(6):861–870. doi: 10.1016/j.envres.2011.06.001. [DOI] [PubMed] [Google Scholar]
- 56.Laden F, Neas LM, Spiegelman D, et al. Predictors of plasma concentrations of DDE and PCBs in a group of U.S. women. Environ Health Perspect. 1999;107(1):75–81. doi: 10.1289/ehp.9910775. [DOI] [PMC free article] [PubMed] [Google Scholar]
- 57.Bjerregaard P, Pedersen HS, Nielsen NO, Dewailly E. Population surveys in Greenland 1993-2009: temporal trend of PCBs and pesticides in the general Inuit population by age and urbanisation. Sci Total Environ. 2013;454–455:283–288. doi: 10.1016/j.scitotenv.2013.03.031. [DOI] [PubMed] [Google Scholar]
- 58.Curren MS, Liang CL, Davis K, et al. Assessing Determinants of Maternal Blood Concentrations for Persistent Organic Pollutants and Metals in the Eastern and Western Canadian Arctic. Sci Total Environ. 2015; 527–28. [DOI] [PubMed]
- 59.Deutch B, Hansen JC. High blood levels of persistent organic pollutants are statistically correlated with smoking. Int J Circumpolar Health. 1999;58(3):214–219. [PubMed] [Google Scholar]
- 60.Deutch B, Pedersen HS, Jorgensen EC, Hansen JC. Smoking as a determinant of high organochlorine levels in Greenland. Arch Environ Health. 2003;58(1):30–36. doi: 10.3200/AEOH.58.1.30-36. [DOI] [PubMed] [Google Scholar]
- 61.Deutch B, Pedersen HS, Asmund G, Hansen JC. Contaminants, diet, plasma fatty acids and smoking in Greenland 1999-2005. Sci Total Environ. 2007;372(2-3):486–496. doi: 10.1016/j.scitotenv.2006.10.043. [DOI] [PubMed] [Google Scholar]
- 62.Ayotte P, Dewailly E, Lambert GH, et al. Biomarker measurements in a coastal fish-eating population environmentally exposed to organochlorines. Environ Health Perspect. 2005;113(10):1318–1324. doi: 10.1289/ehp.7970. [DOI] [PMC free article] [PubMed] [Google Scholar]
- 63.Phillips DL, Pirkle JL, Burse VW, Bernert JTJ, Henderson LO, Needham LL. Chlorinated hydrocarbon levels in human serum: effects of fasting and feeding. Arch Environ Contam Toxicol. 1989;18(4):495–500. doi: 10.1007/BF01055015. [DOI] [PubMed] [Google Scholar]
- 64.Curren MS, Davis K, Liang CL, et al. Comparing plasma concentrations of persistent organic pollutants and metals in primiparous women from northern and southern Canada. Sci Total Environ. 2014;479–480:306–318. doi: 10.1016/j.scitotenv.2014.01.017. [DOI] [PubMed] [Google Scholar]
- 65.Muennig P, Song X, Payne-Sturges DC, Gee GC. Blood and urine levels of long half-life toxicants by nativity among immigrants to the United States. Sci Total Environ. 2011;412–413:109–113. doi: 10.1016/j.scitotenv.2011.09.077. [DOI] [PubMed] [Google Scholar]
- 66.Domingo JL, Jogsten IE, Eriksson U, et al. Human dietary exposure to perfluoroalkyl substances in Catalonia, Spain. Temporal trend. Food Chem. 2012;135(3):1575–1582. doi: 10.1016/j.foodchem.2012.06.054. [DOI] [PubMed] [Google Scholar]
- 67.Domingo JL. Polybrominated diphenyl ethers in food and human dietary exposure: a review of the recent scientific literature. Food Chem Toxicol. 2012;50(2):238–249. doi: 10.1016/j.fct.2011.11.004. [DOI] [PubMed] [Google Scholar]
- 68.Gasull M, Bosch de Basea M, Puigdomenech E, Pumarega J, Porta M. Empirical analyses of the influence of diet on human concentrations of persistent organic pollutants: a systematic review of all studies conducted in Spain. Environ Int. 2011;37(7):1226–1235. doi: 10.1016/j.envint.2011.05.008. [DOI] [PubMed] [Google Scholar]
- 69.Hernandez AR, Boada LD, Mendoza Z, et al. Consumption of organic meat does not diminish the carcinogenic potential associated with the intake of persistent organic pollutants (POPs). Environ Sci Pollut Res Int 2015 Apr 19. Epub ahead of print. [DOI] [PubMed]
- 70.Needham LL, Grandjean P, Heinzow B, et al. Partition of environmental chemicals between maternal and fetal blood and tissues. Environ Sci Technol. 2011;45(3):1121–1126. doi: 10.1021/es1019614. [DOI] [PMC free article] [PubMed] [Google Scholar]
- 71.Lokke H, Ragas AM, Holmstrup M. Tools and perspectives for assessing chemical mixtures and multiple stressors. Toxicology. 2013;313(2-3):73–82. doi: 10.1016/j.tox.2012.11.009. [DOI] [PubMed] [Google Scholar]
- 72.Faupel-Badger JM, Hsieh CC, Troisi R, Lagiou P, Potischman N. Plasma volume expansion in pregnancy: implications for biomarkers in population studies. Cancer Epidemiol Biomarkers Prev. 2007;16(9):1720–1723. doi: 10.1158/1055-9965.EPI-07-0311. [DOI] [PubMed] [Google Scholar]