Significance
Intracellular components of the bacterial flagellar motor acted on by force-generating elements of the stator to power rotation of the extracellular hook and filament have been visualized by EM. Their molecular composition is known, but their actual rotation has never been shown. Here, a method for bleaching and probing a fusion protein rigidly linked to one of the innermost components of the flagellar motor of Escherichia coli, FliN, was used to show that the components commonly thought to rotate as a unit actually do so.
Keywords: Escherichia coli, C ring, polarized fluorescence bleaching
Abstract
Most bacteria that swim, including Escherichia coli, are propelled by helical filaments, each driven at its base by a rotary motor powered by a proton or a sodium ion electrochemical gradient. Each motor contains a number of stator complexes, comprising 4MotA 2MotB or 4PomA 2PomB, proteins anchored to the rigid peptidoglycan layer of the cell wall. These proteins exert torque on a rotor that spans the inner membrane. A shaft connected to the rotor passes through the peptidoglycan and the outer membrane through bushings, the P and L rings, connecting to the filament by a flexible coupling known as the hook. Although the external components, the hook and the filament, are known to rotate, having been tethered to glass or marked by latex beads, the rotation of the internal components has remained only a reasonable assumption. Here, by using polarized light to bleach and probe an internal YFP-FliN fusion, we show that the innermost components of the cytoplasmic ring rotate at a rate similar to that of the hook.
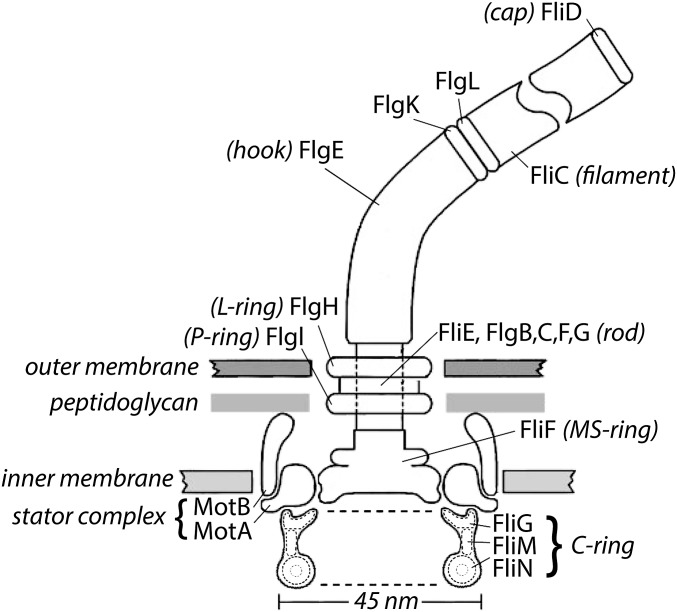
Bacterial flagella are driven at their base by rotary motors (1) as shown dramatically by the tethered cell technique (2). Most of what we know about the structure of the flagellar basal body, shown schematically in Fig. 1, has been found by EM studies of material attached to the base of flagellar filaments that survives weakening of cell walls by treatment with lysozyme-EDTA, solubilization with Triton X-100, and differential centrifugation (3, 4). DePamphilis and Adler (3) described four rings on a rod, the M and S rings and the P and L rings: M for membranous, S for supramembranous, P for peptidoglycan, and L for lipopolysaccharide. This arrangement led to the suggestion that torque is generated between the S and M rings, with the former attached to the peptidoglycan layer (5). This idea was abandoned when it was found that the M and S rings are made from multiple copies of a single protein, FliF (6). It was then realized that the stator complexes, linked to the peptidoglycan by the C terminus of MotB, were the membrane studs seen in freeze-fracture experiments (7, 8). Each stator complex is composed of (MotA)4 (MotB)2 and sports two ion channels (9). On the cytoplasmic side of the M ring is what is now called the C ring (C for cytoplasmic), which contains FliG, FliM, and FliN, components of the switch complex that control the direction of flagellar rotation, although FliG is considered by some as part of the M ring rather than the C ring. One model inspired by the symmetry mismatch between FliG (26 subunits) and FliM (34 subunits) has been proposed in which, when cells are tethered so that the filament is fixed and the cell body rotates, the C ring rotates 8/34 as fast as the cell body (10). However, most workers assume that the M ring and the C ring rotate as a unit. Recent work with cryo-EM tomography has embellished this picture (11, 12) but has not changed the basic story. A general review is in ref. 13.
Fig. 1.
A scale drawing of the base of the Escherichia coli flagellum embedded in three layers of the cell wall. The outer and inner layers are fluid, but the intermediate layer, the peptidoglycan, is rigid, which gives the cell the shape of a rod with semispherical end caps. The external components of the flagellum (components that extend beyond the cell wall) include the hook (FlgE), the hook-associated proteins (FlgK, FlgL, FliD), and the filament (FliC). All the other components are internal. The internal components thought to rotate include the rod, the MS ring, and the C ring. The filament (a polymer of the protein FliC; also called flagellin) is shown broken, because it is several micrometers long. Polymerization occurs under the distal cap (FliD). Two adapter proteins (hook-associated proteins FlgK and FlgL) enable the FlgE to flex and the filament to rotate rigidly. The filament is a propeller that exhibits different polymorphic forms depending on the direction of rotation and torsional load, whereas the hook is a flexible coupling (or universal joint). A flexible coupling is required, because the hooks project from the sides of the cell, whereas the bundle of filaments (approximately four in number) that pushes the cell forward tends to align with the long axis of the cell. The rod (or drive shaft: FliE and FlgB, -C, -F, and -G) is connected to the hook at its distal end and the MS ring (the central part of the rotor) at its proximal end. The rod passes through the L and P rings (FlgH and FlgI), which are mounted in the outer membrane and peptidoglycan layers, respectively, and thought to serve as bushings. Torque is generated when protons flow from the outside to the inside of the cell through two channels in a stator complex bounded by 4MotA and 2MotB. Each stator complex—there are as few as 1 or as many as 11—is linked to the peptidoglycan by the C terminus of MotB and interacts electrostatically through a cytoplasmic domain of MotA with the end of FliG farthest from the axis of rotation. Other components of the C ring, FliM and FliN, interact with the signaling molecule of the chemotaxis network, CheY-P, to control the direction of rotation. At room temperature, the direction of rotation in the absence of CheY-P is counterclockwise (the direction of rotation of the rod when viewed from outside of the cell; i.e., from the top in this figure). Each motor comprises 26 copies of FliF and FliG, 34–45 copies of FliM, and 34–45 tetramers of FliN. The FliN tetramers appear as donuts in the cross-sectional view of the C ring shown here. The motor changes the number of stator complexes in response to viscous load and the number of FliM and FliN subunits in response to the ambient direction of rotation; the smaller number (34) is found in clockwise-spinning motors, and the larger number (45) is found in counterclockwise-spinning motors. The FliN tetramers are about 4 nm apart and separated by C-terminal domains of FliM. Not shown are CheY-P; FliH, an export component known to interact with FliN; FliL, a component that enhances torque and interacts with the stator complex and the MS ring; and the flagellar export apparatus that coordinates the export of axial flagellar components and is mounted at the center of the cytoplasmic face of the MS ring.
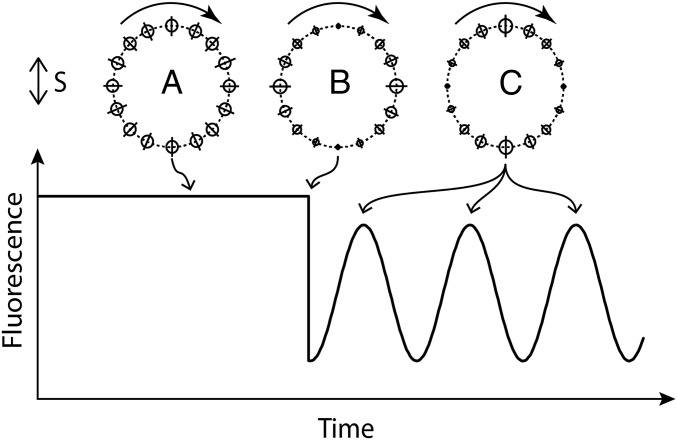
To investigate the rotation of the C ring, we designed a polarized fluorescence bleaching experiment reminiscent of experiments used to study the orientation of single macromolecules (14, 15). We labeled the most abundant component of the C ring, FliN, with a YFP fluorophore and probed it with weak polarized light. Each YFP was linked to the C ring at both its N and C termini. Then, we applied an intense, short flash of light of the same polarization. Because the fluorophores with absorption transition moments oriented along the electric vector of the excitation light are preferentially excited (16) and thus, bleached by the flash, the surviving fluorophores are expected to be oriented mostly perpendicularly to the direction of polarization of the excitation light at the time of bleaching as shown schematically in Fig. 2.
Fig. 2.
A schematic diagram of the experiment showing the polarization of the probe and bleaching beams (S), the ring of fluorophores before bleaching (a), the ring of fluorophores immediately after bleaching (b), the ring of fluorophores one-quarter and successive one-half turns later (c), and the fluorescence emission intensity expected as a function of time.
Under the assumption that YFP and FliN are rigidly attached to each other and the ring, the only reason for a fluorophore to change its orientation is the rotation of the C ring itself. Thus, the fluorescence emission that abruptly decreased after bleaching is expected to rapidly increase as the surviving fluorophores rotate now toward a parallel orientation. For an expected rotation frequency near zero load of around 300 Hz (17), the maximum emission is expected to occur in about 830 μs (at one-quarter of a turn) and then, decrease to a minimum in another 830 μs (at one-half of a turn). Assuming that the transition moments of the fluorophores are roughly in the plane of the membrane, the fluorescence emission after bleaching is expected to ring at twice the frequency of rotation of the C ring, because each dipole aligns with the polarization of the probe beam twice during each revolution. If this experiment is done with a population of motors rotating at slightly different speeds (figure 2 a and b in ref. 17), then the fluorescence emission after bleaching will damp out as the different C rings get out of phase.
Results and Discussion
Single-motor experiments had a signal-to-noise ratio too low to allow identification of a clear periodicity in the postbleaching fluorescence emission vs. time curve. To improve on the signal-to-noise ratio, we averaged signals from multiple single-motor experiments. Simulations that took into account the speed distribution reported for motors rotating near zero load (17) showed that the averaged signal that we expected to see damps in about 5 ms after the bleaching pulse, as shown by the red lines in Fig. 3 A–C. To improve the time resolution and freeze the motor rotation, we strobed the probe beam using one 15-μs pulse per camera frame and combined experiments with different motors and different phase delays between the bleaching pulse and the actual exposure during each camera frame.
Fig. 3.
Polarized fluorescence intensity vs. time (circles; with SDs) for populations of motor spots after (A) a 300-μs polarized bleaching pulse centered at time 0 for n = 903 motors, (B) a 450-μs polarized bleaching pulse centered at time 0 for n = 1,055 motors in cells from a different culture, (C) the data of A and C were combined, and (D) a 450-μs polarized bleaching pulse centered at time 0 for n = 734 motors in cells fixed with glutaraldehyde. All experiments were carried out at 23.5 °C. The red lines represent the best fits of the experimental data points as described in Methods. The thin vertical lines are the demarcations between the camera frames.
There were no signs of periodicity in the averaged combined fluorescence emission vs. time curves before bleaching pulses were applied. The after-bleaching portion of the curves (Fig. 3 A–C) shows, as predicted, a periodic fluctuation of motor spot intensities with speeds close to those previously reported for similar conditions of load and temperature (18) that damps in about 3–4 ms with the proper phase with respect to the bleaching pulse: 323 ± 100, 281 ± 79, and 306 ± 92 Hz for the datasets corresponding to bleaching pulses of 300 and 450 μs and the combined dataset, respectively. Control experiments carried out under similar conditions on cells with motors unable to rotate (fixed with glutaraldehyde) (Fig. 3D) showed no clear signs of oscillations in the postbleaching curve.
The result of this experiment suggests strongly that the inner components of the C ring are, indeed, part of the rotor and rotate at the same frequency as the hook. No slippage between the C ring and the hook is apparent under the low-load conditions of our experiment.
Methods
Strain construction and sample preparation were essentially as described in ref. 19. The experimental strain was derived from WT strain RP437 (20), with hooks but no filaments and with FliN replaced by FliN-YFPINT, in which YFP was spliced internally between amino acids 45 and 46 of FliN (19). This site is near the outer surface of the FliN tetramer, which is shaped as a torus (21). Tethered cells of this strain spin at about the same rate (5.4 ± 2.2 Hz) as cells of the WT strain (5.6 ± 1.8 Hz) with a similar clockwise bias (table 1 in ref. 19), and 150-nm gold beads attached to hooks of this strain spin at about the same rate (248 ± 48 Hz) as they do when attached to hooks of the WT strain (239 ± 50 Hz). The work was done in tunnel slides prepared from number 1 coverslips (catalog nos. 48366 045 and 48393 048; VWR Scientific) separated by two layers of double-stick Scotch tape. This assembly was coated with poly-l-lysine (0.01%; catalog no. P4707; Sigma-Aldrich) for 2 min and rinsed with motility medium (10 mM potassium phosphate, 0.1 mM EDTA, 10 mM lactate, pH 7.0). Cells suspended in motility medium were added and allowed to stand for 15 min, with the excess washed out with motility medium. Then, the control cells were exposed to glutaraldehyde (0.25% in motility medium; catalog no. 111–30-8; Sigma-Aldrich) for 15 min, which was washed out with motility medium. This treatment is known to lock up flagellar motors (22). Therefore, although all of the cell bodies were adsorbed to glass, most of the motors of the experimental strain were free to spin, whereas none of the motors of the control strain were able to do so.
Polarized Bleaching Fluorescence Microscopy Setup.
Cells in the tunnel slides were imaged with a 40× 1.3-N.A. oil immersion objective mounted on an inverted Nikon Diaphot 200 Microscope. The fluorescence excitation light source was a 2-W argon ion laser (model no. 2017–06S; Spectra-Physics) tuned to 514 nm and adjusted to a power output of 1 W. We excited the sample from above through a 0.4-N.A. long-working distance (∼5 mm) Nikon 20× objective to reduce the effect of the depolarization of light (23) that occurs at the focal point of high-N.A. objectives (24). This lens also worked as a condenser for bright-field illumination. The laser light was diverted toward the sample with a 527-nm long-pass dichroic mirror (part no. 527DCLP; Chroma Technologies) placed between the bright-field illumination source (a 1-W white light-emitting diode) and the condenser. A second long-pass dichroic mirror (part no. Di01-R514-25x36; Semrock) was placed under the 40× objective followed by a 514-nm single-notch filter (part no. NF01-514U-25; Semrock) to deflect and attenuate the excitation light, respectively. No emission filter was used. The emission path was split in S and P polarizations with a cube beam splitter (model 10FC16PB.3; New Focus), and the images were projected on two halves of an EM CCD camera (model no. DU-860E; Andor Technology) with a custom-made beam splitter.
For each experiment (sequence acquisition), 200 frames representing a cropped area of the sensor of 128 × 32 pixels were acquired in frame transfer mode, which provided an almost continuous exposure with virtually no pauses between frames. The average of one such acquisition is shown in Fig. S1. Each frame lasted about 650 μs. The electron multiplying gain was set to 150. The actual exposure time was set to 15 μs per frame by turning the laser excitation beam on briefly with a fast electronic switch at specific times () during the camera exposure: 50, 150, 275, 450, or 520 μs from the beginning of each exposure as monitored through the “Fire” output of the camera, depending on the particular experiment. A laser bleaching pulse of 300 or 450 μs was applied during frame 10. The laser intensity of the bleaching pulse was adjusted empirically to bleach motors in the sample to about one-third to two-thirds of the motor spot intensity before bleaching. The fast electronic switching of the laser beam was carried out with an electrooptical deflector (model no. 310A; Conoptics), which directed the laser beam through a pinhole (excitation on) or away from it (excitation off) as a function of the input voltage provided by two high-voltage power supplies (model no. HP 6515A; Hewlett Packard) and controlled by a tristate switch (model no. RIS-688; Rowland Institute at Harvard). The laser intensity was adjusted with an electrooptical modulator (EOM; model no. 350–50; Conoptics) driven by a high-voltage differential amplifier (model no. 302 RM; Conoptics) followed by a Glan-laser polarizer (part no. GL10-A; Thorlabs). The timing and synchronization of the Andor camera and laser beam deflection (electrooptical deflector) and intensity (EOM) as well as the microscope stage movement were accomplished by custom electronics and programming of Arduino microcontrollers. The images were acquired using the Andor Solis software provided by the camera manufacturer.
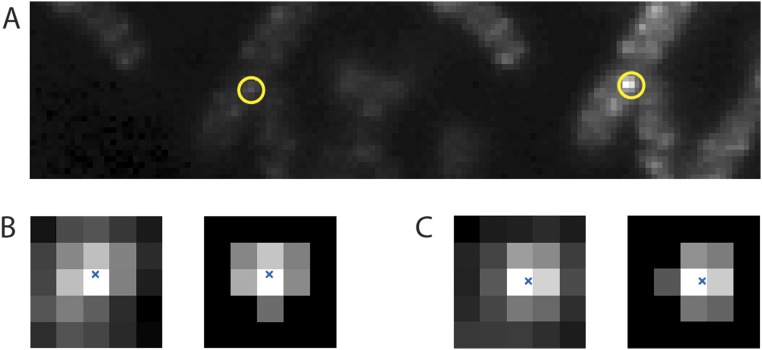
Fig. S1.
(A) An image of 128 × 32 pixels averaged over 199 frames taken before and after the bleaching pulse showing five cells with about 12 fluorescent motors excited in the S, with one motor circled in yellow. The P fluorescence is shown on the left, and the S fluorescence is shown on the right. (B, Left) Pixels in the vicinity of the motor image in P (B, Right) cropped to within 150 nm of that image’s center of mass. The image’s center of mass is marked with a blue x. (C) Pixels in the vicinity of the motor image in S displayed in a similar manner.
Preliminary Experiments with Free Fluorphores or Fluorescent Beads.
The setup was tested by probing and bleaching with polarized light fluorophores that were free to rotate (solutions of fluorescein or Cy-3 of different concentrations) or were not free to rotate (fluorescent commercial beads adsorbed to the glass substrate with poly-l-lysine). The samples were probed with S and P polarized light alternately (odd frames in S and even frames in P) by adjusting the voltage applied to the EOM after removing the Glan polarizer from the setup and bleached in either S or P. The fluorescence emission went down in both S and P emission channels after bleaching, regardless of the polarization in which the bleaching pulse occurred. In case of the free fluorophore solutions, the polarized bleaching was followed by recovery of the fluorescence to similar levels in both channels (S and P). In case of the adsorbed beads with fluorophores unable to rotate freely, the fluorescence level after bleaching remained significantly lower in the channel in which the bleaching occurred (either S or P).
Preliminary Experiments with Cell Populations.
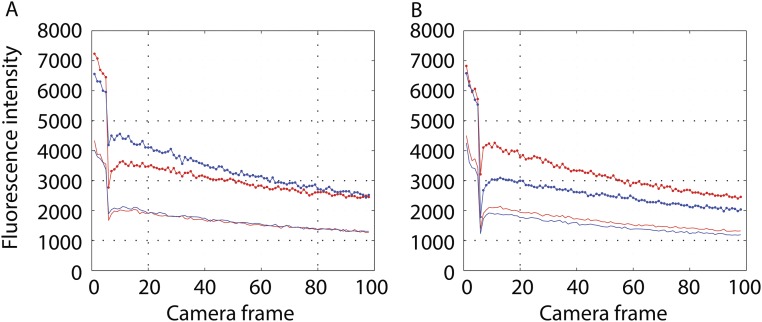
The experiments just described were repeated with cells rather than with beads. For FliN-YFPINT cells in which motors could rotate, the fluorescence levels after photobleaching were essentially identical in both channels (Fig. S2), whereas for such cells fixed with glutaraldehyde, the fluorescence level after photobleaching remained significantly lower in the channel in which the bleaching occurred (either S or P) (Fig. S3). The reason for this difference was that the bleaching pulse was long (1.88 ms) relative to one-quarter of the expected rotation interval (∼0.83 ms). This experiment shows that the C ring rotates, but it does not determine the rotation frequency.
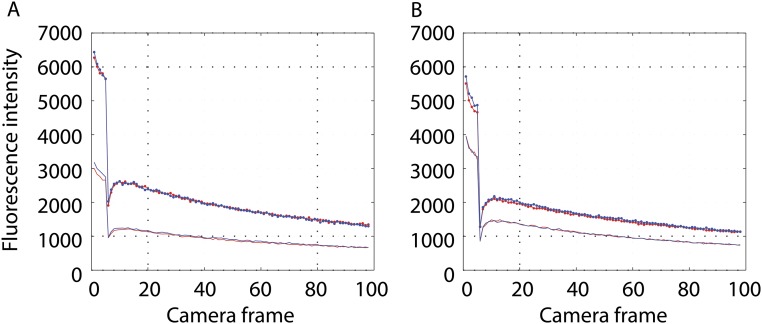
Fig. S2.
Experiments with a population of cells with fluorescent motors. (A) Cells bleached in S (red) or P (blue) excited in S and read in S (upper curves; lines and circles) or exited in S and read in P (lower curves; no symbols). (B) Cells bleached in S (red) or P (blue) excited in P and read in P (upper curves; circles) or excited in P and read in S (lower curves; no symbols).
Fig. S3.
Experiments with a population of cells with fluorescent motors fixed by gluteraldehyde. A is similar to Fig. S2A. B is similar to Fig. S2B.
Experiments with Individual Motors.
The excitation, bleaching, and emission were carried out and evaluated in the same polarization. The focus was adjusted manually in epifluorescence on live camera images; then, the laser was turned off, and the field of view was moved with a motorized stage a few laser spot diameters (∼50–100 μm) before triggering the image acquisition. Thus, we believe that most, if not all, of the fluorophore bleaching occurred during the actual sequence acquisition. The field of view was moved in between acquisitions in a raster pattern, with the focusing procedure being repeated about every 10–20 acquisitions. The experiments were carried out at room temperature.
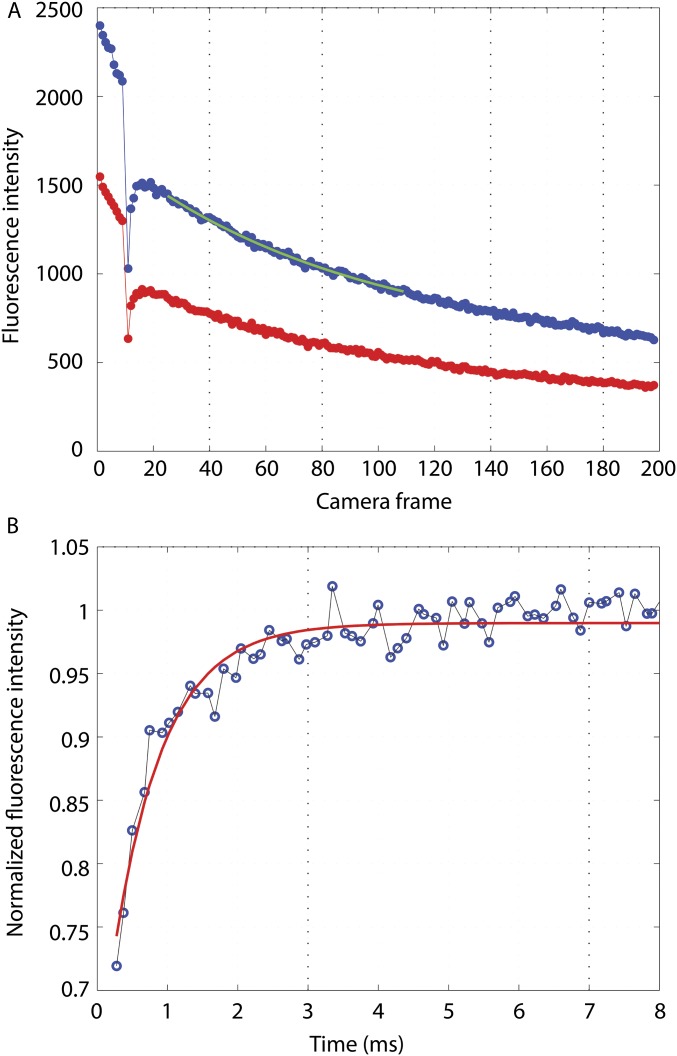
The data analysis was carried out in Matlab (The MathWorks, Inc.) as follows. All of the frames before and after the bleaching pulse in a given sequence were averaged. The motor locations were determined by calculating the center of mass of each motor spot in the averaged image. The motor intensities in each frame were then calculated as the sum of all pixel counts within a radius of 150 nm around the center of mass of the respective motor after subtracting the background value of each pixel and plotted as a function of time. The background pixel values were obtained by averaging sequences of 200 frames of poly-L-lysine–coated tunnel slides with motility buffer but no cells, acquired after each experiment under identical conditions (using the same camera acquisition and laser excitation parameters). The motor intensity curves were normalized so that the average of all data points before bleaching was one. All curves in a given set of experiments (with the same value) were averaged. Postbleaching curves were normalized to a single exponential decay with an offset, , to compensate for the slow, irreversible bleaching caused by probing; , b1, and were parameters determined from the average postbleaching curve by fitting data points 16–100 as shown in Fig. S4A. The five normalized curves (for the different tx values) were combined, resulting in a postbleaching curve with an effective time resolution that exceeded about five times the acquisition frame rate of the camera. This curve was again normalized to an exponential curve (Fig. S4B) to compensate for the reversible bleaching that followed the bleaching pulse and provide a baseline for the expected ringing. Note that both the reversible and slow irreversible bleaching by probing occurred at a much slower rate than the ringing.
Fig. S4.
(A) Curves of average fluorescence for tx = 50 μs with bleaching at frame 10. Excitation in S and emission in S (blue) and P (red). The green segment is the fit for frames 16–100 after bleaching. (B) The curve combining all tx values (blue circles) fit to a single exponential (red line).
Each experimental dataset was fit using the nonlinear Levenberg–Marquardt least squares method with a curve representing the average signal expected to be seen in a population of motors rotating at normally distributed speeds with a mean frequency and an SD of : , where is the overall fluorescence intensity, is the amplitude of the signal coming from a single motor rotating with a frequency of Hz, and is the time; , , and were fitting parameters. was chosen to be 2,000.
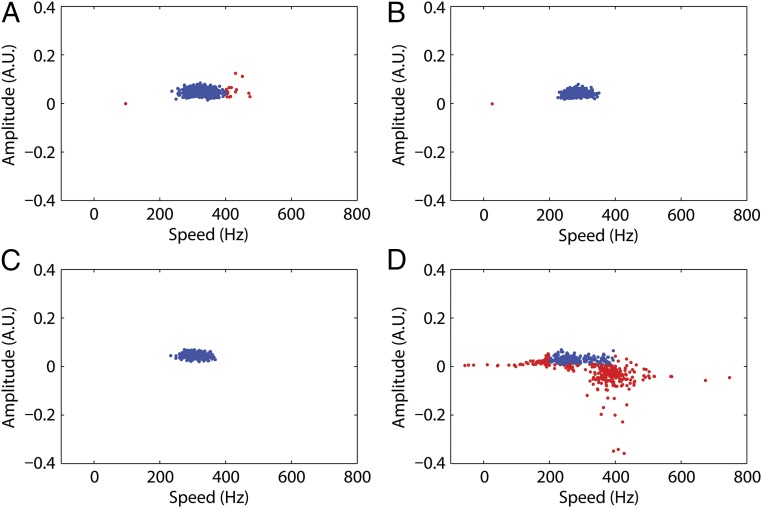
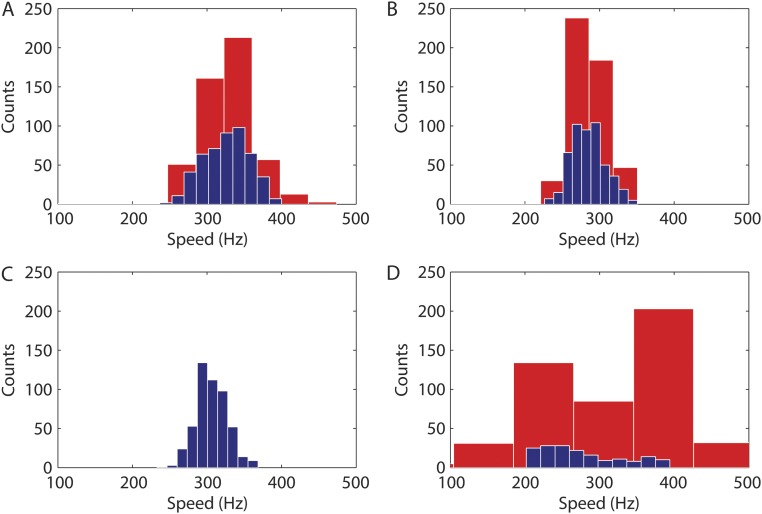
The quality of fitting was evaluated using the bootstrap method (25) as follows. From the raw data comprising N measurements at a given time point, we picked N measurements at random and constructed a synthetic dataset. This dataset was processed in the same way as the original dataset. We repeated this process 500 times and plotted the fitting parameters (Fig. 4). The vast majority of the fitting parameters of the synthetic datasets were within the range of the positive experiment results (i.e., between 200 and 400 Hz and between 0.01 and 0.1 arbitrary units): 97%, 99.8%, and 100% for the datasets corresponding to bleaching pulses of 300 and 450 μs and the combined dataset, respectively. In contrast, only 34.2% of the synthetic control dataset found fitting parameters within the positive result range (Fig. 4 and Figs. S5 and S6).
Fig. 4.
Parameters obtained from the bootstrap fits: speed vs. amplitude. Blue points indicate parameters within the confidence intervals 200–400 Hz (speed) and 0.01–0.1 arbitrary units (amplitude). Red points indicate parameters outside these confidence intervals. The percentages of fits within the confidence intervals were (A) 97% for the 300-μs bleaching pulse, (B) 99.8% for the 450-μs bleaching pulse, (C) 100% for the combined dataset, and (D) 34.2% for the control experiments. The means and SDs for the blue points in A–C were 325.8 ± 30.6, 284.8 ± 22.4, and 306.2 ± 20.8 Hz, respectively.
Fig. S5.
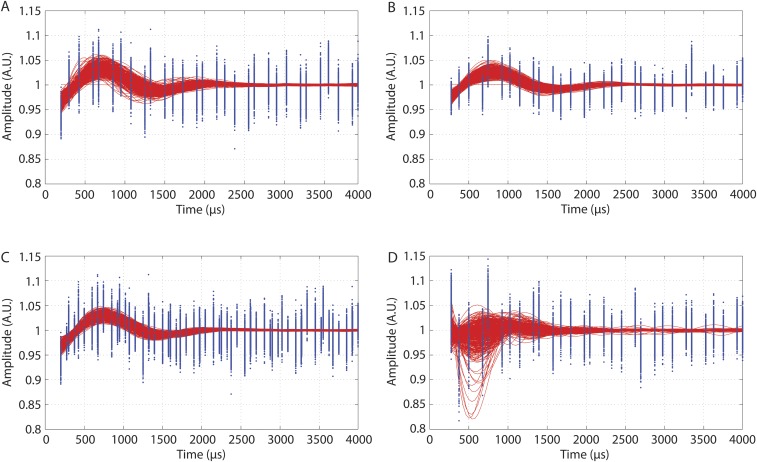
Bootstrap fitting results: all 500 bootstrap datasets superimposed (blue points) and their best fits (red lines) for (A) the 300-μs bleaching pulse, (B) the 450-μs bleaching pulse, (C) the combined dataset, and (D) the control.
Fig. S6.
Bootstrap fitting results. Blue bars are histograms of the speed-fitting parameter values that fall within the confidence intervals (200–400 Hz for speed and 0.01–0.1 arbitrary units for amplitude): (A) 97% for the 300-μs bleaching pulse, (B) 99.8% for the 450-μs bleaching pulse, (C) 100% for the combined dataset, and (D) 34.6% for the control. Red bars are histograms of all speed-fitting parameter values.
Acknowledgments
We thank Junhua Yuan for doing the gold bead rotation experiments, Win Hill for help with the electronics, and Mike Burns for help with the data analysis. This work was supported by NIH Grant AI016478.
Footnotes
The authors declare no conflict of interest.
This article is a PNAS Direct Submission.
This article contains supporting information online at www.pnas.org/lookup/suppl/doi:10.1073/pnas.1511691113/-/DCSupplemental.
References
- 1.Berg HC, Anderson RA. Bacteria swim by rotating their flagellar filaments. Nature. 1973;245(5425):380–382. doi: 10.1038/245380a0. [DOI] [PubMed] [Google Scholar]
- 2.Silverman M, Simon M. Flagellar rotation and the mechanism of bacterial motility. Nature. 1974;249(452):73–74. doi: 10.1038/249073a0. [DOI] [PubMed] [Google Scholar]
- 3.DePamphilis ML, Adler J. Fine structure and isolation of the hook-basal body complex of flagella from Escherichia coli and Bacillus subtilis. J Bacteriol. 1971;105(1):384–395. doi: 10.1128/jb.105.1.384-395.1971. [DOI] [PMC free article] [PubMed] [Google Scholar]
- 4.Aizawa SI, Dean GE, Jones CJ, Macnab RM, Yamaguchi S. Purification and characterization of the flagellar hook-basal body complex of Salmonella typhimurium. J Bacteriol. 1985;161(3):836–849. doi: 10.1128/jb.161.3.836-849.1985. [DOI] [PMC free article] [PubMed] [Google Scholar]
- 5.Berg HC. Dynamic properties of bacterial flagellar motors. Nature. 1974;249(452):77–79. doi: 10.1038/249077a0. [DOI] [PubMed] [Google Scholar]
- 6.Ueno T, Oosawa K, Aizawa S. M ring, S ring and proximal rod of the flagellar basal body of Salmonella typhimurium are composed of subunits of a single protein, FliF. J Mol Biol. 1992;227(3):672–677. doi: 10.1016/0022-2836(92)90216-7. [DOI] [PubMed] [Google Scholar]
- 7.Coulton JW, Murray RGE. Cell envelope associations of Aquaspirillum serpens flagella. J Bacteriol. 1978;136(3):1037–1049. doi: 10.1128/jb.136.3.1037-1049.1978. [DOI] [PMC free article] [PubMed] [Google Scholar]
- 8.Khan S, Dapice M, Reese TS. Effects of mot gene expression on the structure of the flagellar motor. J Mol Biol. 1988;202(3):575–584. doi: 10.1016/0022-2836(88)90287-2. [DOI] [PubMed] [Google Scholar]
- 9.Blair DF. Flagellar movement driven by proton translocation. FEBS Lett. 2003;545(1):86–95. doi: 10.1016/s0014-5793(03)00397-1. [DOI] [PubMed] [Google Scholar]
- 10.Thomas DR, Morgan DG, DeRosier DJ. Rotational symmetry of the C ring and a mechanism for the flagellar rotary motor. Proc Natl Acad Sci USA. 1999;96(18):10134–10139. doi: 10.1073/pnas.96.18.10134. [DOI] [PMC free article] [PubMed] [Google Scholar]
- 11.Chen S, et al. Structural diversity of bacterial flagellar motors. EMBO J. 2011;30(14):2972–2981. doi: 10.1038/emboj.2011.186. [DOI] [PMC free article] [PubMed] [Google Scholar]
- 12.Zhao X, Norris SJ, Liu J. Molecular architecture of the bacterial flagellar motor in cells. Biochemistry. 2014;53(27):4323–4333. doi: 10.1021/bi500059y. [DOI] [PMC free article] [PubMed] [Google Scholar]
- 13.Berg HC. The rotary motor of bacterial flagella. Annu Rev Biochem. 2003;72:19–54. doi: 10.1146/annurev.biochem.72.121801.161737. [DOI] [PubMed] [Google Scholar]
- 14.Beausang JF, Sun Y, Quinlan ME, Forkey JN, Goldman YE. Orientation and rotational motions of single molecules by polarized total internal reflection fluorescence microscopy (polTIRFM) Cold Spring Harb Protoc. 2012;2012(5):pdb.top069344. doi: 10.1101/pdb.top069344. [DOI] [PMC free article] [PubMed] [Google Scholar]
- 15.Forkey JN, Quinlan ME, Goldman YE. Measurement of single macromolecule orientation by total internal reflection fluorescence polarization microscopy. Biophys J. 2005;89(2):1261–1271. doi: 10.1529/biophysj.104.053470. [DOI] [PMC free article] [PubMed] [Google Scholar]
- 16.Lakowicz JR. Fluorescence Anisotropy. Principles of Fluorescence Spectroscopy. 2nd Ed. Kluwer Academic/Plenum; New York: 1999. pp. 291–319. [Google Scholar]
- 17.Yuan J, Berg HC. Resurrection of the flagellar rotary motor near zero load. Proc Natl Acad Sci USA. 2008;105(4):1182–1185. doi: 10.1073/pnas.0711539105. [DOI] [PMC free article] [PubMed] [Google Scholar]
- 18.Yuan J, Berg HC. Thermal and solvent-isotope effects on the flagellar rotary motor near zero load. Biophys J. 2010;98(10):2121–2126. doi: 10.1016/j.bpj.2010.01.061. [DOI] [PMC free article] [PubMed] [Google Scholar]
- 19.Branch RW, Sayegh MN, Shen C, Nathan VS, Berg HC. Adaptive remodelling by FliN in the bacterial rotary motor. J Mol Biol. 2014;426(19):3314–3324. doi: 10.1016/j.jmb.2014.07.009. [DOI] [PMC free article] [PubMed] [Google Scholar]
- 20.Parkinson JS. Complementation analysis and deletion mapping of Escherichia coli mutants defective in chemotaxis. J Bacteriol. 1978;135(1):45–53. doi: 10.1128/jb.135.1.45-53.1978. [DOI] [PMC free article] [PubMed] [Google Scholar]
- 21.Sarkar MK, Paul K, Blair DF. Subunit organization and reversal-associated movements in the flagellar switch of Escherichia coli. J Biol Chem. 2010;285(1):675–684. doi: 10.1074/jbc.M109.068676. [DOI] [PMC free article] [PubMed] [Google Scholar]
- 22.Block SM, Blair DF, Berg HC. Compliance of bacterial flagella measured with optical tweezers. Nature. 1989;338(6215):514–518. doi: 10.1038/338514a0. [DOI] [PubMed] [Google Scholar]
- 23.Richards B, Wolf E. Electromagnetic diffraction in optical systems. 2. Structure of the image field in an aplanatic system. Proc R Soc Lond A Math Phys Sci. 1959;253(1274):358–379. [Google Scholar]
- 24.Bahlmann K, Hell SW. Electric field depolarization in high aperture focusing with emphasis on annular apertures. J Microsc. 2000;200(Pt 1):59–67. doi: 10.1046/j.1365-2818.2000.00739.x. [DOI] [PubMed] [Google Scholar]
- 25.Press WH, Teukolsky SA, Vetterling WT, Flannery BP. Confidence Limits on Estimated Model Parameters. Numerical Recipes in Fortran: The Art of Scientific Computing. 2nd Ed. Cambridge Univ Press; Cambridge, United Kingdom: 1992. pp. 684–694. [Google Scholar]


