Abstract
BACKGROUND. Clinical laboratory tests are now being prescribed and made directly available to consumers through retail outlets in the USA. Concerns with these test have been raised regarding the uncertainty of testing methods used in these venues and a lack of open, scientific validation of the technical accuracy and clinical equivalency of results obtained through these services.
METHODS. We conducted a cohort study of 60 healthy adults to compare the uncertainty and accuracy in 22 common clinical lab tests between one company offering blood tests obtained from finger prick (Theranos) and 2 major clinical testing services that require standard venipuncture draws (Quest and LabCorp). Samples were collected in Phoenix, Arizona, at an ambulatory clinic and at retail outlets with point-of-care services.
RESULTS. Theranos flagged tests outside their normal range 1.6× more often than other testing services (P < 0.0001). Of the 22 lab measurements evaluated, 15 (68%) showed significant interservice variability (P < 0.002). We found nonequivalent lipid panel test results between Theranos and other clinical services. Variability in testing services, sample collection times, and subjects markedly influenced lab results.
CONCLUSION. While laboratory practice standards exist to control this variability, the disparities between testing services we observed could potentially alter clinical interpretation and health care utilization. Greater transparency and evaluation of testing technologies would increase their utility in personalized health management.
FUNDING. This work was supported by the Icahn Institute for Genomics and Multiscale Biology, a gift from the Harris Family Charitable Foundation (to J.T. Dudley), and grants from the NIH (R01 DK098242 and U54 CA189201, to J.T. Dudley, and R01 AG046170 and U01 AI111598, to E.E. Schadt).
Introduction
Clinical laboratory testing plays a critical role in health care and evidence-based medicine (1). Lab tests provide essential data that support clinical decisions to screen, diagnose, and treat health conditions (2). Most individuals encounter clinical testing through their health care provider during a routine health assessment or as a patient in a health care facility. However, individuals are increasingly playing more active roles in managing their health, and some now seek direct access to laboratory testing for self-guided assessment or monitoring (3–5).
In the USA, all clinical laboratory testing conducted on humans is regulated by Centers for Medicare & Medicaid Services (CMS) based on guidelines outlined in Clinical Laboratory Improvement Amendments (CLIA) (6). To ensure analytical quality of laboratory methods, certified laboratories are required to participate in periodic proficiency testing using a homogeneous batch of samples that are distributed to each laboratory from a CMS-approved proficiency testing program. These programs assess the total allowable error (TEa) that combines method bias and total imprecision for each analyte. Acceptability criteria are determined by CLIA and/or the appropriate accrediting agency (7).
Direct-to-consumer service models now provide means for individuals to obtain laboratory testing outside traditional health care settings (4, 5). One company implementing this new model is Theranos, which offers a blood testing service that uses capillary tube collection and promises several advantages over traditional venipuncture: lower collection volumes (typically ≤150 μl versus ≥1.5 ml), convenience, and reduced cost — on average about 5-fold less than the 2 largest testing laboratories in the USA (Quest and LabCorp) (8). However, availability of these services varies by state, where access to offerings may be more or less restrictive according to state-level health care regulations. Furthermore, Theranos is a private company, and the technical details of their test procedures and processes are not available to the public.
Despite its commercial availability and technological promise, the Theranos collection system has not yet been evaluated through independent, rigorous, and publicly disclosed peer-review (9). To encourage transparency and rigorous scientific review of clinical laboratory testing procedures, we conducted a cohort study of 60 individuals from July 27, 2015, to July 31, 2015, to compare the accuracy and equivalency of clinical laboratory test blood collected via finger prick and tested at Theranos against traditional venipuncture, followed by laboratory testing offered through Quest Diagnostics and LabCorp. We controlled how blood was collected and obtained multiple measurements for statistical analyses, but we intentionally treated each testing service as a black box to avoid jeopardizing the integrity of the tests and to simulate real-world conditions in which those ordering the tests for clinical decision making may lack knowledge of how a given test was run but will nevertheless base important health-related decisions on the test results. Here, we report that the Theranos finger prick collection system yields higher sample rejection rates, and their testing services return results that mostly agree with other services with the exception of lipid panels, which — despite existing laboratory practice standards — exhibited greater bias than would be expected, given adherence to such standards.
Results
Theranos sample collection has higher sample rejection rates.
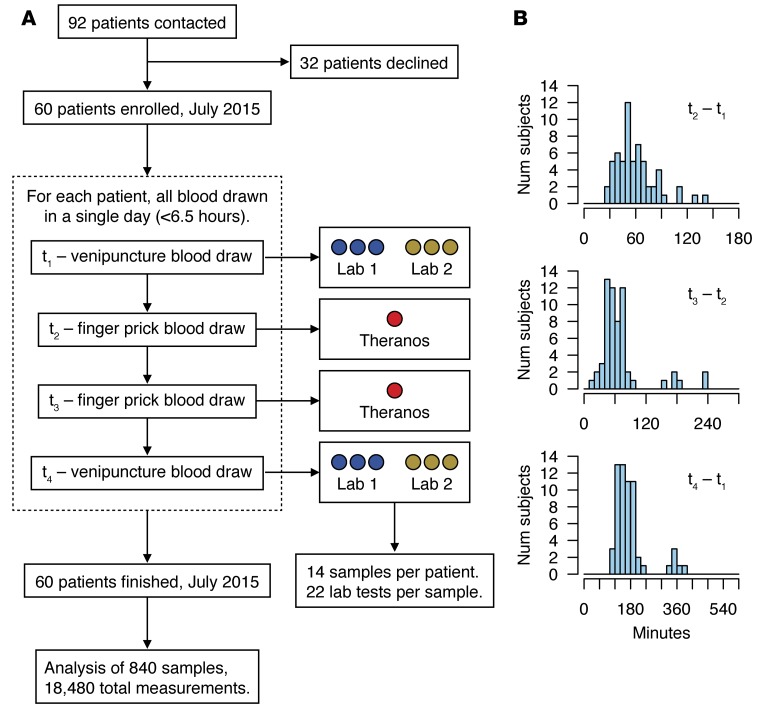
To evaluate reporting of lab test results obtained from different blood collection methods, we selected tests that obtained small volumes of blood via finger prick and matched them with corresponding tests offered through traditional venipuncture collection from the other services. Overall, we collected 14 samples per subject and obtained 22 clinical lab measurements (Table 1) per sample for all 60 subjects, which provided a potential total of 18,480 measurements (14 × 22 × 60) in our study data set (Figure 1). We observed 71 missing measurements that could be explained by a technical issue with sample processing or instrumentation error, both of which were identified and reported by the laboratories through current laboratory practices. We assessed 2,640 (Theranos); 7,920 (LabCorp); and 7,920 (Quest) possible measurements and found missing data rates of 2.2%, 0.2%, and 0%, respectively. Based on the counts of missing data, the odds of Theranos rejecting a sample versus the other services was 12.5 (95% CI, 6.9–22.4, P = 1.5 × 10⁻²²). LabCorp’s missing data was restricted to a single subject, whereas Theranos returned missing data for 4 of the 60 study subjects.
Table 1. Catalog of clinical laboratory tests.
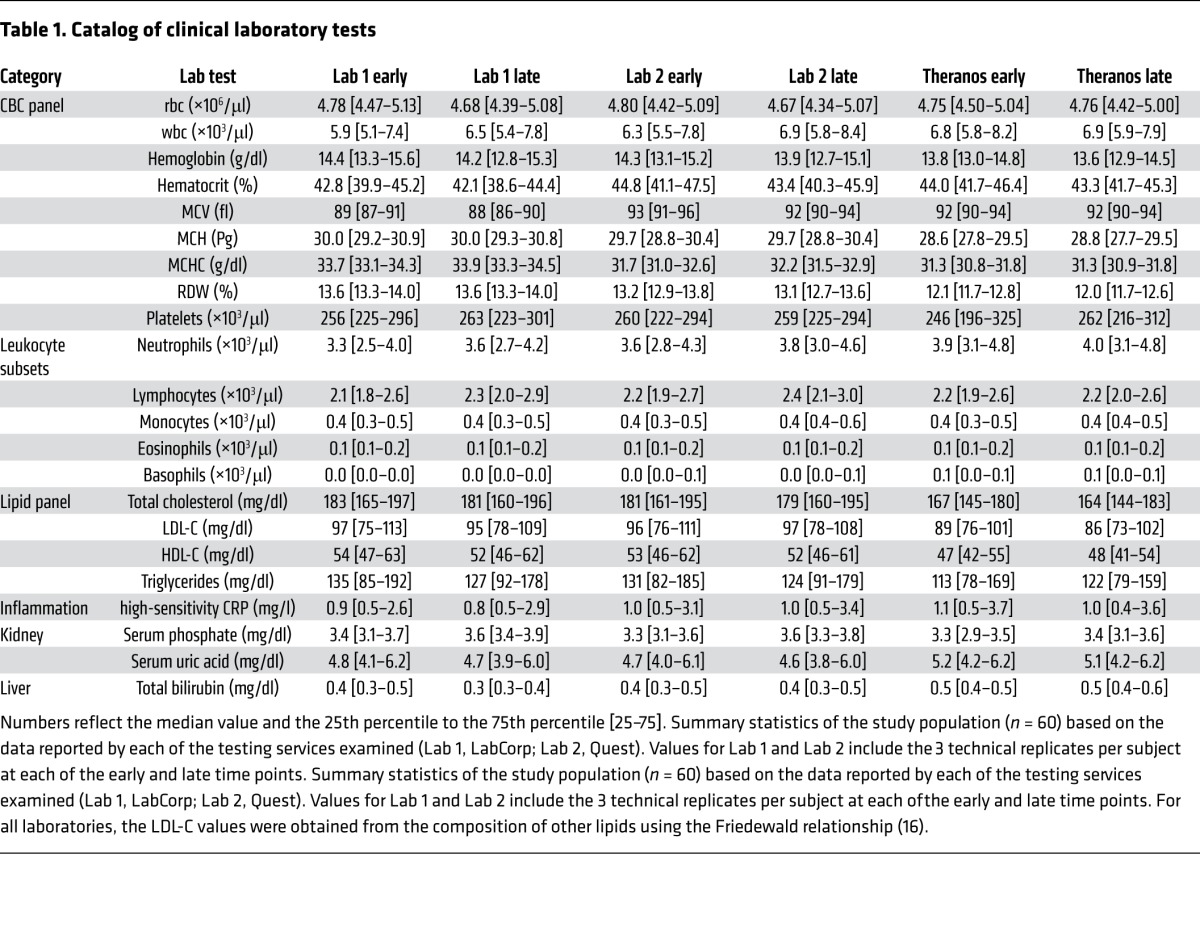
Figure 1. Study design and sample collection.
(A) STARD flow diagram of the cohort study. A total of 60 patients were enrolled and completed the study. For each patient, 4 separate blood draws were collected within a 6.5-hour window in a single day (mean ±SD, 3 ± 1 hour). Collections at t1 and t4 were split into 6 tubes to evaluate technical variability from 2 major clinical testing services (Lab 1, LabCorp; Lab 2, Quest Diagnostics). Theranos samples were collected from 2 separate retail locations at t2 and t3. (B) Panel of histograms showing the time between blood collections for the (top) first set of finger prick and venipuncture draws (t2–t1), (middle) Theranos samples (t3–t2), and (bottom) overall study (t4–t1).
Theranos reports more measures outside their normal range.
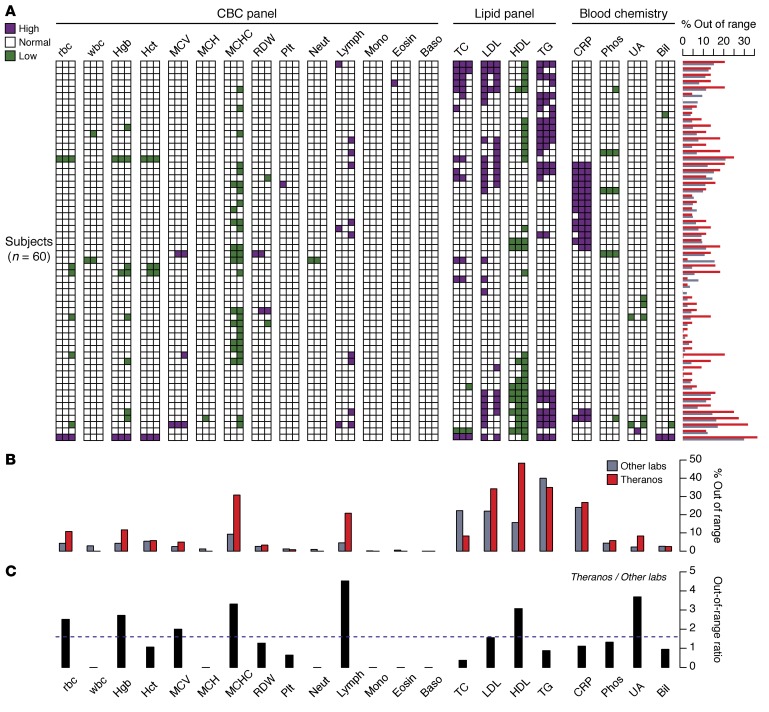
We assessed reporting of lab test results based on collection technologies and processes that were in service in July of 2015. In accordance with clinical testing guidelines, each service provided test-specific reference ranges that reflect normal ranges based on the analytical instrument used and calibration samples evaluated. The percentages for measurements outside their normal range were 8.3%, 7.5%, and 12.2% for LabCorp, Quest, and Theranos, respectively (Figure 2A). Although LabCorp and Quest showed no significant difference in the rates of their tests outside the reference range, the odds that Theranos reported a measurement outside its normal range compared with the other services was 1.6 (95% CI, 1.4–1.8, P = 3.1 × 10⁻¹⁹).
Figure 2. Lab test values reported outside of their reference range.
(A) Panel of test results displayed as a 2-dimensional heatmap. Each row represents one of the 60 subjects, and the columns aggregate the multiple measurements collected for each subject and testing service (6 measurement for Labs 1 and 2; 2 measurements for Theranos) (Lab 1, LabCorp; Lab 2, Quest Diagnostics). The column for each lab test is ordered from left to right by LabCorp, Quest, and Theranos. Colored squares indicate if at least one measurement is outside the normal range high (purple) or low (green). The horizontal bar chart alongside the rows of the heatmap reflects the percent of measurements outside the normal range at the individual level. All percentages represent 100× the number of measurements outside the normal range divided by the total number of measurements collected. (B) Comparison between percentage of tests outside the normal range across all subjects and multiple measurements for Theranos and the other labs (average of LabCorp and Quest). (C) Ratio of the tests outside their normal range — Theranos versus the mean value of LabCorp and Quest. Dashed horizontal line reflects a ratio of 1.6, which is the odds ratio for out-of-range tests between Theranos and the other labs. LDL ranges evaluated using normal LDL-C ranges and individual LDL-C measures reported directly by each provider. All comparisons made using reference ranges provided by individual testing services. Directly measured LDL values were used for Theranos.
To understand the out-of-range values across lab tests and at the individual level, we compared the percentage of tests that were outside their normal range for all testing services (Figure 2, A and B). The percentages represent 100× the number of measurements outside the normal range divided by the total number of measurements collected by each service. At the individual level, the Theranos rates were highest in 48 of 60 subjects. We found the Theranos rates exceeded the other services in this study for 12 tests (Figure 2B). Specifically, the results for mean corpuscular hemoglobin concentration (MCHC), lymphocytes, and cholesterol components exceeded the expected out-of-range rates based on standard procedures to calibrate test reference ranges (Figure 2B). Moreover, for these select tests, the ratio of out-of-range rates between Theranos and the other labs ranged from 1.6 (low-density lipoprotein cholesterol [LDL-C]) to 4.5 (lymphocyte counts) (Figure 2C).
Testing services show nonequivalent test results.
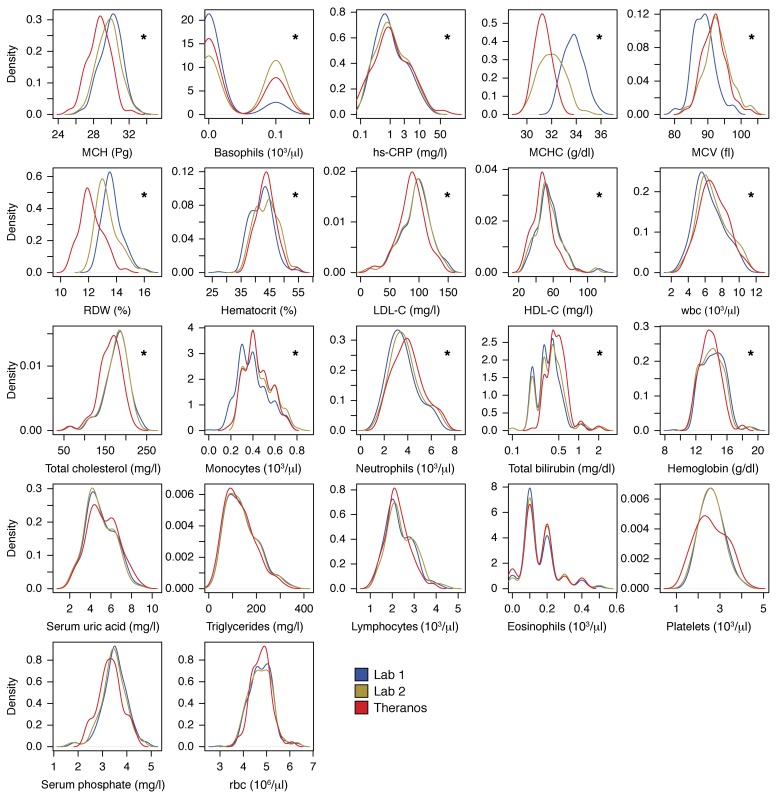
To understand transferability of test results among services, we examined test result equivalency among different blood testing services and collection technologies. We fit a linear mixed model (LMM) to the lab results to identify differences in the reported results that could be attributed to services only. When we controlled for age, sex, subject variability, and collection time, we found 15 of the 22 measurements showed significant interservice differences (P < 0.002, Figure 3). Our results showed that standard clinical services and low-volume blood tests have some measures that agree (e.g., triglycerides and rbc counts), whereas others differ significantly (e.g., wbc counts, mean corpuscular volume [MCV], cholesterol, high-density lipoprotein cholesterol [HDL-C]), where such differences could not be explained by differences in collection times or intrasubject variability at a given collection time.
Figure 3. Comparison of study population distributions among testing services.
Small multiple graphs show the test-specific distributions over the entire cohort of 60 subjects for Lab 1 (LabCorp, blue), Lab 2 (Quest, yellow), and Theranos (red) testing services. Distributions based on Gaussian kernel density estimates (21). Asterisks highlight lab tests with a significant difference among testing services using a LMM for each test, while including age, sex, subjects, collection times, and testing service as covariates. To control the type I error, a Bonferroni correction was applied among all lab tests (*P < 0.002).
In order to test the sensitivity of our findings to the normality assumptions, we repeated the analysis of the LMM with a nonparametric approach. The values of each lab test across all samples were quantile-normalized to provide rank-ordered data. The LMM analysis was repeated on the transformed data, and the results of the nonparametric analysis supported our original conclusions. To test the assumption that each lab test result followed a normal distribution, we applied the Shapiro-Wilk normality test and found that 18 of 22 lab tests did not violate the assumption of a normal distribution. The 4 exceptions were monocyte, eosinophil, and basophil counts, as well as total bilirubin. In each of the 4 exceptions, we applied the nonparametric, 2-sided Kolmogorov-Smirnov test to compare the distributions and found differences among the services for monocytes, basophils, and total bilirubin (P < 0.002), whereas no differences were observed for eosinophil counts. These results are consistent with what we observed with the LMM and analysis of the transformed data.
Assessment of the CBC panel found interservice differences in 10 of the 14 measurements. LabCorp reported consistently lower values for wbc and hematocrit (HCT), whereas Theranos reported consistently higher counts for neutrophils and monocytes. rbc characteristics of MCHC and rbc width (RDW) differed among all 3 testing services. Of note, Theranos reported increased precision for leukocyte subsets (neutrophils, lymphocytes, monocytes, basophils, and eosinophils), although this additional precision is unlikely to alter clinical decisions.
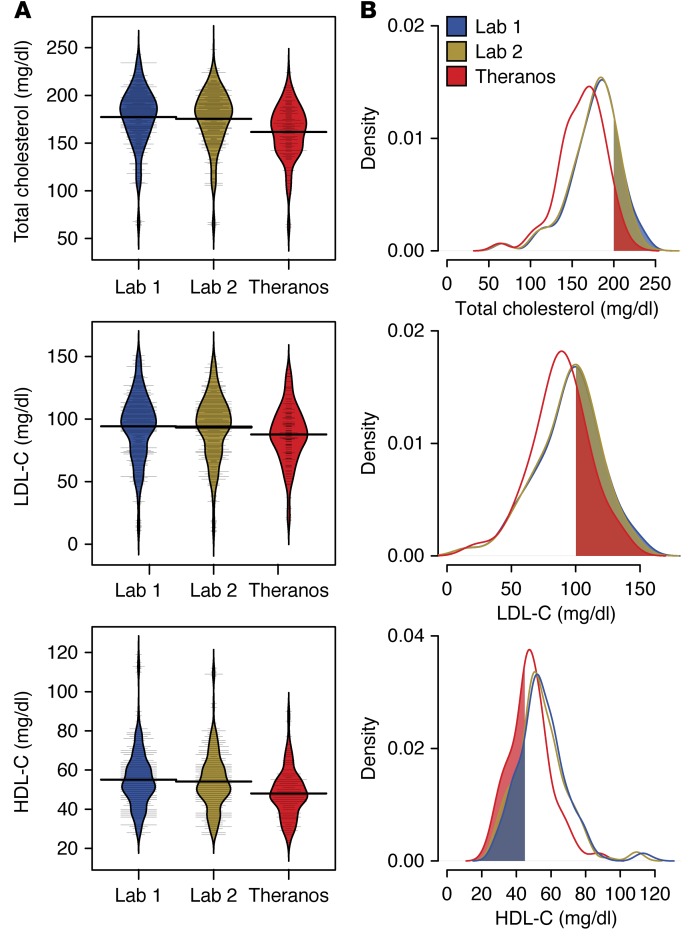
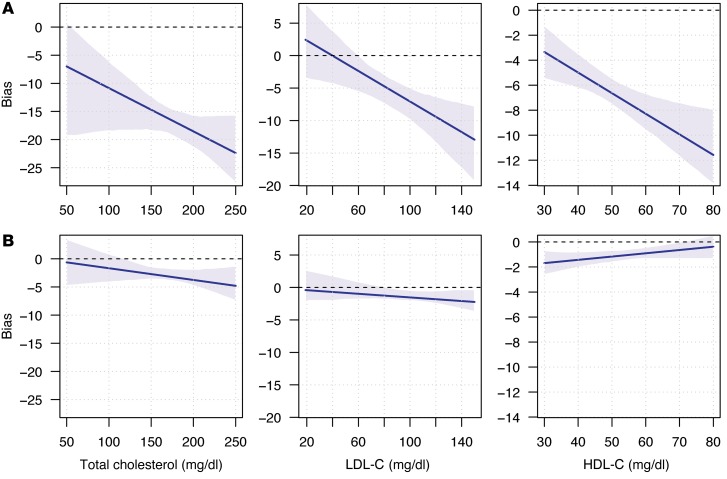
Examination of the lipid panel showed nonequivalent lab results for total cholesterol, HDL-C, and LDL-C (Figure 4, A and B). To test for possible bias among testing services, we applied a Passing and Bablok regression to compare cholesterol and lipoprotein (LDL and HDL) results between Theranos and the 2 other reference laboratories. Theranos reported systematic biases toward lower test values for all 3 cholesterol components (Figure 5A). No significant differences were observed between the reference services (Figure 5B). Based on our data, total cholesterol values at 200 mg/dl showed a bias within 1.9% (95% CI, 0.8–2.4) between the 2 reference laboratories. In contrast, comparison between Theranos and the reference laboratories showed a 9.3% negative bias (95% CI, 7.9–10.7), which would exceed the CLIA TEa budget of ±10% once instrument imprecision is considered. Although TEa for HDL-C and LDL-C are not as stringent as total cholesterol, substantial negative biases exist for LDL-C (7.1% at 100 mg/dl; 95% CI, 4.9–9.9) and HDL-C (12.9% at 45 mg/dl; 95% CI, 10.0–14.9) between Theranos and the methodologies used by the other services. Although CLIA standards don’t control for bias between services, these differences highlight that greater transparency is needed for how Theranos calibrates its tests to interpret the lipid panel results properly.
Figure 4. Comparison of cholesterol labs among testing services.
(A) Study population (n = 60) distributions for total cholesterol and lipoprotein components (LDL-C and HDL-C) for each of the testing services. Bean plots show the density estimates for each distribution. Thin horizontal lines represent individual values, and the thick horizontal lines reflect the mean of the population for a given testing service. (B) Kernel density estimates of the distributions for total cholesterol and lipoprotein measurements. Shaded regions indicate test result thresholds based on national lipid association guidelines: total cholesterol > 200 mg/dl, LDL-C > 100 mg/dl, and HDL-C < 45 mg/dl (22).
Figure 5. Estimation of laboratory test bias for cholesterol measurements.
Bias estimated calculated using the Passing-Bablok regression (17). Blue line represents the bias across a range of values, and the shaded regions depict the 95% CI. Comparisons show the bias between 2 services. (A) Bias between Theranos low-volume results when LabCorp is the reference. (B) Bias between LabCorp and Quest.
Intersubject and interservice variability dominate lab test results.
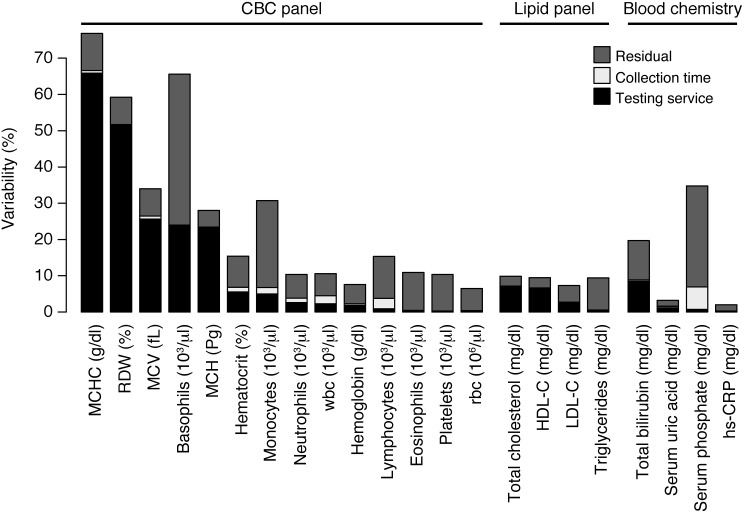
This study of lab tests collected from healthy adults found an unexpected degree of variability within and among testing services. Our study design allowed us to determine the magnitude and sources of variation in our cohort. Specifically, we examined 4 sources of variability that are primary factors for medical decisions: subject, testing service, collection time, and technical reproducibility. Although individuals constitute the largest source of variability, testing services also markedly influence lab results (Figure 6). Five lab tests showed substantial interservice variability (≥19% of the observed variance), and we found the interlab variance was greater than the intersubject variance for RDW and MCHC (52% and 95% CI, 49%–54%; 66% and 95% CI, 64%–69%, of the overall variance, respectively). Tests with large interservice variability were surprising, given that the blood collection times were exactly matched for LabCorp and Quest and closely matched for Theranos (i.e., finger prick occurred within 90 minutes of venipuncture for 90% of subjects).
Figure 6. Sources of lab test variability.
Percent of the variability explained by each component of the LMM (testing service, subject, blood collection time, and “other”, i.e., residuals, unexplained by other covariates). Subject variability — not shown explicitly — makes up the remaining difference from 100% (e.g., MCHC = 23%, hs-CRP = 98%). The interservice variability can also be interpreted in terms of the intraclass correlation. For example, consider the lab test for MCHC. Variation across testing service explains 65% of the overall observed variance. This result is equivalent to saying that, after correcting for the effects of subject and collection time, the correlation between samples from different services is 65%.
Despite controlling eating and physical activity of subjects, we found systematic differences between measurements collected at early versus late time points — 1 and 2 versus 3 and 4 — in 13 of the 22 lab tests (P < 0.002). Serum phosphorus levels, wbc counts, and counts of leukocyte subsets were significantly higher in the late collection, whereas serum uric acid levels, total cholesterol, HDL-C, bilirubin levels, rbc counts, and rbc characteristics (e.g., hemoglobin [Hgb], hematocrit [Hct], and RDW) were higher at early collection times. To determine the relationship between service and time on the reported test results, we examined both factors independently, as well as their interaction. We found no significant association with the interaction term in all of the lab tests except for 2 — MCV and MCHC. Together, these results show that both service and collection time are associated with test results; however, their influence is largely independent.
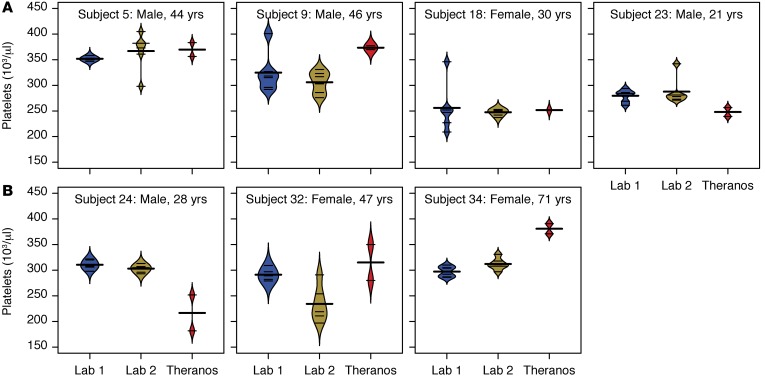
Labs obtained using different collection methods are not equivalent for lipids (total cholesterol, LDL-C, and HDL-C) and rbc characteristics (RDW, MCV, and MCH). Given the large amount of variability, a single measurement can be misleading. Additionally, nonequivalence between testing services raises concerns about what might be biological changes that are clinically meaningful versus methodological differences that haven’t been standardized. For example, the large intra- and interservice variability in specific lab tests (e.g., platelets) may have clinical implications for individual treatment decisions (Figure 7).
Figure 7. Variability in platelet counts.
Bean plots show the distribution across multiple measurements for each of the services (6 for Labs 1 and 2 versus 2 for Theranos) (Lab 1, LabCorp; Lab 2, Quest Diagnostics). Thin horizontal lines represent values from each sample for an individual, and the thick horizontal lines reflect the mean platelet count for a given testing service. (A) Subjects with large intraservice variability in platelet counts. (B) Subjects with large interservice variability in platelet counts.
Discussion
In this study, we examined test result equivalency among different blood testing services and technologies. Our results showed that standard clinical services via venipuncture and blood tests collected from low-volume samples have some measures that agree (e.g., triglycerides and rbc counts), whereas others differ significantly (e.g., wbc counts, MCV, cholesterol, and HDL-C). Nonequivalence between testing services raises concerns about what results signify biological changes that are clinically meaningful versus results that are driven by methodological or technical differences that haven’t been standardized or validated.
Our study of lab tests collected from healthy adults found an unexpected degree of variability within and among testing services. The study design permitted proper apportioning of the sources of this variability to major factors including age, sex, subject, collection, time, and testing service. Although individuals constitute the largest source of variability, testing technologies also substantially influence lab results. Labs obtained using different technologies are not equivalent for lipids (total cholesterol, LDL-C, and HDL-C) and rbc characteristics (RDW, MCV, and MCH).
Some tests were equivalent among services, yet they showed systematic bias affected by collection times. In particular, serum phosphorus and uric acid levels exhibited different results depending on whether they were collected in the first and second or third and fourth time points. It is possible that physiology being quantified by these tests may be more dynamic than is appreciated in the clinical interpretation of their results. Although a wealth of clinical laboratory testing data exists (10–12), the circadian or physiological periodicity of many common laboratory blood tests may need additional evaluation.
The interservice disparities observed in our study have relevance for clinical decisions. Certain lipid profiles are associated with increased risk of cardiovascular disease (CVD), and we observed systematic biases in cholesterol, LDL-C, and HDL-C values reported by Theranos. According to 2013 ACC/AHA guidelines, among those aged 40–75 years without clinically evident CVD, a moderate intensity statin should be initiated in patients with LDL-C > 70 mg/dl and either diabetes or ≥7.5% risk of having an atherosclerotic cardiovascular disease event within the next 10 years (13). With intraindividual variations in LDL levels exceeding 20 mg/dl in several otherwise healthy subjects, a strong possibility remains that practitioners either inappropriately initiate or fail to appropriately initiate statin therapy due to interservice variation. According to ATP-III guidelines established by a National Cholesterol Education Program (NCEP) expert panel (14), HDL-C < 40 mg/dl is considered a major risk factor that modifies LDL-C treatment goals, and HDL-C ≥ 60 mg/dl is considered a protective attribute that negates other risk factors. In our study, 5% of subjects had intraindividual variations in HDL-C levels > 10 mg/dl, indicating testing variation is sufficient to alter an individual’s clinical risk assessment.
The clinical practice guidelines listed above are based on accurate and precise assessments of total cholesterol, triglycerides, and HDL-C. To ensure this is the case, an expert laboratory panel — also established by the NCEP — developed guidelines for analytical method requisites for clinical assay precision and bias for these measurements (15). In an effort to minimize systematic bias between the methods, most clinical laboratory assays in use today are standardized against reference materials. The Theranos technology is unknown and, based on our data, does not fit the current regulatory guidelines as highlighted by the systematic biases in tests of total cholesterol, HDL-C, and LDL-C. Additional assessments of the lipid panel tests from Theranos will be critical for interpreting results in the context of offering point-of-care testing at retail outlets, as well as for applying these results to the multivariable risk models of disease.
The lack of technical replicates in the Theranos data is a notable limitation in our assessment of variability. Given the large intraindividual variability for lab tests from standard clinical services, understanding the variability in low-volume testing is critical for helping physicians and patients interpret test results. Another limitation of our study is that, although blood samples were collected into Nanotainer tubes via finger prick, samples were shipped from the retail locations to a central facility in California. The technical details of the analytical instruments used for the lab tests were unavailable at the time of the study and remained uncertain since its completion, which means that the differences we found could arise from multiple sources: collection (low-volume finger prick versus venipuncture), processing (how the samples were prepped by the laboratory technicians), instrumentation (new versus existing technology), or some combination of these factors. One limitation of an observational study is that, although we created a study design to control for many of these uncertainties, we were unable to manipulate the collection variables to determine their precision contribution.
This study focused on lab tests collected from stable outpatients with the expectation that most of the reported results would fall inside their normal range. Indeed, more than 92% of collective measurements reported from LabCorp and Quest, and greater than 87% of the measurements returned from Theranos, were within normal ranges. Generally, test results that were outside their normal range were consistent for each individual among all services, with the major exceptions being lymphocytes and components of the lipid panel. Additionally, the percentage of lab tests outside the normal range varied in a test-specific manner from 0%–40% (basophils to triglycerides, respectively). Furthermore, we found higher odds for Theranos to report tests outside of the normal range versus the other services (odds ratio = 1.6). This increase in abnormal test results can have negative consequences for medicine in the form of extra testing, additional patient visits to clinics/hospitals, and added doctor services, all of which result in additional costs and burdens to patients or to the healthcare system and are potentially harmful, if the abnormal tests were misdiagnoses (i.e., false positives).
Given the large amount of variability, a single measurement from a lab test can be misleading. Single-measurement variability can be addressed by collecting more data on individuals to establish better estimates of true baseline values and to understand what excursions suggest changes in health status that may require adjustments. Low-volume testing offers substantially lower testing costs (~5-fold less, on average) and is attractive for obtaining more data to characterize dynamic/circadian variability of tests, as well as to quantify normal versus abnormal variability in individuals. Better understanding of individual and population variability in blood measures will be required to implement paradigms of precision medicine. Innovation in blood testing technologies can play an important role in shifting this paradigm, as long as these innovations provide accurate and reliable results.
Methods
Study design.
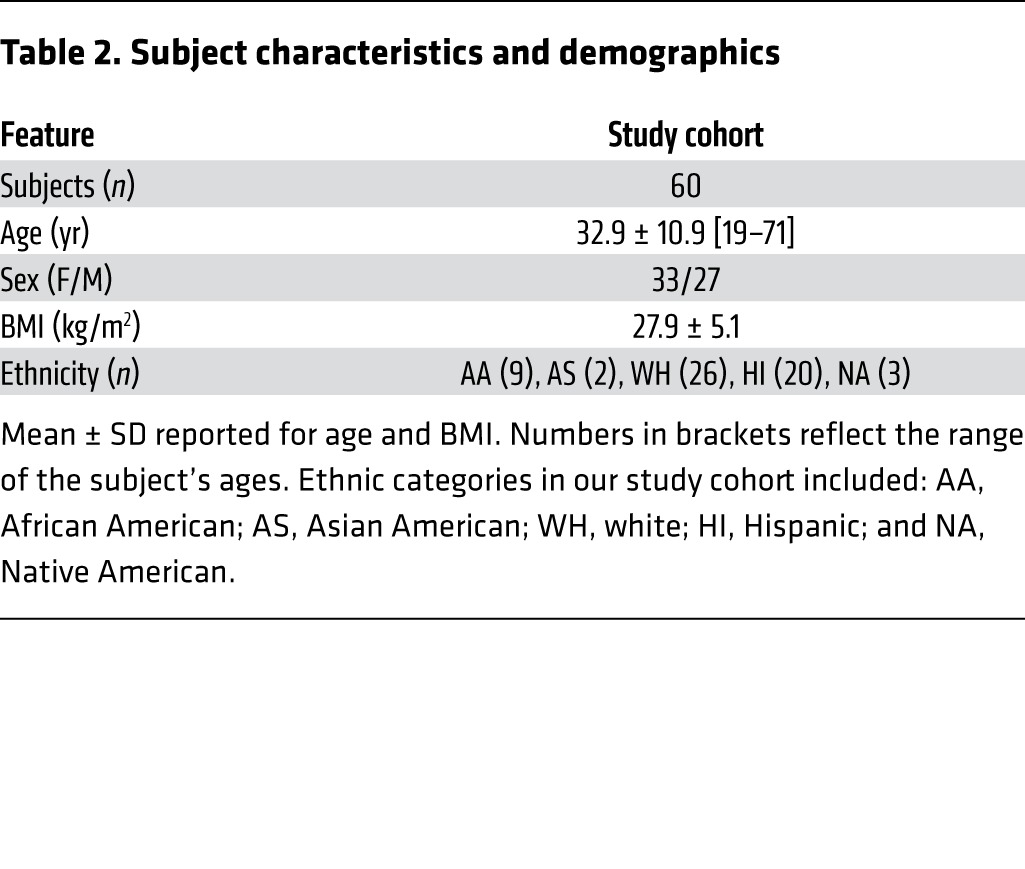
Sixty healthy adults 19–71 years of age (Table 2) provided voluntary informed consent for a cohort study to examine laboratory test variability among 3 testing service companies. All participants were recruited from the metropolitan area of Phoenix, Arizona. For each subject, we obtained both biological and technical replicates to ascertain the sources of variability observed. To control behaviors that might influence blood chemistry and hematology levels among collections, all participants fasted and refrained from drinking fruit juice or soda, and they avoided exercise during the study. Subjects were excluded if they were pregnant, weighed less than 57 kilograms, had a history of substance abuse, or had any condition the investigators thought might put the subject at risk.
Table 2. Subject characteristics and demographics.
Blood collection and processing.
Peripheral blood samples were collected from each subject at 4 separate time points within a 6.5-hour window (3 ± 1 hour). A total of 14 samples were obtained per subject. Samples were divided into technical and biological replicates to control for potential sources of variation from the collection method (venipuncture versus finger prick) and testing service (Figure 1). All venipuncture blood draws were collected and processed by HRI from their ambulatory clinics. Draws of 60 ml were split into 6 sets of tubes for blood chemistry and hematology tests within 51 minutes (32 ± 5 minutes), and samples were shipped to testing facilities within 9.5 hours of processing (4.6 ± 2.2 hours). Test facilities for LabCorp and Quest were located in Phoenix and Tempe, Arizona, respectively. Finger prick blood draws were obtained from 2 separate retail outlets in Phoenix, which were collected and processed on site by a laboratory employee before shipping the blood to a central Theranos facility in Newark, California, USA, for testing.
Clinical laboratory tests.
In total, 22 clinical lab tests were carried out on each subject (Table 1). Tests were selected from chemistry (lipid profile, an inflammatory marker, total bilirubin, serum uric acid, and serum phosphorus) and hematology (complete blood count [CBC]) with leukocyte subsets calculated by automatic differential gating. All tests conducted in this study are categorized as moderate complexity by the regulatory standards outlined in CLIA (7).
The LabCorp and Quest facilities that tested the blood samples are CLIA accredited. LabCorp tests were completed at Accupath Diagnostics Laboratory in Phoenix. Quest lab tests were conducted at Sonora Quest Laboratories in Tempe, Arizona, with the exception of the lipid panel tests, which were carried out at Quest Diagnostics Nichols Institute in San Juan Capistrano, California, USA.
Quality control.
To detect potential data entry errors, we carried out 3 quality control and assurance measures. First, we applied electronic and manual quality assurance to identify and confirm outliers. Second, HRI independently confirmed and validated a subset of the data. Third, manual monitoring of the clinical database against protected health information redacted laboratory source identified 12 data entry errors out of the 2,772 entries, suggesting a data entry error rate of 0.43%.
Data processing.
All data were harmonized into standard units and codes for easy comparison among testing services. Data were excluded based on technical issues such as insufficient sample, inability to calculate value, requirement for redraw, or inability to apply automated differential gating. Censored data entries were set to the lowest detectable numeric value reported by the lab test (total of 79 measurements, which is 0.4% of the 18,480 possible entries in our data set). Total bilirubin values below the limit of detection were fit with a regression model that utilized the direct bilirubin values. Both high-sensitivity C-reactive protein (hs-CRP) and total bilirubin values were log10-transformed prior to analysis. BMI was calculated as weight in kilograms divided by height in meters squared. Theranos measured direct LDL-C, whereas both LabCorp and Quest reported calculated LDL-C. For all interservice comparisons, we used calculated LDL-C values for Theranos. Calculated LDL-C values were obtained from the composition of other lipids using the Friedewald relationship (16). For the summary of lab test values reported outside of their reference range given in Figure 2, the normal range and whether a test value was considered out of range were determined by the laboratory associated with the test result. In this case, the Theranos LDL-C values and whether those values were out of range were determined by Theranos using the measured LDL-C values.
Statistics.
All data were analyzed and visualized using the R statistical package (version 3.2.1) (17). All hypothesis tests were 2-tailed unless otherwise specified. To quantify the odds of rejecting samples or reporting test results outside of the normal range, we computed the odds ratio for these events among testing services. Odds ratio calculations were conducted using Fisher’s exact test, and hypergeometric distribution was used to estimate the P values. Odds ratio calculations were combined using inverse variance weighting to derive on overall effect size and P value. To assess systematic bias and evaluate TEa scores between services, we applied a Passing-Bablok regression (18). In order to identify the sources of variability and determine what factors influenced lab test results, we applied an LMM using the lme4 R package (19). The LMM partitioned the overall variation in tests into variation attributable to differences across age, sex, testing services, subjects, and collection times, plus residual variation. These components of variation were modeled as random effects in order to estimate the percentage of total variance attributable to each component. The percent variation explained by each component was calculated as the variance attributable to that component divided by the total variance. For each variance component, we tested the hypothesis that the variance attributable to that component was significantly greater than zero. The hypothesis tests were applied on a LMM where the component of interest was modeled as a fixed effect, while the other 2 components were modeled as random effects. Finite-sample P values for this fixed effect were computed using the Kenward-Roger approximation (20). In addition to the variables considered in the LMM described above, we also examined the interaction between testing service and collection times. To test the sensitivity of our findings to assumptions of normality, we transformed the lab test results into rank-ordered data using quantile normalization and repeated the LMM analysis on the transformed data. To test the assumption that each lab test result followed a normal distribution, we applied the Shapiro-Wilk normality test. If a lab test violated the normality assumption, we applied the nonparametric, 2-sided Kolmogorov-Smirnov test to compare the distributions among services. To understand the variability in the bias and variance partition calculations, we applied a bootstrap sampling approach to calculate the 95% CIs. In this study, we evaluated 22 separate lab tests for each of the services. To control the type I error when testing these separate hypotheses, the Bonferroni correction was applied such that a P value less than 2.3 × 10⁻³ was considered significant.
Study approval.
The study protocol was approved by the IRB at Icahn School of Medicine at Mount Sinai and by Quorum Central IRB for HRI. The study was conducted in compliance with the Declaration of Helsinki, Good Clinical Practice guidelines, and local regulatory requirements.
Author contributions
BAK, PKG, GBS, EES, and JTD conceived and designed the study. BAK, GH, NZ, and LL conducted the data analyses. PKG, GJB, and MWD implemented and coordinated the study. NB, JWM, and SP assisted with interpretation of clinical lab tests. BAK, JTD, and EES wrote the manuscript with review and feedback from JWM, GBS, and PKG.
Supplementary Material
Acknowledgments
We thank the patients who participated in this study and the health care staff associated with HRI who cared for the patients. HRI conducted all clinical research activities for the duration of the study July 27, 2015, to July 31, 2015. This work was supported by the Icahn Institute for Genomics and Multiscale Biology, a gift from the Harris Family Charitable Foundation (to J.T. Dudley), and grants from the NIH (R01 DK098242 and U54 CA189201, to J.T. Dudley, and R01 AG046170 and U01 AI111598, to E.E. Schadt).
Footnotes
Conflict of interest: J.T. Dudley owns equity in NuMedii Inc. and has received consulting fees or honoraria from Janssen Pharmaceuticals, GlaxoSmithKline, AstraZeneca, and LAM Therapeutics.
Role of funding source: Study funding provided by the Icahn Institute for Genomics and Multiscale Biology and the Harris Center for Precision Wellness at the Icahn School of Medicine at Mount Sinai. Salaries of B.A. Kidd, J.T. Dudley, and E.E. Schadt were supported by the grants. The sponsors had no roles in study design, data collection, or data analysis.
Reference information:J Clin Invest. 2016;126(5):1734–1744. doi:10.1172/JCI86318.
Contributor Information
Gabriel Hoffman, Email: gabriel.hoffman@mssm.edu.
Noah Zimmerman, Email: nzimmerman@gmail.com.
Li Li, Email: li.li@mssm.edu.
Samir Parekh, Email: samir.parekh@mssm.edu.
Nikolina Babic, Email: nikolina.babic@mssm.edu.
References
- 1.Price CP. Roots, development and future directions of laboratory medicine. Clin Chem Lab Med. 2010;48(7):903–909. doi: 10.1515/CCLM.2010.185. [DOI] [PubMed] [Google Scholar]
- 2.Horvath AR. From evidence to best practice in laboratory medicine. Clin Biochem Rev. 2013;34(2):47–60. [PMC free article] [PubMed] [Google Scholar]
- 3.Carere DA, Kraft P, Kaphingst KA, Roberts JS, Green RC. Consumers report lower confidence in their genetics knowledge following direct-to-consumer personal genomic testing. Genet Med. 2016;18(1):65–72. doi: 10.1038/gim.2015.34. [DOI] [PMC free article] [PubMed] [Google Scholar]
- 4.Bloss CS, Schork NJ, Topol EJ. Effect of direct-to-consumer genomewide profiling to assess disease risk. N Engl J Med. 2011;364(6):524–534. doi: 10.1056/NEJMoa1011893. [DOI] [PMC free article] [PubMed] [Google Scholar]
- 5.Centers for Medicare & Medicaid Services (CMS), HHS ; Centers for Disease Control Prevention (CDC), HHS ; Office for Civil Rights (OCR), HHS CLIA program HIPAA privacy rule; patients’ access to test reports. Fed Regist. 2014;79(25):7289–7316. [PubMed] [Google Scholar]
- 6. Clinical Laboratory Improvement Amendments of 1988, Public Law 100–578, 100th Congress (1988) [Google Scholar]
- 7.[No authors listed] Medicare, Medicaid and CLIA programs; regulations implementing the Clinical Laboratory Improvement Amendments of 1988 (CLIA) — HCFA. Final rule with comment period. Fed Regist. 1992;57(40):7002–7186. [PubMed] [Google Scholar]
- 8.Theranos Lab Test Menu. [March 1, 2016];Theranos Lab Web site. http://www.theranos.com/test-menu
- 9.Ioannidis JP. Stealth research: is biomedical innovation happening outside the peer-reviewed literature? JAMA. 2015;313(7):663–664. doi: 10.1001/jama.2014.17662. [DOI] [PubMed] [Google Scholar]
- 10.Rivera-Coll A, Fuentes-Arderiu X, Diez-Noguera A. Circadian rhythmic variations in serum concentrations of clinically important lipids. Clin Chem. 1994;40(8):1549–1553. [PubMed] [Google Scholar]
- 11.Rivera-Coll A, Fuentes-Arderiu X, Diez-Noguera A. Circadian rhythms of serum concentrations of 12 enzymes of clinical interest. Chronobiol Int. 1993;10(3):190–200. doi: 10.3109/07420529309073887. [DOI] [PubMed] [Google Scholar]
- 12.Kanabrocki EL, et al. Reference values for circadian rhythms of 98 variables in clinically healthy men in the fifth decade of life. Chronobiol Int. 1990;7(5–6):445–461. doi: 10.3109/07420529009059156. [DOI] [PubMed] [Google Scholar]
- 13.Stone NJ, et al. 2013 ACC/AHA guideline on the treatment of blood cholesterol to reduce atherosclerotic cardiovascular risk in adults: a report of the American College of Cardiology/American Heart Association Task Force on Practice Guidelines. J Am Coll Cardiol. 2014;63(25 pt B):2889–2934. doi: 10.1016/j.jacc.2013.11.002. [DOI] [PubMed] [Google Scholar]
- 14.National Cholesterol Education Program Expert Panel on Detection E, Treatment of High Blood Cholesterol in A. Third Report of the National Cholesterol Education Program (NCEP) Expert Panel on Detection, Evaluation, and Treatment of High Blood Cholesterol in Adults (Adult Treatment Panel III) final report. Circulation. 2002;106(25):3143–3421. [PubMed] [Google Scholar]
- 15.Myers GL, Kimberly MM, Waymack PP, Smith SJ, Cooper GR, Sampson EJ. A reference method laboratory network for cholesterol: a model for standardization and improvement of clinical laboratory measurements. Clin Chem. 2000;46(11):1762–1772. [PubMed] [Google Scholar]
- 16.Friedewald WT, Levy RI, Fredrickson DS. Estimation of the concentration of low-density lipoprotein cholesterol in plasma, without use of the preparative ultracentrifuge. Clin Chem. 1972;18(6):499–502. [PubMed] [Google Scholar]
- 17.R Development Core Team. R: A Language and Environment for Statistical Computing. Vienna, Austria: the R Foundation for Statistical Computing. Available at: http://www.R-project.org/
- 18.Passing H. A new biometrical procedure for testing the equality of measurements from two different analytical methods. J Clin Chem Clin Biochem. 1983;21(11):709–720. doi: 10.1515/cclm.1983.21.11.709. [DOI] [PubMed] [Google Scholar]
- 19.Bates D, Mächler M, Bolker B, Walker S. Fitting Linear mixed-effects models using lme4. J Stat Softw. 2015;67(1):1–48. [Google Scholar]
- 20.Halekoh U, Højsgaard S. A Kenward-Roger approximation and parametric bootstrap methods for tests in linear mixed models The R Package pbkrtest. J Stat Softw. 2014;59(9): [Google Scholar]
- 21.Sheather S, Jones M. A reliable data-based bandwidth selection method for kernel density estimation. J R Stat Soc Series B Stat Methodol. 1991;53:683–690. [Google Scholar]
- 22.Jacobson TA, et al. National Lipid Association recommendations for patient-centered management of dyslipidemia: part 1 — executive summary. J Clin Lipidol. 2014;8(5):473–488. doi: 10.1016/j.jacl.2014.07.007. [DOI] [PubMed] [Google Scholar]
Associated Data
This section collects any data citations, data availability statements, or supplementary materials included in this article.


