

Abstract
Previous studies have yielded evidence for cognitive processing abnormalities and alterations of autonomic functioning in depersonalization‐derealization disorder (DPRD). However, multimodal neuroimaging and psychophysiology studies have not yet been conducted to test for functional and effective connectivity under cognitive stress in patients with DPRD. DPRD and non‐referred control subjects underwent a combined Stroop/negative priming task, and the neural correlates of Stroop interference effect, negative priming effect, error rates, cognitive load span and average amplitude of skin conductance responses were ascertained for both groups. Evoked haemodynamic responses for basic Stroop/negative priming activations were compared. For basic Stroop to neutral contrast, patients with DPRD differed in the location (inferior vs. superior lobule) of the parietal region involved, but showed similar activations in the left frontal region. In addition, patients with DPRD also co‐activated the dorsomedial prefrontal cortex (BA9) and posterior cingulate cortex (BA31), which were also found to be the main between‐group difference regions. These regions furthermore showed connectivity with frequency of depersonalization states. Evoked haemodynamic responses drawn from regions of interest indicated significant between‐group differences in 30–40% of time points. Brain‐behaviour correlations differed mainly in laterality, yet only slightly in regions. A reversal of autonomic patterning became evident in patients with DPRD for cognitive load spans, indicating less effective arousal suppression under cognitive stress – patients with DPRD showed positive associations of cognitive load with autonomic responses, whereas controls exhibit respective inverse association. Overall, the results of the present study show only minor executive cognitive peculiarities, but further support the notion of abnormalities in autonomic functioning in patients with DPRD.
Keywords: correlation image analysis, effective connectivity, electrodermal activity, evoked haemodynamic responses, functional magnetic resonance imaging, Stroop word–colour interference
Introduction
To maintain cognitive focus in concentration‐demanding tasks requires the ability to suppress perceptually competing influences or memory traces of preceding stimuli known as priming. Directing attention therefore requires the involvement of working memory, and the utilization of its specific capacities under cognitive load. Processing of memory content in priming also implies working memory being occupied. Classical research in information processing during problem solving in the context of goal attainment has revealed that short‐term memory acts in the service of executive control. If no previous schematic knowledge is available, perceived information is divided into amounts that fit into working memory capacity (Miller, 1956; Sweller, 1988). According to classical cognitive load theory, these amounts refer to short‐term memory and index individual differences in processing capacities. Higher cognitive loads cause psychophysiological stress, as attention requires cognitive selection, and this effort elicits autonomic arousal (Posner, 1975).
Depersonalization states are transient alienation symptoms frequently observed in prodromal stages of psychosis, posttraumatic stress, in personality, anxiety and depressive disorders, as well as in parts of the dissociative spectrum. Because abnormalities in memory functioning had been described, probing of attention and memory is of particular relevance also in persistent depersonalization‐derealization disorder (DPRD). Only few cognitive experiments have, however, been undertaken to examine the brain mechanisms underlying DPRD (Guralnik et al., 2000, 2007; Stein & Simeon, 2009). Specific abnormal relations of stress and depersonalization have been postulated (Stein & Simeon, 2009), and a ‘reversal of normal patterns of autonomic functioning’ was hypothesized by Phillips & Sierra (2003). The rationale for the present study was to elucidate possible attentional and mnestic alterations commonly implicated in the dissociative spectrum, as well as concurrent autonomic responding.
Recent meta‐analyses (Derrfuss et al., 2004, 2005; Neumann et al., 2005) have identified the mid‐dorsolateral prefrontal cortex and a posterior‐lateral prefrontal region at the intersection of Brodmann areas (BAs) 6, 8 and 9 as common brain regions involved in Stroop and other task‐switching experiments. This region, termed the inferior frontal junction, has been characterized to be cytoarchitectonically different from premotor, prefrontal and eye‐field regions (Brass et al., 2005; Amiez & Petrides, 2009; Derrfuss et al., 2012). Its functional connectivity network encompasses regions in ventrolateral and dorsolateral prefrontal as well as medial parietal regions (Sundermann & Pfleiderer, 2012). For the negative priming effect (NPE), Steel et al. (2001) demonstrated superior to inferior parietal (BAs 5,7, 40), superior, middle and inferior frontal (BAs 6, 8, 9, 45, 46), as well as occipital activations. To the authors’ knowledge, cognitive load had never previously been investigated in neuroimaging studies.
In the present study, multimodal neuroimaging of patients with DPRD and healthy controls was conducted by performing a combined negative priming and Stroop paradigm (negative priming Stroop) in two experimental conditions with known neural response properties, including derivation of sympathetic responses. A classical Stroop test without congruent condition was used, in order to avoid introducing a certain positive correlation into cognitive control processes (Dishon‐Berkovits & Algom, 2000). Previous behavioural experiments in DPRD (Guralnik et al., 2000) led to the assumption of no severe group differences in Stroop interference effect (SIE), NPE and cognitive load (hypothesis i). Regarding SIE, it was expected to find activation in the inferior frontal junction and parietal regions for normal controls (hypothesis ii). For the NPE, similar activations as described by Steel (see above) were expected, due to task similarity (hypothesis iii). For cognitive load, activations in regions where delay‐active neurons have been discovered were expected: prefrontal, posterior parietal and striatal structures (Fuster, 1973; Ashby et al., 2005; hypothesis iv). Following recent skin conductance findings on responses in cognitive tasks (Zhang et al., 2012), in which the supplementary motor area (SMA) regions were commonly found to be involved in several between‐condition contrasts, these same regions were expected to be the main brain‐behaviour correlation region in non‐referred control (NC) subjects (hypothesis v). For patients with DPRD, different brain‐behaviour correlation regions were expected, as it is well accepted that physiological stress impairs working memory performance (Arnsten, 1998, 2009) in the prefrontal cortex (hypothesis vi).
Materials and methods
Participants
Volunteers in the experiments were 12 healthy control subjects and nine patients with DPRD. The study was conducted in compliance with the Helsinki Declaration. All procedures had been endorsed by the local Research Ethics Sub‐Committee for the Institute of Psychiatry, Psychology & Neuroscience (RESC 141‐00). All participants signed informed consent and received monetary compensation for their time commitment. Primary‐diagnosis DPRD patients (mean age 36.11 ± 2.34 years; education level 2.22 ± 0.14 with 2 = junior college level; four females) from the Maudsley Hospital, London, UK, and NC subjects (mean age 27.25 ± 1.95 years; education level 2.58 ± 2.02; five females) participated in the experiments. At the time of investigation, patients were treated in a specialized clinic (ASD and MLP) for this diagnosis. All patients were co‐diagnosed with primary DPRD according to DSM‐5 criteria by a psychiatrist not involved in the study. Patients with DPRD were separately invited to participate in the study by the experimenter (EL), who was blind to all medical records. All patients exceeded the clinical cut‐off level of > 70 on the Cambridge Depersonalization Scale item version total scale discriminative for DPRD (Sierra & Berrios, 2000; 175.77 ± 12.31; Appendix S1).
Behavioural paradigm
Subjects completed an experiment combining classical Stroop (Stroop, 1935; Jensen & Rohwer, 1966; MacLeod, 1991) and negative priming (Dalrymple‐Alford & Budayer, 1966; Tipper, 1985; Tipper & Cranston, 1985; MacLeod & MacDonald, 2000) tasks in a two‐condition version: a neutral control condition; and a Stroop/negative priming active probe condition (Steel et al., 2001). Each condition consisted of five alternating blocks of eight trials each. To acquaint subjects with the task demand, the initial block had three additional training trials (so 11 trials in total), which were later discarded (for computation of the SIE, NPE and average response‐delay spans (ARDS) for cognitive load, see Appendix S1).
Psychophysiological recording
Electrodermal activity (EDA) measures were recorded online from within the MR scanner using the methodology described previously (Lemche et al., 2006). Applying threshold criteria of 0.01 μSiemens, EDA was analysed in whole epochs for each of the presentation blocks in each subject using the SC‐ANALYZE inhouse software (Centre for Neuroimaging Sciences, IOPPN, King's College London, UK). Following standard procedures, amplitude of skin conductance response (ASCR) was determined as the largest fluctuation (skin conductance response, SCR) of each epoch in μSiemens, and averaged for each condition and for each subject.
Functional magnetic resonance imaging (fMRI) data acquisition
Imaging data were acquired using a neurovascular 1.5T GE scanner (General Electric, Milwaukee, WI, USA). Both structural and functional scans were acquired during the same session. High‐resolution structural images (43 slices), providing whole brain coverage [thickness: 3 mm; inter‐slice gap: 0.3 mm; planes parallel to the intercommissural (AC‐PC) line], were acquired using an inversion‐recovery EPI (TE 73 ms; TI 180 ms; TR 12 s; in‐plane resolution 1.875 mm; matrix size 1282; flip angle 90°). Functional images, acquired with gradient EPI pulse sequence (T2*‐weighted), measured blood oxygen level‐dependent (BOLD) response. These consisted of 80 volumes of 16 near‐axial slices each (thickness: 7 mm; inter‐slice gap: 0.7 mm: TE 40 ms; TR 1600 ms; matrix size 642; flip angle 90°; in‐plane voxel size 3.75 mm2).
fMRI analysis
The software package XBAM version 4.1 (Centre for Neuroimaging Sciences, IOPPN at King's College London; www.brainmap.co.uk), was used to analyse the fMRI data. XBAM combines non‐parametric permutation‐based resampling methods with GLM statistics, goodness‐of‐fit ratios (SSQ), wavelet signal denoising methods, control of false‐positive voxels and clusters, and reports exact significances rather than results corrected for family‐wise error rates. Statistics and randomization procedures are described in the Appendix S1. All fRMI results are reported for ≤0.5 false‐positive rate.
Comparison of time series and evoked haemodynamic responses
Average BOLD signal time series were extracted from regions of interest (ROIs) based on group level and between‐group ancova images. An omnibus test for significance in overall differences implemented in XBAM 4.1 was used to compare randomized average time series at each time point using SSQs. Mean BOLD signal time series at each TR were used to plot evoked haemodynamic responses, enabling determination of group differences at each time point using confidence intervals (Fig. 1).
Figure 1.
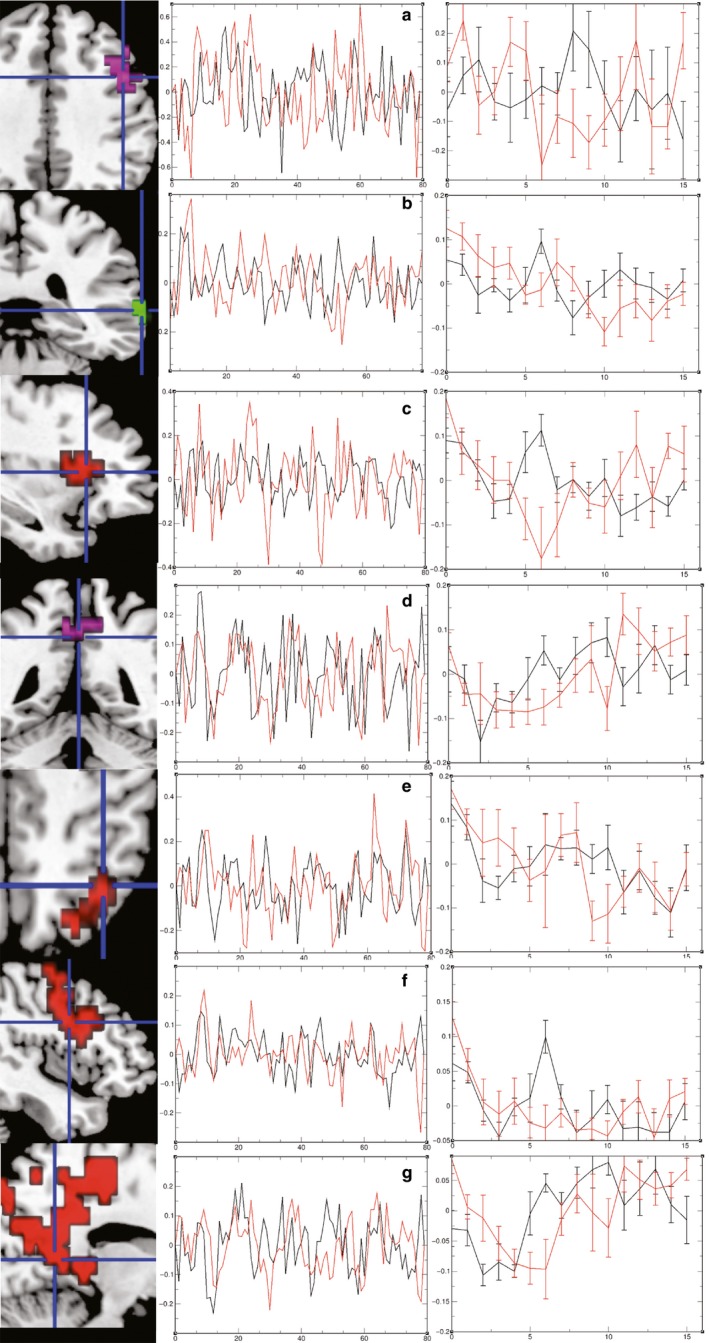
Basic activations and activation differences in time series and evoked haemodynamic responses. Radiological convention L = R. Colour codes in brain images refer to origin of cluster: red, group map non‐referred control (NC); green, group map depersonalization‐derealization disorder (DPRD); magenta, ancova image. Colour codes in time series plots: black, NC; red, DPRD. Left column: (a) inferior frontal sulcus; (b) supramarginal gyrus; (c) anterior insula/circular sulcus; (d) posterior cingulate gyrus BA31; (e) lateral precuneus; (f) middle frontal gyrus BA9; (g) lingual gyrus BA18. Middle column: plotted average time series. Right column: evoked haemodynamic responses.
Results
Interference effect, NPE and response‐delay spans
Reaction time (RT) and response accuracy data were automatically recorded as described above. Percentages of correct responses were computed for each of the two conditions. SIEs were computed as between‐condition differences in RTs; differences in mean percentages correct responses (∆PC) were determined likewise. NPEs were computed for each block on a single trial‐by‐trial basis, as were ARDS, which were generated from subjects’ minima and maxima for each block in the active condition. Table 1 lists means and comparison of means in RT measures amongst the two experimental groups. The establishment of SIEs and NPEs in each group is reported in Appendix S1.
Table 1.
Descriptives of Stroop experimental measures and psychophysiology
| NC | DPRD | t | P | 95% CI | 95% CI | |||
|---|---|---|---|---|---|---|---|---|
| M | SD | M | SD | |||||
| Neutral condition RT | 587.0 | 171.1 | 517.0 | 122.6 | −1.092 | ns | −280.0 | −31.03 |
| Negative condition RT | 805.0 | 123.7 | 649.6 | 148.9 | −2.615 | 0.015 | −210.8 | 70.82 |
| SIE | 218.1 | 220.2 | 132.5 | 100.6 | −1.190 | ns | −251.5 | 80.49 |
| PC neutral condition | 97.81 | 3.335 | 94.44 | 3.340 | −1.984 | 0.062 | −0.136 | 0.016 |
| PC negative condition | 98.09 | 3.299 | 92.69 | 3.098 | −2.287 | 0.034 | −0.067 | −0.002 |
| ΔPC | 0.288 | 3.653 | −1.747 | 3.494 | −0.748 | ns | −7.732 | 3.552 |
| NPE | 21.09 | 37.44 | 28.17 | 31.63 | −2.686 | 0.015 | −0.405 | −0.005 |
| ARDS | 72.13 | 35.07 | 105.7 | 60.62 | 2.428 | 0.048 | 0.087 | 1.045 |
| Neutral condition ASCR | 0.190 | 0.138 | 24.77 | 64.47 | 1.288 | ns | −65.05 | −15.89 |
| Negative condition ASCR | 0.292 | 0.139 | 0.509 | 0.305 | 2.087 | 0.052 | −0.002 | 0.436 |
| ΔASCR | 0.359 | 0.028 | 0.521 | 0.549 | 0.880 | ns | −0.223 | 0.548 |
ARDS, average response‐delay span; ASCR, amplitude of skin conductance response; CI, confidence interval; DPRD, depersonalization‐derealization disorder; NC, non‐referred control; NPE, negative priming effect; PC, percentage correct; RT, reaction time; SIE, Stroop interference effect. Behavioural response times in ms; electrodermal responses in μSiemens; log‐transformed scores used for t‐tests.
Psychophysiology measurement and experimental consistency
EDA data were filtered and processed in the way described above, and standard skin conductance variables were computed. Exploratory analyses had revealed that ASCRs exhibited the greatest sensitivity towards discrimination of the two groups, and also best experimental consistency. For reasons of clarity and brevity, therefore, this study focused solely on the ASCR variable out of all EDA measures. Table 2 lists between‐condition stability and discrimination tests for ASCR, RT measures, and responses misses and hits. These results suggest a high degree of consistency in the main experimental measures – both between‐condition correlations and t‐tests were significant (Fig. 2).
Table 2.
Between‐condition stability and discrimination of main experimental measures
| Measure | r | P | t | P | lower 95% CI | Upper 95% CI |
|---|---|---|---|---|---|---|
| ASCR | 0.934 | 0.0001 | −2.880 | 0.009 | −0.220 | −0.036 |
| RT | 0.591 | 0.005 | −4.603 | 0.0001 | 99.21 | 263.6 |
| No response | 0.628 | 0.002 | −1.848 | 0.080 | −1.624 | 0.101 |
| PC | 0.702 | 0.0001 | 9.212 | 0.0001 | 2.984 | 3.821 |
ASCR, amplitude of skin conductance response; CI, confidence interval; RT, reaction time. Behavioural response times in ms; electrodermal responses in μSiemens; log‐transformed scores used for t‐tests.
Figure 2.
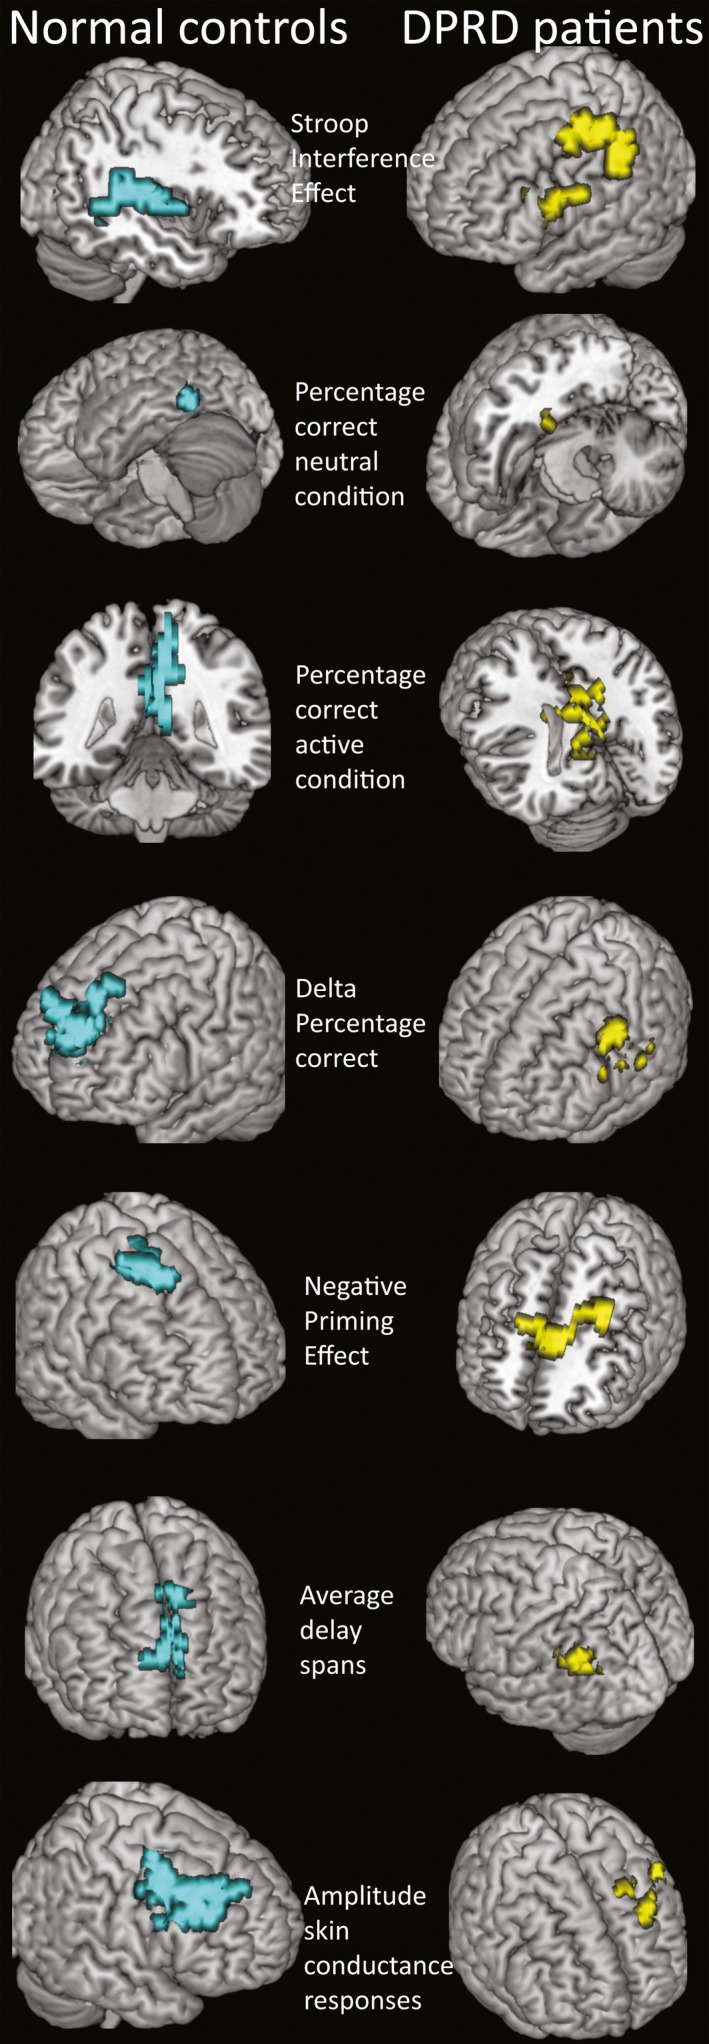
Main correlation clusters. Neurological convention R = R. Colour codes in brain images: turquoise, non‐referred control (NC); yellow, depersonalization‐derealization disorder (DPRD). For description of correlation clusters, see Table 3.
Group differences in behavioural and physiological data
As indicated in Table 1, there were no differences in neutral RT, but significant group differences in active incongruent condition RT. However, there was no significant difference in the SIE. The DPRD group had faster RTs in all comparisons. Regarding the percentages of correct responses, there was a significant group difference for the incongruent active condition, but none in the neutral condition. Again, ∆PC between‐group difference was not significant, although patients with DPRD had a lesser level of correct responses. Both the NPE and the ARDS variables were significantly larger for the DPRD group. These differences indicate that patients with DPRD may be more prone to distraction, consistent with them making fewer correct responses, and exhibited greater variability in response‐delays, the latter indicating lesser consistency in the active condition.
Regarding electrodermal responses, averaged amplitudes of SCRs were larger in patients with DPRD (Fig. 3). These results reveal greater variability of sympathetic reactivity under cognitive task load for patients with DPRD, and relatively less effective arousal suppression in the active than in the neutral condition.
Figure 3.
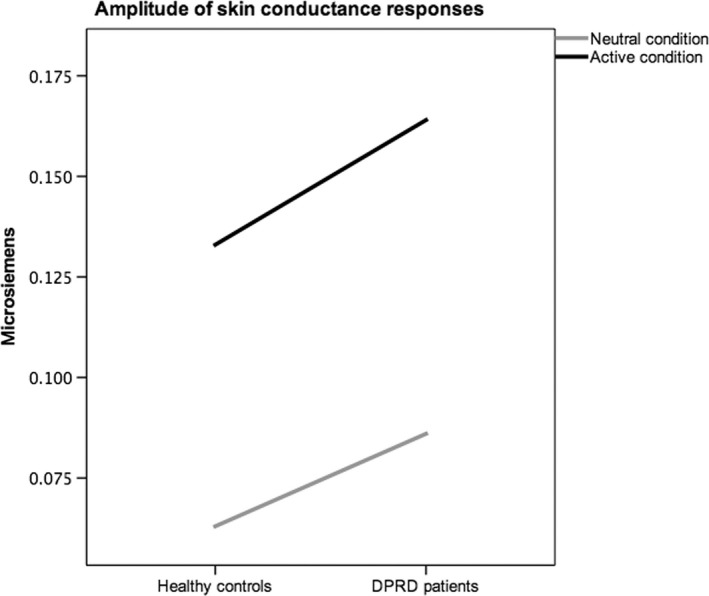
Amplitude of skin conductance responses (SCRs) across conditions. Amplitudes of SCRs averaged per epoch in μSiemens (mode) for each group in neutral and active conditions are plotted. The diagram visualizes differential arousal levels between groups, and relatively less effective arousal suppression in the depersonalization patient group.
Intercorrelations of main experimental measures within groups
Both experimental groups exhibited partly similar and partly disparate association patterns amongst the main experimental measures when controlling for confounding variables (Appendix S1; Table 3). In both groups, ASCRs correlate with ∆PC, PCneut, PCneg and NPE; NPE and SIE. Reversal of association is present for correlations of ASCRs with ARDSs. These results may suggest that abnormal or ineffective sympathetic outflow could be at the core of inconsistencies in cognitive load performance of patients with DPRD. After application of Bonferroni‐adjustment of α‐levels, however, only the correlation NPE‐ASCR in the NC group, and NPE‐DPC and NPE‐SIE in the DPRD survive as truly significant.
Table 3.
Group‐wise intercorrelations amongst main experimental measures
| r | P | ||
|---|---|---|---|
| NC | |||
| ΔPC | 0.870 | 0.024 | Negative PC |
| ΔPC | −0.899 | 0.015 | Neutral PC |
| ΔPC | 0.708 | 0.022 | Skin conductance amplitude |
| Neutral PC | −0.908 | 0.009 | Skin conductance amplitude |
| Negative PC | −0.605 | 0.048 | Skin conductance amplitude |
| ARDS | −0.677 | 0.095 | Skin conductance amplitude |
| NPE | −0.774 | 0.005* | Skin conductance amplitude |
| NPE | −0.748 | 0.013 | Neutral PC |
| NPE | −0.798 | 0.006 | Negative PC |
| SIE | −0.719 | 0.044 | NPE |
| DPRD | |||
| ΔPC | 0.904 | 0.005* | Negative PC |
| ΔPC | −0.895 | 0.006 | SIE |
| ΔPC | 0.984 | 0.016 | ARDS |
| Negative PC | −0.981 | 0.001* | SIE |
| Negative PC | −0.836 | 0.019 | Skin conductance amplitude |
| Neutral PC | −0.873 | 0.054 | Skin conductance amplitude |
| NPE | −0.991 | 0.006 | Skin conductance amplitude |
| ARDS | 0.875 | 0.023 | Skin conductance amplitude |
| SIE | −0.988 | 0.009 | ARDS |
| SIE | −0.746 | 0.021 | NPE |
| SIE | 0.842 | 0.017 | Skin conductance amplitude |
ARDS, average response‐delay span; DPRD, depersonalization‐derealization disorder; NC, non‐referred control; NPE, negative priming effect; PC, percentage correct; SIE, Stroop interference effect. Partial correlations controlling for date, daytime, state anxiety and alexithymia. *Significant at α* = 0.005 following Bonferroni adjustment.
Main activation and main correlation regions
It was possible to replicate the basic activation pattern found previously in the negative priming Stroop‐to‐neutral contrast (Steel et al., 2001; baseline subtracted, thresholds voxel level 0.05, cluster levels 0.004 and 0.003, respectively; Fig. 1): frontal (left precentral gyrus, inferior frontal sulcus, posterior wall, BA BA6, Talairach coordinates XYZ −36 0 26, cluster P = 0.000275), insular (right anterior insular gyrus, superior circular sulcus, 33 22 4, P = 0.000825) and parietal regions (right lateral precuneus, BA7, 33 −60 42, P = 0.002200), with deactivation in the occipital (right lingual gyrus BA18, 11 −52 4, P = 0.000278) lobe. The patients with DPRD showed ‘additional’ frontal (left middle frontal gyrus, middle frontal sulcus, BA9 −29 22 37, P = 0.000285) and parietal (left angular gyrus, BA39 −40 −63 37, P = 0.000285) activations, with deactivation in the dorsal posterior cingulate (BA31 4 −48 43, P = 0.000279). Hence, patients differed in the location (inferior vs. superior) of the parietal region, but were activating similarly in the left frontal region. The left dorsomedial prefrontal cortex BA9 (−30 23 37, P = 0.006686) and dorsal posterior cingulate cortex (BA31 4 −48 42, P = 0.003389) clusters reappeared in ancova images contrasting the groups as the main difference regions. The group maps of the active minus neutral conditions were the basis of correlation analysis with each of the experimental measures in each group. Table 4 summarizes the main correlation clusters in the two experimental groups. The two groups show substantially different correlation regions for the majority of the measures. Even with application of Bonferroni‐adjustment of α‐levels to α* = 0.00714 per group, almost all correlation results remain significant.
Table 4.
Correlation clusters of main NP Stroop experimental measures and psychophysiology
| NC | DPRD | |||||||||||||
|---|---|---|---|---|---|---|---|---|---|---|---|---|---|---|
| Hemis | Size | X | Y | Z | r | P | Hemis | Size | X | Y | Z | r | P | |
| SIE | R | 110 | 54 | 37 | 2 | 0.63 | 0.002656 | L | 110 | −47 | 7 | 48 | 0.92 | 0.003687 |
| Precentral sulcus BA6/BA44 | Middle frontal gyrus BA6 | |||||||||||||
| PC Neutral | L | 28 | −51 | −48 | −8 | 0.68 | 0.045768 | L | 53 | −46 | −44 | −23 | 0.61 | 0.009501 |
| Occipitotemporal cortex BA37 | Fusiform gyrus/entorhinal cortex BA36 | |||||||||||||
| PC Negative | R | 172 | 11 | −52 | 15 | 0.89 | 0.002153 | R | 197 | 0 | −44 | 26 | 0.97 | 0.001477 |
| Posterior cingulate gyrus BA30 | Posterior cingulate gyrus BA31 | |||||||||||||
| ΔPC | L | 198 | −7 | 63 | 26 | 0.91 | 0.001477 | L | 105 | −54 | 33 | 20 | 0.58 | 0.003123 |
| Superior frontal gyrus BA10 | Middle frontal gyrus BA46 | |||||||||||||
| NPE | R | 85 | 29 | 22 | 53 | 0.81 | 0.004676 | L | 111 | −7 | 33 | 11 | 0.85 | 0.003940 |
| Middle frontal gyrus BA6 | Dorsal mid‐anterior cingulate gyrus BA24 | |||||||||||||
| ARDS | R | 80 | 7 | 52 | 26 | 0.67 | 0.004629 | L | 41 | −54 | −52 | 31 | 0.49 | 0.011119 |
| Superior frontal gyrus BA9 | Supramarginal gyrus BA39 | |||||||||||||
| ASCR | R | 189 | 43 | 22 | 37 | 0.96 | 0.003687 | L | 117 | 22 | 30 | 31 | 0.92 | 0.002744 |
| Middle frontal gyrus BA9 | Superior frontal gyrus BA9 | |||||||||||||
ARDS, average response‐delay span; ASCR, amplitude of skin conductance response; DPRD, depersonalization‐derealization disorder; NC, non‐referred control; NPE, negative priming effect; PC, percentage correct; SIE, Stroop interference effect. Significance tested against 50 cycles of random permutation. Size, number of voxels in respective 3D cluster; X, Y, Z are the Talairach coordinates of the peak activation/correlation within the clusters.
Functional connectivity
For each of the main clusters found in the correlation analyses, the BOLD signal levels were extracted from the individual cluster peaks in percentage effect size. To test for functional connectivity, these extracted values were tested for association (Table 5). Overall, functional connectivity (Table 5) correlation patterns partly replicate correlations also present in experimental measures (Table 3) in each of the groups. However, NC subjects show eight, and DPRD show only six significant paths. It may be concluded that patients with DPRD have slightly reduced functional connectivity. However, with application of Bonferroni‐adjustment of α‐levels, α* = 0.00625 for NC, α* = 0.00833 for patients with DPRD, only NPE‐ASCR and SIE‐NPE associations remain significant in the NC group; in the DPRD group, the two associations NPE‐ASCR and SIE‐ARDS survive. Thus, both groups would have an equal amount of connectivity.
Table 5.
Functional connectivity of BOLD signal levels amongst main correlation regions
| r | P | ||
|---|---|---|---|
| NC | |||
| ΔPC | 0.534 | 0.091 | Negative PC |
| ΔPC | −0.595 | 0.054 | Neutral PC |
| Negative PC | 0.544 | 0.084 | Neutral PC |
| Neutral PC | −0.615 | 0.044 | Skin conductance amplitude |
| Negative PC | −0.605 | 0.048 | Skin conductance amplitude |
| NPE | −0.774 | 0.005* | Skin conductance amplitude |
| SIE | −0.709 | 0.015 | ARDS |
| SIE | −0.743 | 0.009 | NPE |
| DPRD | |||
| ΔPC | 0.725 | 0.027 | Negative PC |
| ΔPC | −0.716 | 0.030 | SIE |
| Negative PC | −0.688 | 0.040 | SIE |
| Negative PC | −0.833 | 0.005* | Skin conductance amplitude |
| SIE | −0.806 | 0.009* | ARDS |
| SIE | −0.746 | 0.021 | NPE |
ARDS, average response‐delay span; DPRD, depersonalization‐derealization disorder; NC, non‐referred control; NPE, negative priming effect; PC, percentage correct; SIE, Stroop interference effect. Bold signal percentage effect size extracted from individual peak voxels. *Significant at α* = 0.006 (NC) and α* = 0.008 (DPRD) following Bonferroni adjustment.
BOLD time series and evoked haemodynamic responses
Visual inspection of time series extracted from ROIs for both groups (Fig. 1, middle column) suggests that patients with DPRD show a more extreme pattern of spiking. Testing for overall differences, however, reveals that there are no overall significant between‐group differences in average BOLD time series, except for a significant trend (P = 0.0961) in the supramarginal cluster. When inspecting the evoked haemodynamic responses (Fig. 1, right column), it can be observed that significant between‐group differences exist at between three and six out of 16 time points in the ROI clusters evaluated. These results suggest a partly distinct pattern of haemodynamic modulation in patients with DPRD.
Discussion
This study used a Stroop word–colour interference task paradigm, combining a negative priming condition and a control condition, and investigated the neural correlates of the SIE, NPE, cognitive load, error rates and sympathetic stress responses. To this end, a group of DPRD and NC subjects were compared in behavioural, neural and autonomic measures. For basic activation markers, the groups were compared in terms of BOLD signal time series and evoked haemodynamic responses. For each experimental measure, the brain‐behaviour correlation regions in each of the two groups were computed. The interrelations of behavioural and psychophysiological measures were tested, and also functional connectivity patterns were tested for amongst the main brain‐correlation regions.
The basic results align to those of a preceding neuroimaging study establishing this negative priming Stroop paradigm (Steel et al., 2001), and confirm other activation patterns described in the literature (see below). The main behavioural findings of this study are that both groups exhibited SIEs and NPEs. The groups showed significant between‐group differences in NPE, cognitive load, specific error rates and skin conductance amplitudes. Substantially different locations of regions for brain‐behaviour correlations became evident for SIE, NPE and cognitive load. Such patterns of alternating and/or compensatory co‐activation actually resemble those typically seen in normal aging with cognitive tasks, whilst in the absence of severe brain pathology. When testing for functional connectivity, the DPRD group exhibited an overall reduced pattern of connectivity amongst the main correlation regions, but similar in interrelations when comparing with the NC group. Comparing experimental behavioural and psychophysiological interrelations, it became apparent that DPRD show an inverse association pattern of skin conductance with the cognitive load index measure, suggesting an abnormal mechanism of autonomic stress reactivity. When extracting BOLD time series from group maps, it became obvious that, whilst there are no significant overall group differences, the DPRD group show more extreme spiking patterns in BOLD responses. In evoked haemodynamic responses, significant differences in BOLD deflections were evident in 30–40% of time points compared.
Regarding testing of a priori hypotheses, the assumption of no group differences (hypothesis i) was not consistently supported. Indeed, both groups exhibited both SIEs and NPEs, but showed near‐significant between‐group differences in NPE, error rates, cognitive load and skin conductance amplitude (yet these trends did not persist after Bonferroni correction for multiple testing). These findings suggest that patients with DPRD exhibit lesser negative priming suppression, higher error rates, smaller working memory spans and less effective arousal suppression under stressful task demand. Regarding correlation regions for the SIE (hypothesis ii), activation in the inferior frontal junction and parietal regions was expected for NC. Confirming this hypothesis, NC subjects had their main correlation region in the right inferior frontal sulcus. For the NPE correlation regions, activations in superior, middle and inferior frontal gyri were expected (hypothesis ii), regions that had the largest BOLD effects in the Steel et al. (2001) study. The main correlation region for the NPE was in BA6, consistent with the hypothesis and literature (Derrfuss et al., 2004). For cognitive load correlation regions (hypothesis iii), activations were hypothesized where previously delay‐active neurons had been discovered: prefrontal, posterior parietal and striatal structures. Supporting this expectation, correlation regions for the ARDS were in the dorsomedial superior frontal cortex in NC subjects, and in the right supramarginal gyrus in patients with DPRD. For the ASCR, correlation regions were expected mainly in the SMA (hypothesis v), an expectation that received no clear support (as the clusters lie anterior to BA6, but may still be part of the SMA). It is possible that the orally based response modality in this task is responsible for the more lateral location, as compared with the manual output mode in the Zhang et al. (2012) study. However, DPRD showed mesial wall SMA involvement in ASCRs. With respect to the expectation of different locations in DPRD (hypothesis vi), specifically, in prefrontal memory regions due to possible stress alterations, this hypothesis could be supported for NPE, cognitive load and ASCRs, where patients with DPRD showed regions for brain‐behaviour correlations clearly distinct from those in NC subjects (Appendix S1 discussion).
This investigation has the advantage of utilizing a paradigm that can account for Stroop and NPEs, as well as for working memory span. Furthermore, the experimental setup as a multimodal imaging study allows considering findings that were previously dispersed in several methodological schools of thought. Although the relative rarity of primary DPRD diagnosis necessarily imposes restrictions on sample size, this study is based on countrywide sampling of patients. As the paradigm was a block design, an experimental limitation of the present study is that it was not possible to discern between correct‐only and incorrect‐only activations. This problem was, however, overcome by the use of brain‐behaviour correlation analyses.
In conclusion, it can be stated that the present investigation has yielded further evidence to support the notion that patients with DPRD do ‘not’ exhibit gross impairments in terms of selective attention, cognitive inhibition and working memory. However, slight neuropsychological deficits were shown and confirmed in terms of reduced short‐term memory, distractibility and inability to suppress stress‐related arousal states under cognitive task demand.
Supporting information
Appendix S1. Methods.
Acknowledgements
This study was funded by The Wellcome Trust, ARC Programme, and The Pilkington Family Trust. All authors declared that no conflicts exist.
Abbreviations
- ARDS
average response‐delay spans
- ASCR
amplitude of skin conductance response
- BA
Brodmann area
- BOLD
blood oxygen level‐dependent
- DPRD
depersonalization‐derealization disorder
- EDA
electrodermal activity
- fMRI
functional magnetic resonance imaging
- NC
non‐referred control
- NPE
negative priming effect
- PC
percentage correct
- ROI
region of interest
- RT
reaction time
- SCR
skin conductance response
- SIE
Stroop interference effect
- SMA
supplementary motor area
[The copyright line was updated on 22 April 2016, after first online publication.]
References
- Amiez, C. & Petrides, M. (2009) Anatomical organization of the eye fields in the human and non‐human primate frontal cortex. Prog. Neurobiol., 89, 220–230. [DOI] [PubMed] [Google Scholar]
- Arnsten, A.F. (1998) The biology of being frazzled. Science, 280, 1711–1712. [DOI] [PubMed] [Google Scholar]
- Arnsten, A.F. (2009) Stress signalling pathways that impair prefrontal cortex structure and function. Nat. Rev. Neurosci., 10, 410–422. [DOI] [PMC free article] [PubMed] [Google Scholar]
- Ashby, F.G. , Ell, S.W. , Valentin, V.V. & Casale, M.B. (2005) FROST: a distributed neurocomputational model of working memory maintenance. J. Cogn. Neurosci., 17, 1728–1743. [DOI] [PubMed] [Google Scholar]
- Brass, M. , Derrfuss, J. , Forstmann, B. & von Cramon, D.Y. (2005) The role of the inferior frontal junction area in cognitive control. Trends Cogn. Sci., 9, 314–316. [DOI] [PubMed] [Google Scholar]
- Dalrymple‐Alford, E.C. & Budayer, B. (1966) Examination of some aspects of the Stroop Color‐Word Test. Percept. Motor Skill., 23, 1211–1214. [DOI] [PubMed] [Google Scholar]
- Derrfuss, J. , Brass, M. & von Cramon, D.Y. (2004) Cognitive control in the posterior frontolateral cortex: evidence from common activations in task coordination, interference control, and working memory. NeuroImage, 23, 604–612. [DOI] [PubMed] [Google Scholar]
- Derrfuss, J. , Brass, M. , Neumann, J. & von Cramon, D.Y. (2005) Involvement of the inferior frontal junction in cognitive control: meta‐analyses of switching and Stroop studies. Hum. Brain Mapp., 25, 22–34. [DOI] [PMC free article] [PubMed] [Google Scholar]
- Derrfuss, J. , Vogt, V.L. , Fiebach, C.J. , von Cramon, D.Y. & Tittgemeyer, M. (2012) Functional organization of the left inferior precentral sulcus: dissociating the inferior frontal eye field and the inferior frontal junction. NeuroImage, 59, 3829–3837. [DOI] [PubMed] [Google Scholar]
- Dishon‐Berkovits, M. & Algom, D. (2000) The Stroop effect: it is not the robust phenomenon that you have thought it to be. Mem. Cognition, 28, 1437–1449. [DOI] [PubMed] [Google Scholar]
- Fuster, J.M. (1973) Unit activity in prefrontal cortex during delayed‐response performance: neuronal correlates of transient memory. J. Neurophysiol., 36, 61–78. [DOI] [PubMed] [Google Scholar]
- Guralnik, O. , Schmeidler, J. & Simeon, D. (2000) Feeling unreal: cognitive processes in depersonalization. Am. J. Psychiat., 157, 103–109. [DOI] [PubMed] [Google Scholar]
- Guralnik, O. , Giesbrecht, T. , Knutelska, M. , Sirroff, B. & Simeon, D. (2007) Cognitive functioning in depersonalization disorder. J. Nerv. Ment. Dis., 195, 983–988. [DOI] [PubMed] [Google Scholar]
- Jensen, A.R. & Rohwer, W.D. Jr (1966) The Stroop color‐word test: a review. Acta Psychol. (Amst), 25, 36–93. [DOI] [PubMed] [Google Scholar]
- Lemche, E. , Giampietro, V.P. , Surguladze, S.A. , Amaro, E.J. , Andrew, C.M. , Williams, S.C.R. , Brammer, M.J. , Lawrence, N. , Maier, M.A. , Russell, T.A. , Simmons, A. , Ecker, C. , Joraschky, P. & Phillips, M.L. (2006) Human attachment security is mediated by the amygdala: evidence from combined fMRI and psychophysiological measures. Hum. Brain Mapp., 27, 623–635. [DOI] [PMC free article] [PubMed] [Google Scholar]
- MacLeod, C.M. (1991) Half a century of research on the Stroop effect: an integrative review. Psychol. Bull., 109, 163–203. [DOI] [PubMed] [Google Scholar]
- MacLeod, C.M. & MacDonald, P.A. (2000) Interdimensional interference in the Stroop effect: uncovering the cognitive and neural anatomy of attention. Trends Cogn. Sci., 4, 383–391. [DOI] [PubMed] [Google Scholar]
- Miller, G.A. (1956) The magical number seven plus or minus two: some limits on our capacity for processing information. Psychol. Rev., 63, 81–97. [PubMed] [Google Scholar]
- Neumann, J. , Lohmann, G. , Derrfuss, J. & von Cramon, D.Y. (2005) Meta‐analysis of functional imaging data using replicator dynamics. Hum. Brain Mapp., 25, 165–173. [DOI] [PMC free article] [PubMed] [Google Scholar]
- Phillips, M.L. & Sierra, M. (2003) Depersonalization disorder: a functional neuroanatomical perspective. Ann. NY Acad. Sci., 6, 157–165. [DOI] [PubMed] [Google Scholar]
- Posner, M.I. (1975) Psychobiology of attention In Gazzaniga M.S. & Blakemore C. (Eds), Handbook of Psychobiology. Elsevier Inc., New York, NY, pp. 441–480. [Google Scholar]
- Sierra, M. & Berrios, G.E. (2000) The Cambridge Depersonalization Scale: a new instrument for the measurement of depersonalization. Psychiat. Res., 93, 153–164. [DOI] [PubMed] [Google Scholar]
- Steel, C. , Haworth, E.J. , Peters, E. , Hemsley, D.R. , Sharma, T. , Gray, J.A. , Pickering, A. , Gregory, L. , Simmons, A. , Bullmore, E.T. & Williams, S.C. (2001) Neuroimaging correlates of negative priming. NeuroReport, 12, 3619–3624. [DOI] [PubMed] [Google Scholar]
- Stein, D.J. & Simeon, D. (2009) Cognitive‐affective neuroscience of depersonalization. CNS Spectr., 14, 467–471. [DOI] [PubMed] [Google Scholar]
- Stroop, J.R. (1935) Studies of interference in serial verbal reactions. J. Exp. Psychol., 18, 643–662. [Google Scholar]
- Sundermann, B. & Pfleiderer, B. (2012) Functional connectivity profile of the human inferior frontal junction: involvement in a cognitive control network. BMC Neurosci., 13, 119. [DOI] [PMC free article] [PubMed] [Google Scholar]
- Sweller, J. (1988) Cognitive load during problem solving: effects on learning. Cognitive Sci., 12, 257–285. [Google Scholar]
- Tipper, S.P. (1985) The negative priming effect: inhibitory priming by ignored objects. Q. J. Exp. Psychol. A, 37, 571–590. [DOI] [PubMed] [Google Scholar]
- Tipper, S.P. & Cranston, M. (1985) Selective attention and priming: inhibitory and facilitatory effects of ignored primes. Q. J. Exp. Psychol. A, 37, 591–611. [DOI] [PubMed] [Google Scholar]
- Zhang, S. , Hu, S. , Chao, H.H. , Luo, X. , Farr, O.M. & Li, C.S. (2012) Cerebral correlates of skin conductance responses in a cognitive task. NeuroImage, 62, 1489–1498. [DOI] [PMC free article] [PubMed] [Google Scholar]
Associated Data
This section collects any data citations, data availability statements, or supplementary materials included in this article.
Supplementary Materials
Appendix S1. Methods.