Abstract
Purpose
To investigate the relationship between image quality measurements and the clinical performance of digital mammographic systems.
Methods
Mammograms containing subtle malignant non-calcification lesions and simulated malignant calcification clusters were adapted to appear as if acquired by four types of detector. Observers searched for suspicious lesions and gave these a malignancy score. Analysis was undertaken using jackknife alternative free-response receiver operating characteristics weighted figure of merit (FoM). Images of a CDMAM contrast-detail phantom were adapted to appear as if acquired using the same four detectors as the clinical images. The resultant threshold gold thicknesses were compared to the FoMs using a linear regression model and an F-test was used to find if the gradient of the relationship was significantly non-zero.
Results
The detectors with the best image quality measurement also had the highest FoM values. The gradient of the inverse relationship between FoMs and threshold gold thickness for the 0.25mm diameter disk was significantly different from zero for calcification clusters (p=0.027), but not for non-calcification lesions (p=0.11). Systems performing just above the minimum image quality level set in the European Guidelines for Quality Assurance in Breast Cancer Screening and Diagnosis resulted in reduced cancer detection rates compared to systems performing at the achievable level.
Conclusions
The clinical effectiveness of mammography for the task of detecting calcification clusters was found to be linked to image quality assessment using the CDMAM phantom. The European Guidelines should be reviewed as the current minimum image quality standards may be too low.
Keywords: Mammography, contrast detail, cancer detection, digital detector
INTRODUCTION
The European guidelines for quality control in digital mammography specify minimum acceptable and achievable standards of image quality in terms of threshold contrast, determined from readings of images of the CDMAM contrast-detail phantom [1]. The acceptable limits are the minimum level that can be accepted while the systems should be optimally operated at the achievable level or better [2]. The acceptable limits were set to ensure that digital mammography systems performed at least as well as screen film systems, while the achievable limits matched the measured image quality of a good digital system in the early 2000s and were not based on clinical outcomes. This phantom (figure 1) comprises gold disks of a range of diameters (0.06 to 2.0 mm) and thicknesses (0.03 to 2.0 μm) evaporated onto a 0.5 mm thick sheet of aluminium. Each square in the phantom contains two disks, one in the centre and the other in one of the corners. The phantom is placed between two 20 mm thick blocks of polymethyl methacrylate (PMMA) and imaged using the mammographic factors selected by the automatic exposure control or using manually selected factors similar to those that would be selected for imaging a 50 mm thickness of PMMA (which is equivalent to a 60 mm thick compressed breast). The observer has to locate the corner disk in each image square in each column of disks until the disks are no longer visible. This process is repeated for multiple images to determine the threshold gold thickness at each disk diameter. In a recent update to the European guidelines a procedure for using automatic software to read the CDMAM images was introduced [2]. This software (available at www.euref.org) estimates the threshold gold thicknesses for a typical observer using the methods described by Young et al [3].
Figure 1.
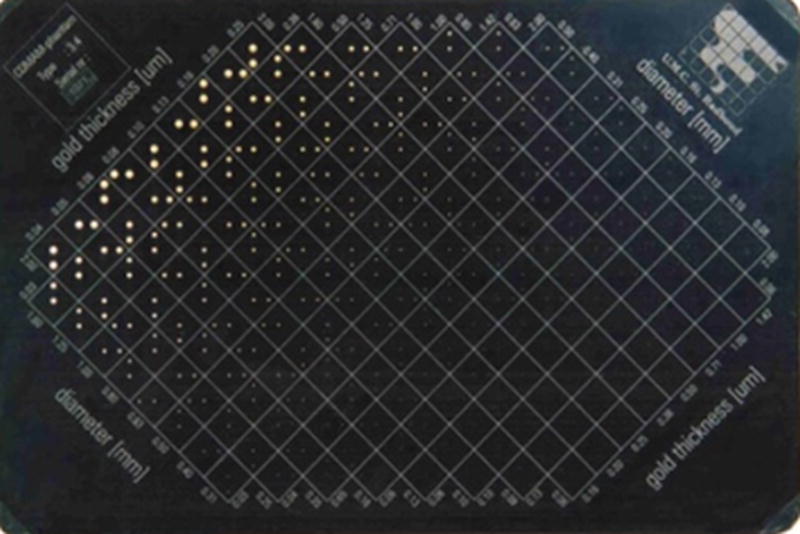
Photograph of CDMAM test object
This image quality measurement is affected by the physical characteristics of the imaging systems such as the resolution, detector noise, scatter, glare and geometric blurring. It is made on unprocessed images of the phantom and does not include any modifying effect on image quality of subsequent image processing which is routinely applied to clinical images. Another limitation of the detection task is that the background is uniform.
In a clinical image, the lesions of interest are viewed against the complex structure of a mammogram. It is of interest to test if the CDMAM contrast detail test is related to the radiologist performance for detecting cancers. These of course are not simple disks and appear in a variety of background textures. Kotre [4] and Huda et al [5] undertook studies examining the effect on detection of different sizes of simple lesions superimposed on a breast structure background. The authors of both papers concluded that the detection of details larger than 1 mm was mainly limited by the breast structure noise and that the detection of smaller details (less than 0.5 mm) was mainly limited by the quantum noise in the image. Saunders et al [6] and Samei et al [7] examined the effect of noise on the detection of cancers in the breast. They found that the detection of calcifications was sensitive to detector noise, but the detection of masses was not. However, the discrimination between masses with a clear circumscribed border (benign) and a less well defined border typical of malignancies was adversely affected by image noise. Studying the impact of image quality differences on the detection of non-calcification lesions is important because a high proportion of breast cancers are detected in the absence of calcifications. Arguably the detection of non-calcification lesions is more important than the detection of calcifications since they are predominantly associated with invasive disease rather than non-invasive disease such as ductal carcinoma in situ (DCIS) [8].
Warren et al [9] undertook a study which used real mammograms with inserted calcification clusters modified to appear at different dose levels. They found a significant relationship between the detection of calcifications in an observer study and corresponding image quality measurements with the CDMAM phantom. They also found that differences in calcification detection using two types of detector (an amorphous-selenium (a-Se) detector and a powder phosphor computed radiography (CR) system) were matched by differences in image quality measurement using the CDMAM phantom. It is of interest to know if this relationship will occur for a larger number of detector types and different types of lesions including non-calcification lesions. There have also been some improvements in the methodology for undertaking this type of study. The current study includes both breasts, a more realistic viewing protocol and improved image simulation. Importantly, the study question is related to recall and malignancy rather than confidence that the marked lesion is a calcification cluster.
The aim of this work is to further investigate the relationship between image quality measurements in European guidelines and the detection of different types of malignant breast lesions using images and data from a published virtual clinical trial [10].
METHODS AND MATERIALS
Summary of comparison between observer study and threshold gold thickness
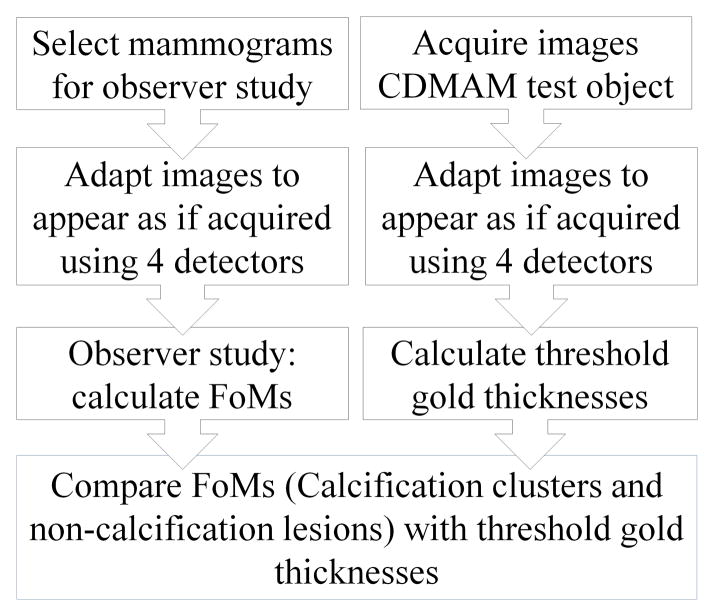
A virtual clinical trial [10] examined the use of four different types of mammography detector to detect inserted calcification clusters and real non-calcification lesions and is referred to here as the 4-detector observer study. In that trial a set of cases with calcification clusters and malignant non-calcification lesions was prepared and the images converted to appear as if acquired on four different types of detector using methods previously described [11,12]. In a further piece of work the same conversion process was applied to images of a CDMAM phantom so that image quality measurements could be made for the four simulated systems used in the observer study allowing comparison between the results of the observer study and image quality assessments. A summary of the method for comparing clinical performance and technical image quality is shown in figure 2.
Figure 2.
Summary of methods for study
Image Acquisition
Five Hologic Selenia x-ray systems (Hologic Inc., Bedford, MA, USA) in mobile vans and two Hologic Dimensions x-ray systems in fixed units were used for the acquisition of the mammograms and images of the CDMAM phantom.
4-detector observer study
Images were selected from the OPTIMAM mammography image database (www.nccpm.org/optimam) containing anonymised mammograms with associated clinical information [13]. The observer study [10] used one view (either CC or MLO) of both breasts from 269 cases including normal images (80 cases) and images with non-calcification lesions (80 cases), inserted calcification clusters (80 cases) and biopsy-proven benign lesions (29 cases). The study protocol was approved by the regional research ethics committee.
Acquisition of images of CDMAM phantom
Sixteen images of the CDMAM 3.4 (Serial number 1022) phantom (Artinis Medical Systems BV, Netherlands) were acquired on each of the seven Hologic systems at a tube voltage of 31 kV, 350 or 360 mAs using a W/Rh target filter combination. The phantom was sandwiched between two 20 mm thick PMMA blocks. The anti-scatter grid was used. The images were acquired such that the mean glandular dose (MGD) for the equivalent 60 mm compressed breast thicknesses (CBT) was 3.96 mGy [14]. This was much higher than the normal clinical dose (1.18 mGy) to facilitate the simulation of the effect of a wide range of lower doses.
Image Adaption
Characterisation of imaging systems
The characterisation of the seven Hologic systems has been published by Mackenzie et al [15] in terms of modulation transfer function (MTF), noise, glare-to-primary ratio (GPR), flat field correction and signal transfer properties. In order to adapt mammograms acquired on these systems to appear as if acquired using the four simulated detectors, four other detectors were also characterised: GE Essential (GE Healthcare, Milwaukee, USA), Agfa DX-M with needle image phosphor (NIP) CR plates (Agfa Healthcare, Mortsel, Belgium), Carestream NIP CR plates (Carestream Health Inc., Rochester, USA) and Carestream CR900 with EHR-M2 powder phosphor CR image plates.
Detector image quality of study arms
The measured characteristics of the above detectors were used to create generic image quality characterisations that were representative of the following detectors:
a-Se photoconductor detector
CsI phosphor detector
NIP CR
Powder image phosphor (PIP) CR
The data for the a-Se detector was based on the average of all seven Hologic systems. The data for the CsI detector was based upon the detector in the GE Essential X-ray system and that for the CR NIP detector was based on the average of the Agfa NIP and Carestream NIP systems. Finally, the data for CR PIP detector was based upon data for the Carestream 900 system with EHR-M2 image plates. There were differences in the characterisation of the real and simulated detectors. A pixel pitch of 70 μm was used for all simulated detectors. The Hologic Dimensions system uses a tungsten anode, but the CsI and CR PIP detectors were characterised using a molybdenum anode and their noise characterisation was therefore adapted for a beam quality using a tungsten anode using methods developed previously [15].
Summary of image adaption methods
The images acquired on the Hologic systems were converted to appear as if they had been acquired on the detectors being simulated using methods described previously [11,12]. In outline, this multi-stage process was as follows. The images were linearized so that the pixel values were equivalent to the absorbed energy per unit area within the pixel. The flat field correction associated with anode heel effect and distance from the tube was removed from the images. The two orthogonal MTFs were adjusted to account for the GPR and then converted into a 2D MTF. The linearized images were then blurred in frequency space to match the sharpness characteristics of each detector. Electronic, quantum, and structure noise was added to the blurred images to correct for differences between the noise associated with the simulated detectors and the original Hologic detectors. The methodology calculated and added noise with the correct magnitude and appropriate correlation. Finally, the flat field correction was re-applied to the images for the detectors with a-Se and CsI convertors, as they would normally be flat fielded. The simulated images thus appear as if acquired using the four generic detectors with the same x-ray system as the original Hologic systems. This means that effectively the same grid was used and the amount of scatter was the same for each study arm. Also the radiographic factors were not changed which avoided the confounding effects of using different radiographic factors for each system.
Adaption of study images
The mammograms and images of the CDMAM phantom were converted to appear as if obtained using the detectors in the four arms of the study using the above-outlined image conversion methodology. All arms of the 4-detector observer study were undertaken at the same average MGD of 1.18 mGy for CBT between 55 and 65 mm [14]. The images were all processed using Agfa ‘MUSICA2’ (Agfa Healthcare, Mortsel, Belgium). The images of the CDMAM phantom were converted to match the image quality of the four arms of the observer study at a MGD for the equivalent 60 mm CBT of 1.18 mGy. To aid the interpretation of the results, the effect of dose changes on threshold gold thickness was investigated by also converting the images for equivalent MGD values of between 0.59 and 3.5 mGy.
Performance Measures
4-detector observer study
Seven accredited readers from the United Kingdom breast screening program were used as observers. They searched the images and marked the location of suspicious regions along with a malignancy grading using a six point scale. The data analysis was undertaken using jackknife alternative free-response receiver operating curves (JAFROC) analysis. Observer performance was characterised by the equally weighted JAFROC figure of merit (FoM) [16]. The FoM combines the ability of the observer to detect the lesions and a score of malignancy for the lesion. For simplicity we refer to this as detection. The 4-detector observer study [10] showed no significant differences in the measured FoMs between the a-Se and CsI detectors. For calcification clusters and non-calcification lesions, both CR detectors’ FoMs were significantly lower than for the a-Se and CsI detectors. The FoM for the detection of calcification clusters for CR NIP was significantly better than that for CR PIP.
CDMAM study
The images of the CDMAM phantom were read automatically using CDCOM software (v.1.6) and CDMAM analyser software (v.2.1.0a) to calculate the limiting threshold gold thickness for each diameter of disc [3]. The threshold gold thicknesses were calculated for the 16 images from each system and then the results for the seven systems were averaged for each study arm. The standard deviation of the seven measurements of threshold gold thickness was used to calculate the 95% confidence limits for the mean value and thus included the measurement error and system-to-system variation.
Comparison of FoMs and threshold gold thicknesses
Linear regression was used to compare the FoMs measured for calcification clusters and non-calcification lesions in the 4-detector observer study with the threshold gold thickness for one diameter detail. Warren et al [17] found that the average size of individual calcifications visible in images acquired on a Hologic Dimensions system was 0.26 mm with a range from 0.07 mm to 1.16 mm and so a 0.25 mm detail diameter was chosen as the basis for a relevant and useful comparison. An F-test was used to find if there was a significant non-zero gradient using Prism v6.0 (GraphPad Software, Inc., La Jolle, CA). The relationship between threshold gold thickness and equivalent MGD and the relationship between the FoM and threshold gold thickness was calculated. This allowed an estimate of the relationship between the FoM and MGD to be made.
RESULTS
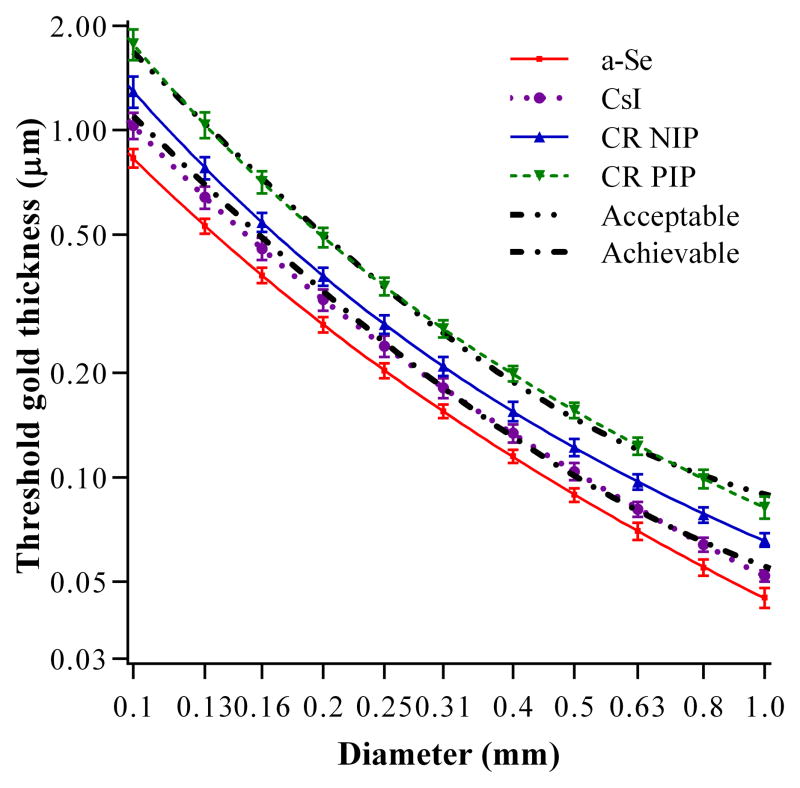
Figure 3 shows the threshold gold thicknesses for the CDMAM images converted to appear at the same image quality levels as the four arms of the observer study at an MGD of 1.18 mGy for an equivalent 60 mm CBT. In addition, the acceptable and achievable thresholds from the European guidelines are shown. A lower threshold gold thickness indicates better image quality.
Figure 3.
Threshold gold thickness against diameter of disk for four detectors at an MGD of 1.18mGy for equivalent to 60 mm CBT. The acceptable and achievable levels in the European Guidelines are also shown.
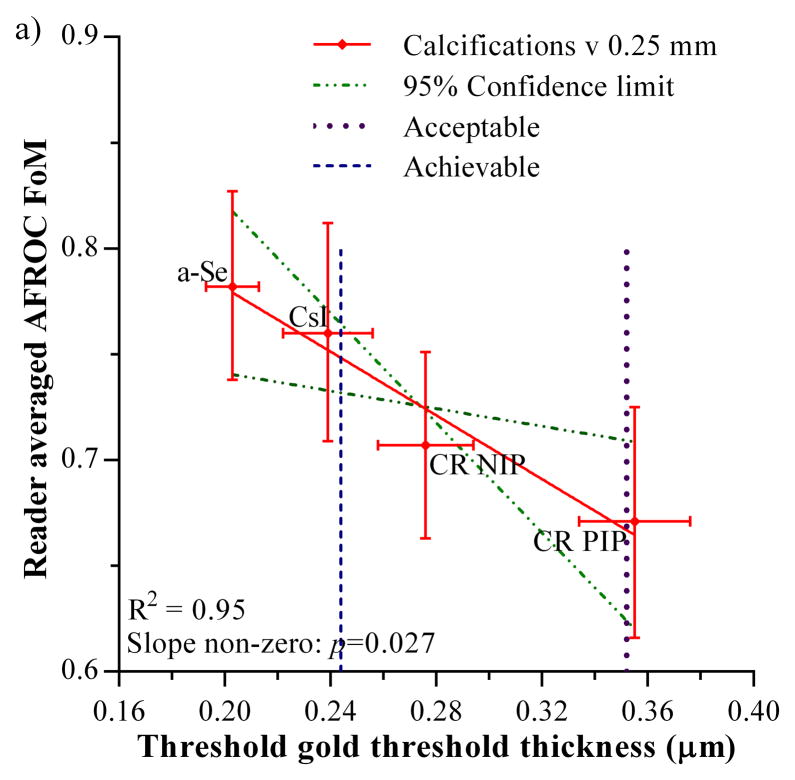
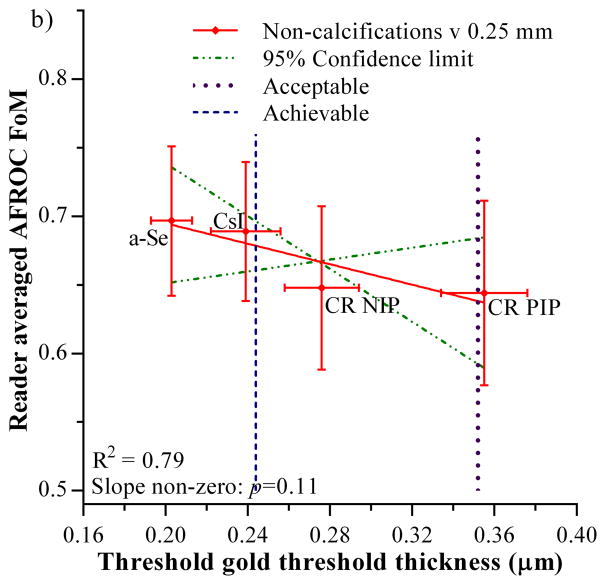
The FoMs measured for calcification clusters and non-calcification lesions in the 4-detector observer study are plotted against the threshold gold thickness for the 0.25 mm diameter detail in figure 4. The acceptable and achievable levels for threshold gold thickness in the European guidelines are also shown [1]. Both graphs show an inverse relationship which indicates that the FoM (observer study cancer detection) decreases as the threshold gold thickness increases. Only the relationship for the calcification clusters shows a significant non-zero gradient (F=35.5, degrees of freedom = 1 and 2, p=0.027). Thus there is a significant correlation between calcification detection performance measured from real images in observer studies and threshold gold thicknesses measured using the CDMAM phantom. The relationship between the non-calcification lesion detection and threshold gold thickness was not significantly different from zero (F=7.4, degrees of freedom = 1 and 2, p=0.11).
Figure 4.
Relationship between JAFROC FoM and threshold gold thickness for a 0.25 mm diameter disk. a) calcification clusters, b) non-calcification lesions. Error bars indicate 95% confidence intervals. The 95% confidence limits for the slopes of the fitted lines are shown by the broken lines. The acceptable and achievable threshold gold thickness levels in European Guidelines are shown by the vertical dashed lines.
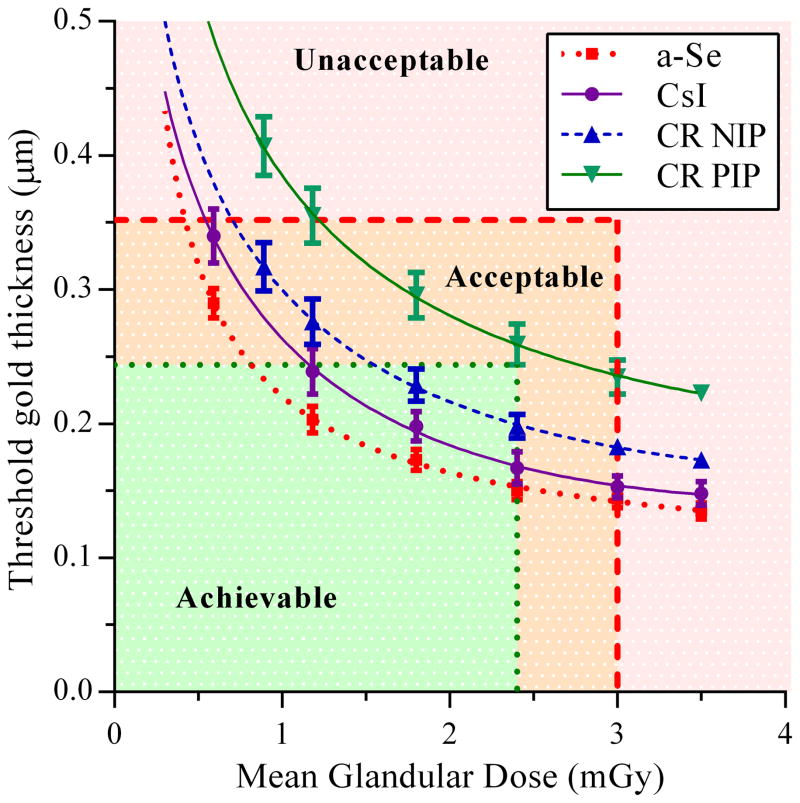
The CDMAM images were also adapted to appear as if acquired at doses between 0.59 and 3.5 mGy. The results for the 0.25 mm diameter disk are shown in figure 5 for the four detectors in the study, along with the dose and threshold gold thickness limits set in the European Guidelines [1].
Figure 5.
Threshold gold thickness for 0.25 mm diameter detail for each detector type over a range of equivalent MGD for 60 mm compressed breast thickness
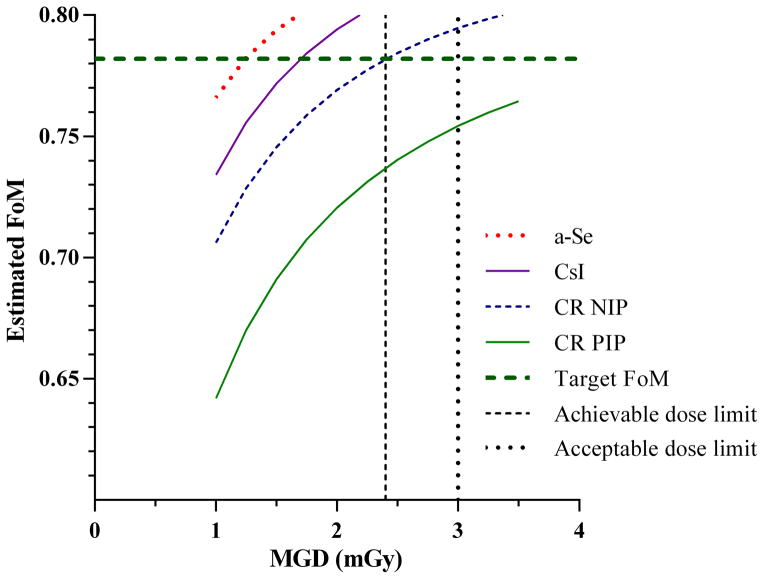
The results shown in figures 4 and 5 can be used to estimate the relationship between the FoM for calcification clusters and the MGD. This is shown in figure 6. It is of interest to estimate the extra dose required for each of the other detectors to match the performance of the a-Se detector at an MGD of 1.18 mGy for equivalent to 60 mm CBT. A target FoM of 0.782 is shown in figure 6 and corresponds to the FoM measured for the a-Se detector. It is not possible to achieve the same FoM for CR PIP and remain within the dose limits set in the European guidelines [1]. The CR NIP system does reach the target FoM at 2.4 mGy. A dose increase of 44% (to 1.7 mGy) would be required for the performance of the CsI detector to match the FoM for the a-Se system.
Figure 6.
Estimated FoM for calcification clusters for a-Se, CsI, CR NIP and CR PIP detectors over a range of MGD for 55 to 65 mm compressed breast thickness. The target FoM is the FoM measured for the a-Se detector for calcification clusters at 1.18 mGy.
DISCUSSION
This study has compared a measure of the clinical performance (FoM) with physical image quality measurements (threshold gold thickness) for four different mammography detectors. The clinical images contained malignant calcification clusters and non-calcification lesions, while the image quality test object was the CDMAM phantom. Both of the original sets of images were acquired on seven Hologic mammography systems. The images were converted to appear as if acquired on four detector types using the same image adaption process. This allowed a comparison between the two measurements. For completeness, it was important to include both calcification clusters and non-calcification lesions in this study. A relationship between clinical performance and measured image quality has been shown. Therefore, image quality assessment using the CDMAM phantom is justified as a surrogate for assessing the cancer detection performance of mammography systems.
The threshold gold thickness measurements for the simulated a-Se and CsI detectors are similar to those found for real Hologic Dimensions systems and GE Essential systems respectively [18,19]. The simulated CR detectors have a lower threshold gold thicknesses for 0.25 mm disks than were found for real detectors in the corresponding clinical systems i.e. better image quality [20,21]. It must be noted that these are not exact matches of the real detectors but are representations of the types of detectors. The differences can be accounted for as follows. The pixel pitch of the simulated CR detectors (70 μm) is larger than the real CR systems (50 μm) and so there are differences in the range of spatial frequencies that contribute to the image. Noise at spatial frequencies not present for a 70 μm detector were not included in the noise of the simulated CR detectors and so there was less high frequency noise in the simulated images. Another difference between the real systems and the simulated systems is that the anti-scatter grid used by Hologic has been applied to the other detectors and the amount of scatter in the images was unchanged during the conversion. The Hologic Dimensions system uses a high transmission cellular (HTC) grid that has been shown to be particularly effective in reducing scatter [22] and so the simulated CR images will contain less scatter than images from real CR systems using a conventional linear grid. This may partially explain the difference between the simulated and real results for CR. The comparison between the 4-detector observer study and the CDMAM results remains valid as the same image degradation process was used for both parts of the study. An advantage of this approach is that the only difference between the arms of the study is the detectors.
There was a significant non-zero gradient in the relationship between the FoM for calcifications clusters (p=0.027) and threshold gold thickness. Our study clearly indicates that the detection of calcification clusters in an observer study correlates well with the results of a contrast detail test using the CDMAM phantom. The difference between the study arms was not simply a change in the magnitude of noise due to dose reduction but it also included differences in the noise texture, blurring and glare. There is no particular reason for the relationship to be a straight line as the FoM is based on non-linear statistics. This correlation observed is similar to that found by Warren et al [9]. However, there are some important distinctions between the two studies. This latest study used improved simulation methods [12], used images of both breasts, and a wider range of cancer types [13], improved reporting software [23] and more detector types. In Warren et al [9] the images were viewed in a de-magnified mode that showed the whole breast, with an electronic magnification glass available that showed one image pixel per detector pixel. In the 4-detector observer study [10] mammograms of both breasts were reviewed and the hanging protocol was closer to clinical practice by including quadrant zoom which allowed the whole breast to be seen at full magnification by reviewing several quadrants as is common practice in screening. Most importantly, the study question asked about recall and a likelihood of malignancy, which is a closer to the reporting task, than Warren et al’s [9] study where the study question asked about the observers’ confidence that the lesion marked was a calcification cluster. It is interesting to note how good the relationship is between the FoM and the threshold gold thickness even though the images were from the four detector types which have quite different detector noise patterns, sharpness and glare. This may indicate that the results can be generalised to other detectors and doses.
There is an inverse relationship between the FoM for non-calcification lesions and threshold gold thickness, but the gradient is not significantly different from zero (p=0.11). Previous work [4–7] indicated that the increased noise associated with lower doses would not affect the detection of such lesions larger than 1 mm but may affect their interpretation. Mackenzie et al [10] demonstrated that detection of non-calcification lesions is dependent on the detector type. Both CR detectors investigated had significantly lower detection rates for non-calcification lesions than the two digital radiography (DR) detectors investigated. In addition, large differences between detectors for the detection of invasive cancers (mostly non-calcification lesions), which are generally larger than 1 mm, have been demonstrated in the literature from real screening programmes. Chiarelli et al [24] showed a drop of 28% in the detection rate of invasive cancers for CR PIP compared to DR but made no test on the statistical significance of this drop. Séradour et al [25] showed a non-significant 16% drop in invasive cancer detection rate for CR PIP. Interestingly Bosmans et al [26] showed a non-significant 2% increase in invasive cancer detection for CR compared to DR, but this was achieved using a 60% higher dose for CR. It should be noted that in that study the detection of calcification clusters was still 25% lower for CR than DR (non-significant difference). While caution must be taken in extrapolating virtual studies to real screening, Mackenzie et al [10] estimated a significant drop of 11% in the detection of non-calcification lesions by CR detectors compared to DR detectors at a mean glandular dose of 1.18 mGy. This would indicate that at least some of the reported difference in cancer detection between CR and DR systems in screening [24,25] is due to the image quality associated with the detectors. It was possible to find significant differences in the 4-detector observer study [10] as the effects of confounding factors found in retrospective studies were minimised.
In the 4-detector observer study the background structures were the same between the study arms and so it is not the pattern of the structure that affects the results. The inserted masses used in four earlier simulation studies [4–7] were simple rounded lesions, while the real non-calcification lesions and invasive cancers used in later studies [10,24–26] covered a wide range of appearances: masses (with and without spiculations), distortions and focal asymmetries. Larger differences in detection were found in the studies using real non-calcification lesions, which may be due to real cancers having some fine details such as spiculations, associated calcification and distorted tissue, which were not seen in the simulated masses. Any fine detail will be adversely affected by the poorer MTF associated with CR, which is partly due to the presence of significant amounts of glare. It is clear that the detection of non-calcification lesions is affected by the quality of the clinical images. However, previous publications [4–7] indicated that the detection of these types of lesions is more dependent on the background structure rather than noise from the detector, and so it is not surprising that there is a weak but non-significant relationship between the threshold gold thickness and the FoM for non-calcification lesions. Nevertheless, it was important to include the non-calcification lesions in this study to understand how variations in the standard measures of image quality affect the detection of all types of cancers. In fact the absence of a significant gradient in the correlation found in the present study does not mean that a relationship between image quality measures and the detection of non-calcification lesions does not exist. It probably means that the effect is not large enough to be significant in our study and perhaps is more complex than a simple correlation. Clearly, the detection and classification of non-calcification lesions combines a number of features and so the use of a simple threshold contrast phantom cannot easily predict the effect of variations in image quality on the detection of non-calcification lesions.
The FoM results presented here have been compared to the threshold gold thicknesses of 0.25 mm diameter disks as this is a relevant size for calcifications [17] and for small detail detection in general. There are no detail sizes in the CDMAM phantom relevant to the overall size of the non-calcification lesions but the small details are relevant to fine details of these lesions and their associated calcifications and so the non-calcification lesion FoMs were also compared with the 0.25 mm diameter. However, it is noted that the same conclusions were reached when using other diameters of gold disk for comparison with the detection of both calcifications and non-calcification lesions. Therefore only the results for 0.25 mm disks have been presented.
The evidence presented here indicates that a system performing just above the minimum acceptable image quality level in European guidelines will result in reduced cancer detection rates compared to systems performing at the achievable level or better. We have shown that some of the detectors investigated may only reach the achievable level when the dose is increased and in the case of powder phosphor CR, increased beyond the dose limits. The supplement to the 4th edition of the European guidelines [2] emphasised that systems should be set up to the achievable level or better. This work provides further evidence of the importance of meeting the achievable image quality levels recommended in the European guidelines. Current image quality standards and their application should be reviewed in the light of these results and recent data on cancer detection in screening with different imaging technologies.
The image quality measurements used here and described in European Guidelines do not address the possible impact of image processing on cancer detection. In the 4-detector observer study all the images were processed using the same image processing package (Agfa Healthcare ‘MUSICA2’). This processing was designed to be appropriate for a wide range of image qualities but it may not have been perfectly adapted for each type of detector in the trial. Research into the impact of different types of image processing on cancer detection has so far indicated that it has a small effect on calcification detection but little effect on the detection of non-calcification malignant lesions [27,28].
CONCLUSIONS
There is a strong link between the clinical effectiveness of mammography for the task of detecting calcification clusters and the image quality measurement and standards in the European Guidelines. There is a weak link for non-calcification lesions. Systems operating at the minimum acceptable limit for image quality may have unacceptably low cancer detection rates and in the light of this evidence, the European image quality standards should be reviewed with a view to raising them.
Calcification cluster detection is related to image quality measured by CDMAM phantom
CDMAM tests discriminate between clinically acceptable and unacceptable systems
Image quality standards in European Guidelines need reviewing
Acknowledgments
This work is part of the OPTIMAM2 project and is supported by Cancer Research UK (grant, number: C30682/A17321). We thank our colleagues from the Radiation Protection Section, of the Medical Physics Department at the Royal Surrey County Hospital for the collection of CDMAM images.
Footnotes
Publisher's Disclaimer: This is a PDF file of an unedited manuscript that has been accepted for publication. As a service to our customers we are providing this early version of the manuscript. The manuscript will undergo copyediting, typesetting, and review of the resulting proof before it is published in its final citable form. Please note that during the production process errors may be discovered which could affect the content, and all legal disclaimers that apply to the journal pertain.
Contributor Information
Lucy M. Warren, Email: Lucy.Warren@nhs.net.
Matthew G. Wallis, Email: matthew.wallis1@nhs.net.
Rosalind M. Given-Wilson, Email: Rosalind.Given-Wilson@stgeorges.nhs.uk.
Julie Cooke, Email: cookejulie@hotmail.com.
David R. Dance, Email: daviddance@nhs.net.
Dev P. Chakraborty, Email: dpc10ster@gmail.com.
Mark D. Halling-Brown, Email: mhalling-brown@nhs.net.
Padraig T. Looney, Email: padraig.looney@nhs.net.
Kenneth C. Young, Email: ken.young@nhs.net.
References
- 1.European Commission. EUREF. 4. European Commission; Brussels, Belgium: 2006. European guidelines for quality assurance in breast cancer screening and diagnosis. [Google Scholar]
- 2.European Commission. EUREF. 4. European Commission; Brussels, Belgium: 2013. European guidelines for quality assurance in breast cancer screening and diagnosis. Supplements. [Google Scholar]
- 3.Young KC, Alsager A, Oduko JM, Bosmans H, Verbrugge B, Geertse T, et al. Evaluation of software for reading images of the CDMAM test object to assess digital mammography systems. Proc SPIE. 2008;6913:69131C-1–11. [Google Scholar]
- 4.Kotre CJ. The effect of background structure on the detection of low contrast objects in mammography. Br J Radiol. 1998;71(851):1162–1167. doi: 10.1259/bjr.71.851.10434911. [DOI] [PubMed] [Google Scholar]
- 5.Huda W, Ogden KM, Scalzetti EM, Dance DR, Bertrand EA. How do lesion size and random noise affect detection performance in digital mammography? Acad Radiol. 2006;13(11):1355–1366. doi: 10.1016/j.acra.2006.07.011. [DOI] [PubMed] [Google Scholar]
- 6.Saunders RS, Jr, Baker JA, Delong DM, Johnson JP, Samei E. Does image quality matter? Impact of resolution and noise on mammographic task performance. Med Phys. 2007;34(10):3971–3981. doi: 10.1118/1.2776253. [DOI] [PubMed] [Google Scholar]
- 7.Samei E, Saunders RS, Jr, Baker JA, Delong DM. Digital mammography: effects of reduced radiation dose on diagnostic performance. Radiology. 2007;243(2):396–404. doi: 10.1148/radiol.2432061065. [DOI] [PubMed] [Google Scholar]
- 8.Bennett RL, Evans AJ, Kutt E, Record C, Bobrow LG, Ellis IO, et al. Pathological and mammographic prognostic factors for screen detected cancers in a multi-centre randomised, controlled trial of mammographic screening in women from age 40 to 48 years. The Breast. 2011;20(6):525–528. doi: 10.1016/j.breast.2011.05.008. [DOI] [PubMed] [Google Scholar]
- 9.Warren LM, Mackenzie A, Cooke J, Given-Wilson RM, Wallis MG, Chakraborty DP, et al. Effect of image quality on calcification detection in digital mammography. Med Phys. 2012;39:3202–3213. doi: 10.1118/1.4718571. [DOI] [PMC free article] [PubMed] [Google Scholar]
- 10.Mackenzie A, Warren LM, Wallis MG, Cooke J, Given-Wilson RM, Dance DR, et al. Breast cancer detection rates using four different types of mammography detectors. European Radiology. 2016;26(3):874–883. doi: 10.1007/s00330-015-3885-y. [DOI] [PMC free article] [PubMed] [Google Scholar]
- 11.Mackenzie A, Dance DR, Workman A, Yip M, Wells K, Young KC. Conversion of mammographic images to appear with the noise and sharpness characteristics of a different detector and x-ray system. Med Phys. 2012;39(5):2721–2734. doi: 10.1118/1.4704525. [DOI] [PubMed] [Google Scholar]
- 12.Mackenzie A, Dance DR, Diaz O, Young KC. Image simulation and a model of noise power spectra across a range of mammographic beam qualities. Med Phys. 2014;41(12):121901-1–14. doi: 10.1118/1.4900819. [DOI] [PubMed] [Google Scholar]
- 13.Halling-Brown MD, Looney PT, Patel MN, Warren LM, Mackenzie A, Young KC. Mammographic Image Database (MIDB) and Associated Web-Enabled Software for Research. In: Fujita H, Hara T, Muramatsu C, editors. Breast Imaging, 12th International Workshop, IWDM 2014. Vol. 8539. LNCS; 2014. pp. 514–519. [Google Scholar]
- 14.Dance DR, Skinner CL, Young KC, Beckett JR, Kotre CJ. Additional factors for the estimation of mean glandular breast dose using the UK mammography dosimetry protocol. Phys Med Biol. 2000;45(11):3225–3240. doi: 10.1088/0031-9155/45/11/308. [DOI] [PubMed] [Google Scholar]
- 15.Mackenzie A, Warren LM, Dance DR, Chakraborty DP, Cooke J, Halling-Brown MD, et al. Using image simulation to test the effect of detector type on breast cancer detection. Proc SPIE Medical Imaging. 2014;9037:90370I-1–14. [Google Scholar]
- 16.Chakraborty DP, Berbaum KS. Observer studies involving detection and localization: Modelling, analysis and validation. Med Phys. 2004;31(8):2313–2330. doi: 10.1118/1.1769352. [DOI] [PubMed] [Google Scholar]
- 17.Warren LM, Dummott L, Wallis MG, Given-Wilson RM, Cooke J, Dance DR, et al. Characterisation of screen detected and simulated calcification clusters in digital mammograms. IWDM 2014–2014;LNCS. 8539:364–371. [Google Scholar]
- 18.Young KC, Oduko JM. NHSBSP. 2012. Technical evaluation of Hologic Selenia dimensions 2-D digital breast imaging system with software version 1.4. 2. Equipment report 1201. [Google Scholar]
- 19.Young KC, Oduko JM, Gundogdu O, Alsager A. NHSBSP. 2008. Technical evaluation of GE Essential full field digital mammography system. Equipment report 0803. [Google Scholar]
- 20.Young KC, Oduko JM, Asad M. NHSBSP. 2009. Technical evaluation of agfa DX-M Mammography CR reader with HM5.0 needle image plate. Equipment report 0905. [Google Scholar]
- 21.Young KC, Oduko JM. NHSBSP. 2007. Technical evaluation of the Kodak DirectView Mammography computerised radiography system using EHR-M2 plates. Equipment report 0706. [Google Scholar]
- 22.Gray JE, Princehorn JA. White Paper. 2004. HTC Grids Improve Mammography Contrast. W-BI-HTC (9/04) [Google Scholar]
- 23.Looney PT, Mackenzie A, Young KC, Halling-Brown MD. MedXViewer: an extensible web-enabled software package for medical imaging. Proc SPIE. 2014;9037:90371K-1–7. [Google Scholar]
- 24.Chiarelli AM, Edwards SA, Prummel MV, Muradali D, Majpruz V, Done SJ, et al. Digital compared with screen-film mammography: performance measures in concurrent cohorts within an organized breast screening program. Radiology. 2013;268(3):684–693. doi: 10.1148/radiol.13122567. [DOI] [PubMed] [Google Scholar]
- 25.Séradour B, Heid P, Estève J. Comparison of direct digital mammography, computed radiography and screen film in the French national breast screening program. Am J Roentgenol. 2014;202:229–236. doi: 10.2214/AJR.12.10419. [DOI] [PubMed] [Google Scholar]
- 26.Bosmans H, De Hauwere A, Lemmens K, Zanca F, Thierens H, Van Ongeval C, et al. Technical and clinical breast cancer screening performance indicators for computed radiography versus direct digital radiography. Eur Radiol. 2013;23:2891–2898. doi: 10.1007/s00330-013-2876-0. [DOI] [PubMed] [Google Scholar]
- 27.Zanca F, Jacobs J, Van Ongeval C, Claus F, Celis V, Geniets C, et al. Evaluation of clinical image processing algorithms used in digital mammography. Med Phys. 2009;36(3):765–775. doi: 10.1118/1.3077121. [DOI] [PubMed] [Google Scholar]
- 28.Warren LM, Given-Wilson RM, Wallis MG, Cooke J, Halling-Brown MD, Mackenzie A, et al. The effect of image processing on the detection of cancers in digital mammography. Am J Roentgenol. 2014;203(2):387–393. doi: 10.2214/AJR.13.11812. [DOI] [PubMed] [Google Scholar]


