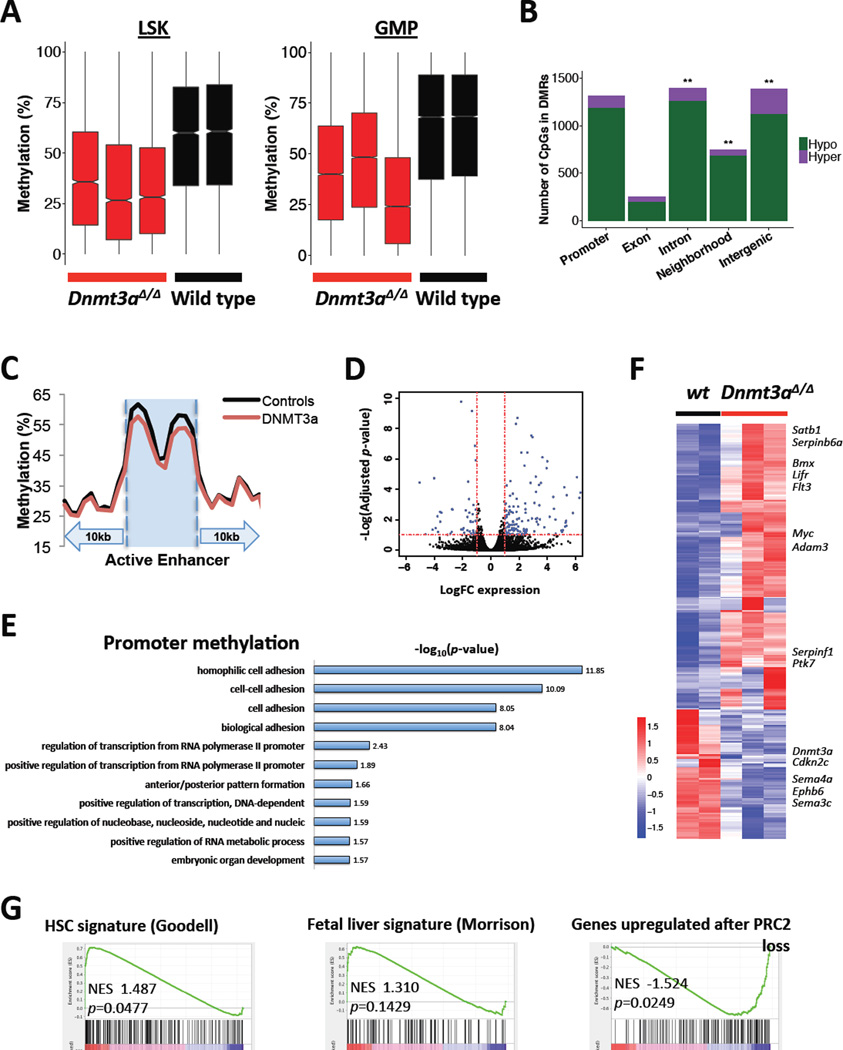
Figure 6. ERRBS DNA methylation and gene expression profiling identifies genomic features dysregulated by Dnmt3a loss.
A. Dnmt3a-null LSK and GMP cells show overall methylation loss relative to wild-type in differentially methylated regions (DMRs).
B. CpGs contained in DMRs are enriched within introns, gene neighborhoods, and intergenic regions. CpGs with lower %methylation in Dnmt3a-null GMP cells compared to wild-type are defined as hypomethylated, and those with greater methylation in Dnmt3a-null GMP cells as hypermethylated (**, genomic compartments enriched for DMR-contained CpGs relative to other regions of the genome, Fisher’s exact test, one-tailed, p<0.01).
C. Dnmt3a-null GMPs show methylation loss at GMP active enhancers relative to wild-type. GMP active enhancers ± 10kb were divided into 30 bins and the average methylation value in each was plotted.
D. Differential expression of genes covered by RNA-sequencing shows preferential upregulation of a subset of genes in Dnmt3a-null GMPs compared to wild-type controls. Dotted lines represent significance cutoffs set at ±1 Log(FC expression) (vertical) or −1 Log(adjusted p-value) (horizontal).
E. List of gene ontology terms by DAVID functional annotation tool derived from DMCs mapping to gene promoters in GMP cells from Dnmt3a-null and control animals.
F. Heatmap of differentially expressed genes (adjusted p<0.1) based on RNA-sequencing of GMPs derived from Dnmt3a-null and wild-type control animals, z-score scale.
G. GSEA plots showing enrichment of the HSC gene signature36, modified fetal liver HSC signature37, and PRC2_EED_UP.V1_UP51, in Dnmt3a-null GMPs compared to wild-type controls.

