

Abstract
Background
The clinical use of doxorubicin is limited by cardiotoxicity. Histopathologic changes include interstitial myocardial fibrosis and appearance of vacuolated cardiomyocytes. Whereas dysregulation of autophagy in the myocardium has been implicated in a variety of cardiovascular diseases, the role of autophagy in doxorubicin cardiomyopathy remains poorly defined.
Methods and Results
Most models of doxorubicin cardiotoxicity involve intraperitoneal injection of high-dose drug, which elicits lethargy, anorexia, weight loss, and peritoneal fibrosis, all of which confound the interpretation of autophagy. Given this, we first established a model that provokes modest and progressive cardiotoxicity without constitutional symptoms, reminiscent of the effects seen in patients. We report that doxorubicin blocks cardiomyocyte autophagic flux in vivo and in cardiomyocytes in culture. This block was accompanied by robust accumulation of undegraded autolysosomes. We go on to localize the site of block as a defect in lysosome acidification. To test the functional relevance of doxorubicin-triggered autolysosome accumulation, we studied animals with diminished autophagic activity due to haploinsufficiency for Beclin 1. Beclin 1+/− mice exposed to doxorubicin were protected in terms of structural and functional changes within the myocardium. Conversely, animals over-expressing Beclin 1 manifested an amplified cardiotoxic response.
Conclusions
Doxorubicin blocks autophagic flux in cardiomyocytes by impairing lysosome acidification and lysosomal function. Reducing autophagy initiation protects against doxorubicin cardiotoxicity.
Keywords: autophagy, cardiomyocyte, doxorubicin, chemotherapy, cardiotoxicity
Introduction
Doxorubicin is an efficacious and commonly used chemotherapeutic agent. However, its clinical use is limited due to dose-dependent cardiotoxicity1, 2. This toxicity is a particular concern in children with cancer, where doxorubicin-associated cardiomyopathy can emerge many years following therapy.
Numerous studies have probed molecular mechanisms of doxorubicin cardiomyopathy3. As a result, a number of molecular elements have been implicated in the pathogenesis of doxorubicin cardiotoxicity, including DNA damage4, transcriptome alterations4, mitochondrial iron accumulation5, mitochondrial damage6, and accumulation of reactive oxygen species (ROS)7. However, a single, unifying model of pathogenesis remains elusive.
Autophagy is a highly conserved mechanism of intracellular protein and organelle recycling. In many contexts, autophagy participates in the cellular response to the same events triggered by doxorubicin, such as redox injury and mitochondrial damage. Given this, there is clear interest in understanding whether alterations in autophagic flux impact the cardiomyocyte response to doxorubicin.
Previous studies addressing this question have resulted in conflicting interpretations, with doxorubicin-induced autophagy reported to be either increased8–12 or decreased10, 13, 14, based on both in vivo and in vitro analyses. Here, we addressed the role of cardiomyocyte autophagy in doxorubicin cardiotoxicity based on a novel model of low-dose doxorubicin treatment that results in a modest but progressive cardiomyopathy. We uncover a doxorubicin-induced defect in autophagic flux that may explain the earlier conflicting interpretations of autophagic flux.
Methods
In vivo model of chronic doxorubicin cardiomyopathy
C57/B6 mice were maintained on a 12-hour light/dark cycle from 6 AM to 6 PM. All protocols were approved by Institutional Animal Care and Use Committee of University of Texas Southwestern Medical Center. Eight to nine-week-old mice were injected via tail vein with doxorubicin (5 mg/kg) or normal saline once weekly for 4 weeks. Ventricular size and function were examined in acclimatized, unanesthetized mice by echocardiography (Vevo 2100, MS400C scanhead) 6 days after each injection and 4 weeks after the final injection.
To assess autophagic flux by Western blot, Bafilomycin A1 (BafA1, 1.5 mg/kg IP) was administered to mice 2 hours before sacrifice. To decrease variability, mice were caged individually one day before sacrifice; food was removed 1 hour before BafA1 injection. Moreover, mice were sacrificed at the same time of day to limit circadian variability of autophagy.
Cell culture
Neonatal rat ventricular myocytes (NRVM) were isolated from 1- to 2-day-old Sprague-Dawley rats as previously described15. Briefly, ventricles were harvested and digested. Fibroblasts were cleared by pre-plating the cell suspension for 2 hours. Cardiomyocytes were then plated at a density of 1,250 cells per 1 mm2 in plating medium containing 10% fetal bovine serum with 100 μM bromodeoxyuridine. The culture contained ≈95% cardiomyocytes (data not shown). Twenty-four hours after plating, NRVM were maintained in NRVM culture medium (DMEM high glucose and Medium 199 in 3:1 ratio) containing 3% fetal bovine serum. On the fourth day after plating, experiments were initiated.
Adult rat ventricular myocytes (ARVM) were isolated and cultured as previously described16. Four hours after plating, ARVM were maintained in culture medium (DMEM supplemented with 1x ITS, 10 mM 2,3-butanedione monoxime and 100 U/mL penicillin-streptomycin). On the second day after plating, experiments were initiated.
Cardiomyocyte differentiation from H9 human embryonic stem cells was performed as previously reported17, 18. Briefly, embryonic stem cells (H9 cell line) were maintained on matrigel in mTeSR culture medium. When H9 cells reached 85–90% confluency, the medium was changed to RPMI 1640 with B27 supplement, minus insulin (Life Technologies) (day 0 to 8), supplemented with CHIR99021 (6 μM, Selleckchem) for the first 48 hours, and IWR-1 (5 μM, Sigma) on day 4 for 48 hours. On day 8, the medium was switched to RPMI 1640 with B27 supplement, and the cells were metabolically selected for 10 days. Then, cells were replated and used for experiments after day 30. H9c2 and C2C12 cells were cultured in Hyclone high glucose DMEM supplemented with 10% fetal bovine serum.
Intracellular ATP/Cell survival Measurement
The CellTiter-Glo Luminescent Viability Assay kit (Promega) was employed according to the manufacturer’s protocol. This assay is based on measurement of intracellular ATP levels, which correspond to the number of metabolically active cells in culture.
Cellular glutamine measurement
After doxorubicin treatment (24h), NRVM were washed twice with PBS and digested with trypsin. Cell numbers were then counted, pelleted, and lysed in T-PER (Thermo). Glutamine levels were measured in the resulting cell lysates using an enzymatic kit (Sigma-Aldrich, GLN-1KT).
Leucine uptake measurement
We treated NRVM with doxorubicin or vehicle (24h). In the last hour of treatment, the cells from both treatment groups were incubated with 1 μCi/mL [3H]-leucine (Perkin-Elmer). Cells were then washed twice with cold PBS and lysed with 0.5 N NaOH for 6 hours. We next neutralized the lysate with HCl and mixed it with scintillation solution. Relative leucine uptake during the 1-hour period after doxorubicin/vehicle treatment was then calculated (counts per minute).
Immunoblot analysis
Ventricular tissue (10–30 mg) was homogenized in 700 μL T-PER lysis buffer (Thermo) supplemented with protease inhibitors and phospho-STOP (Roche). Lysates were centrifuged at 8,000g (15 min), and the supernatant was used for immunoblotting. For NRVM, cells were washed once with cold PBS and lysed with T-PER buffer supplemented with protease inhibitors and phospho-STOP. Protein concentration was measured by Bradford assay (Bio-Rad). Protein lysates (10–15 μg) were loaded for electrophoresis and transferred to nitrocellulose membrane. Then, the membrane was processed for immunoblotting and scanning using an Odyssey scanner (LI-COR).
RNA isolation and PCR analysis
Total RNA was isolated from ventricular tissue using the Total RNA Fatty and Fibrous Tissue Kit (Bio-Rad). A total of 300 ng RNA was used for reverse transcription and subsequent real-time qPCR analysis (Roche). All primer sequences are provided (Supplemental Table 1).
Long-lived protein degradation assay
Our protocol was modified from one previously described19. To label intracellular proteins, NRVM were incubated with culture medium supplemented with 0.5 μCi/mL of leucine, L-[3,4,5 3H(N)]- (specific activity 112 mCi/mmol) for 48 hours at 37°C. Unincorporated radioactive leucine was cleared by washing the cells three times with PBS. NRVM were subsequently incubated for 24 hours with culture medium supplemented with 20 mM leucine (Sigma-Aldrich). The cells were then treated with saline or doxorubicin overnight. Next, medium was removed, and NRVM were incubated for 3 hours in either EBSS to stimulate autophagy or with culture medium. Bafilomycin A1 was added as a positive control.
At the end of the treatment, 100% trichloroacetic acid (TCA) was added to the supernatant medium to a final concentration of 10%. The mixture was precipitated overnight followed by centrifuging for 10 minutes at 2,000 rpm (4°C). The acid-soluble radioactivity was measured by liquid scintillation counting using complete counting cocktail (Research Products International Corp). The cells were washed twice with cold PBS, and protein was precipitated with 10% TCA (30 minutes, 4°C). The precipitant was then washed twice with 95% ethanol and dissolved in 0.5 M NaOH at 37°C overnight. On the next day, 0.5 M HCl was added to neutralize NaOH. Radioactivity was measured by liquid scintillation counting. The rate of long-lived protein degradation was calculated from the ratio of the acid-soluble radioactivity in the medium to that in the acid-precipitated cell fraction.
Lysosome-enriched cell fraction isolation
Our protocol was modified from one previously described20. Cells were washed twice with cold PBS and then harvested in isotonic buffer (200 mM mannitol, 70 mM sucrose, 1 mM EGTA, 10 mM HEPES, pH 7.5). Cytoplasmic membranes were disrupted by passing the cells through a G25 needle 50 times. Debri and nuclei were pelleted by centrifuging at 2,000 rpm for 10 minutes (4°C). The supernatant was next centrifuged at 10,000×g for 35 minutes to pellet lysosome-enriched components. Pellets were resuspended in the isotonic buffer, and lysosomal membranes were disrupted 3 times by freeze-thaw. The supernatant was further spun at 100,000×g for 1 hour to eliminate microsomes. The final supernatant was collected as the cytosolic fraction.
Cathepsin activity
Cathepsin B and cathepsin L activities in living cardiomyocytes were measured using the Magic Red Cathepsin B/L activity kit (Immnochemistry Technologies). Using BD FACSCanto II, Cresyl Violet fluorescence was excited using a 561 nm laser, and signal was collected with a 610 nm filter. Fluorescence from doxorubicin was collected with excitation at 488 nm and emission at 710 nm. Geometric mean of the fluorescence signal from Ex/Em 561/610 nm was calculated and corresponded to cathepsin B or cathepsin L activity.
For in vitro cathepsin B/L activity measurements, we employed a method described previously20. Lysosome-enriched compartments were isolated as described earlier. Protein concentration was measured by Bradford assay, and 5 μg protein lysates from the lysosomal fraction were added to a total of 200 μL reaction buffer (50 mM sodium acetate, 8 mM EDTA, 8mM dithiothreitol, pH 5.0). Cathepsin B+L activity was measured by FLUOstar OPTIMA microplate reader (BMG Labtech, excitation 380 nm, emission 410±20 nm) after being incubated with the substrate Z-Phe-Arg-AMC (50 μM, Enzo life sciences) for 20 minutes (37°C). Cathepsin B inhibitor CA-074 (5 μM, Toris Biosciences) was added in parallel samples to measure cathespin L activity. The difference between the two readings was calculated as cathepsin B activity.
Lysosomal pH measurement
For qualitative measurement of lysosomal pH, cells were loaded with 2 μM LysoSensor Green DND-189 for 30 minutes (37°C). Then, cells were washed with PBS three times and trypsinized for flow cytometry analysis (BD FACS scan, FL1 fluorescence, 10,000 cells collected for each sample).
For quantitative measurement of lysosomal pH, methods were modified from those previously described21. Briefly, NRVM were plated in 35 mm MatTek dishes (MatTek) and loaded with 100 μg/mL Dextran, Oregon Green 514 for 2 days before drug treatment. At the end of doxorubicin treatment, the cells were washed with PBS three times and incubated with physiological buffer (136 mM NaCl, 2.5 mM KCl, 2 mM CaCl2, 1.3 mM MgCl2, 5 mM glucose, 10 mM HEPES pH 7.4) for 1 hour (37°C) before imaging. Images were acquired using an Andor Spinning Disk confocal microscope with an Apo TIRF 60x/1.49 NA Oil lens, Nikon Ti stand and Nikon Perfect Focus system. Dextran, Oregon Green 514 was excited at 445 nm and 488 nm; the emitted light was selected with a 525 ± 40 nm filter and captured by an Andor iXon Ultra EMCCD camera. Image acquisition was performed using Metamorph v7.8.6.0. To create a calibration curve, cells were sequentially bathed in isotonic K+ solutions (145 mM KCl, 10 mM glucose, 1 mM MgCl2, and 20 mM HEPES) with pH ranging from 4.0–6.5, and containing 10 μg/mL nigericin (Sigma). 488/525 and 445/525 fluorescence of each cell was analyzed (Image J Software), and the 488/445 emission fluorescence ratios were plotted as a function of pH fitted to a Boltzmann sigmoid using Prism (GraphPad Software). The ratios of samples were interpolated using the calibration curve. Measurements were performed in 4 independent experiments with 100–120 cells in each treatment group.
Lysosomal reacidification assay
For the lysosomal re-acidification assay, cells grown on coverslips were loaded with Dextran, Oregon Green 514 and treated with normal saline or doxorubicin as described above. Cells were then washed with PBS three times and incubated with baseline buffer modified from previous protocols21 (90 mM K glutamate, 50 mM KCl, 20 mM HEPES, 10 mM glucose, 1 mM EDTA, pH 7.4). Ratiometric fluorescence recordings were performed using the PTI (Photon Technology International) Fluorescence Imaging System (Birmingham, NJ) with an automated fluorescence microscope and CCD camera. The glass coverslip was inserted into the bottom of a perfusion chamber, and images were acquired by exciting Dextran, Oregon Green 514 alternately at 440 and 490 nm, and recording emitted fluorescence at 510 nm every 10 seconds. The ratio of 490/440 was calculated and represented as relative lysosomal pH. Cells were initially perfused in baseline buffer, and signals were recorded for 5 minutes. Lysosomes were then alkalinized by incubating cells with alkalization buffer (baseline buffer supplemented with 10mM NH4Cl) for 15 minutes. Re-acidification was initiated by replacing alkalization buffer with re-acidification buffer (90 mM potassium gluconate, 50 mM KCl, 3 mM MgCl2, 20 mM HEPES, 10 mM glucose, 1 mM EDTA, pH 7.4) for another 15 minutes. Concanamycin A (500 nM, Santa Cruz) was supplemented in alkalization buffer for the last 5 minutes of the alkalization process to inhibit V-ATPase activity.
Histology and imaging
For RFP/GFP analysis, hearts were harvested from anesthetized mice and fixed overnight in 4% paraformaldehyde/phosphate-buffered saline (PFA/PBS). Following fixation, hearts were sequentially cryoprotected with overnight incubations in 10% and 18% sucrose. Next, hearts were embedded in freezing matrix (TFM, Triangle Bioscience, Durham, NC), and 8 μm frozen sections were prepared on a Leica CM3000 Cryostat (Leica Microsystems, Buffalo Grove, IL) and stored at −80°C. For NRVM, cells cultured and treated on coverslips were washed with ice-cold PBS twice and fixed with 4% PFA. Prior to imaging, slides were thawed and counterstained with Prolong-Gold antifade mounting medium (Life Technologies). Images were acquired on a Leica Microsystems TCS SP5 confocal microscope.
Detection of reactive oxygen species (ROS)
Anesthetized mice were transcardially perfused with ice-cold heparinized PBS. Hearts were dissected and cryoembedded in TFM. Frozen sections (8 μm) were prepared, and sections were stained with dihydroethidium (DHE, Invitrogen) for 15 minutes followed by sealing with Prolong Gold Antifade Mountant with DAPI. Sections were immediately examined with a Leica DM2000 epifluorescence photomicroscope. Three microscopic fields (6.00 × 104 μm2) were acquired per section, and three ventricular sections per mouse were analyzed.
Electron microscopy
Hearts were transcardially perfused and fixed with 2.5% (v/v) glutaraldehyde in 0.1 M sodium cacodylate buffer. After three washes with 0.1 M sodium cacodylate buffer, hearts were post-fixed in 1% osmium tetroxide and 0.8% K3 [Fe(CN6)]/0.1 M sodium cacodylate buffer (1 hour, RT). After three rinses with water, specimens were dehydrated with increasing concentrations of ethanol, infiltrated with Embed-812 resin, and polymerized in a 60°C oven overnight. Blocks were sectioned with a diamond knife (Diatome) on a Leica Ultracut UC7 ultramicrotome (Leica Microsystems) and collected onto copper grids, post-stained with 2% uranyl acetate in water and lead citrate. Images were acquired on a Tecnai G2 spirit transmission electron microscope (FEI) equipped with a LaB6 source (120 kV).
Echocardiography
Echocardiograms were performed on conscious, gently restrained mice (Vevo 2100 system, MS400C probe). M-mode images of the left ventricle were obtained at the level of papillary muscles. Left ventricular internal diameters at end-diastole (LVIDd) and end-systole (LVIDs) were measured from M-mode recordings. Fractional shortening (FS) was calculated (LVIDd – LVIDs)/LVIDd (%). Six representative contraction cycles were selected for analysis and average indexes (LVIDd, LVIDs, FS) were calculated for each mouse.
Reagents
Doxorubicin was purchased from LC laboratories. Other reagents were purchased as follows: sunitinib (Sigma Aldrich), paclitaxel (Sigma Aldrich), Torin 1 (Tocris Bioscience), bafilomycin A1 (LC laboratory), E64d, pepstatin (Sigma Aldrich), concanamycin A (Santa Cruz). Lysotracker Red (DND-99), lysosensor DND-189, acridine orange, Dextran, and Oregon Green 514 were purchased from Invitrogen. Antibodies: LC3 (previously developed22), p62 (Abnova), GAPDH (Fitzgerald Industries), pS6 (240/244), S6, pS6K (T389), S6K, p4EBP1, 4EBP1 (Cell Signaling), LAMP-1 (Hybridoma bank), LAMP-2 (Sigma Aldrich), ATP6V0D1, ATP6V0A2, ATPV1D, ATPV1B2 (Abcam).
Data analysis
Data were analyzed using Prism software. All data are reported as mean ± standard error of the mean. The Student t test (2-tailed) was performed to compare two groups. One-way ANOVA analysis followed by Tukey post hoc test was used to compare multiple groups. Repeated measures ANOVA and subsequent Tukey test were performed to analyze time course studies among different treatment groups; two-way ANOVA and subsequent Tukey test were performed to compare groups with different secondary treatments. A p value of less than 0.05 was considered significant.
Results
Doxorubicin inhibits cardiomyocyte autophagic flux in vivo
To study the potential clinical relevance of autophagy in chronic doxorubicin cardiomyopathy, we first set out to develop a preclinical model that mimics the response observed clinically. Our protocol involves four once-per-week intravenous administrations of low-dose doxorubicin (5 mg/kg) (Supplemental Figure 1A). This dose was selected, as the pharmacokinetics of plasma doxorubicin after one dose of 5–6 mg/kg in mice is comparable to that seen in patients after a standard dose of doxorubicin treatment (60 mg/m2)23–25. The intravenous route was favored over an intraperitoneal route for several reasons. First, intraperitoneal administration of doxorubicin elicits injury, leading to peritoneal fibrosis and consequent malaise, anorexia, weight loss and noncardiac death. Additionally, peritoneal damage is likely to impede drug absorption in ensuing injections. Furthermore, decreased food intake would significantly confound the interpretation of autophagy. Our model, on the other hand, was not marked by morbidity or elevated mortality; mice appeared healthy, consumed normal quantities of food (Supplemental Figure 1B), and gained weight normally (Supplemental Figure 1C). Meanwhile, left ventricular systolic function, tracked by serial echocardiography, manifested progressive declines, reminiscent of the subclinical myocardial dysfunction observed clinically in chronic doxorubicin cardiomyopathy (Supplemental Figure 1D). Long-term follow up revealed that cardiac function in the doxorubicin group remained depressed for at least 4 months after the last dose was given (Supplemental Figure 1D). For subsequent studies of phenotype, we focused on week 7 (4 weeks after the last dose), when cardiac function had become stable.
To evaluate for changes in autophagic flux, we first quantified markers of autophagy in control (normal saline) and doxorubicin-treated hearts. Steady-state levels of the autophagy marker LC3-II were increased at 24 hours post-doxorubicin injection, persisted to day 3, and eventually returned to baseline by 7 days (Figure 1A). Interestingly, the abundance of Beclin 1, a protein involved in autophagosome initiation, manifested similar dynamic changes upon doxorubicin treatment (Figure 1A). Levels of another protein marker of autophagy, p62/SQSTM1, also increased by 24 hours but returned to baseline by the third day (Figure 1A). However, we found that transcript levels of p62/Sqstm1 (but not Lc3b) also increased 24 hours after doxorubicin injection (Figure 1B), making it difficult to interpret changes in autophagic flux by tracking p62 protein. Of note, mRNA abundance of several autophagy-related genes, including Beclin 1 and Sqstm1/p62 also increased acutely, which likely reflects a stress response to doxorubicin (Figure 1B).
Figure 1.

Doxorubicin inhibits autophagic flux in mouse heart. (A) Temporal changes in LC3-II, p62 and Beclin 1 protein levels after one dose of doxorubicin. Hearts were harvested at different time points after IV injection of doxorubicin (5 mg/kg, DOX) or normal saline (NS). Immunoblotting of LC3, p62 and Beclin 1 in heart lysates and quantifications are shown. N = 3–5 mice per group. One-way ANOVA analysis followed by Tukey post hoc test was used to compare doxorubicin-treated animals with control animals. (B) Transcript abundance of multiple autophagy-related genes (including p62/Sqstm1) at different time points after doxorubicin treatment. N = 3–6 mice per group. One-way ANOVA analysis followed by Tukey post hoc test was used to compare doxorubicin-treated mice with control mice. (C) Doxorubicin inhibited cardiac autophagic flux. Bafilomycin A1 (1.5 mg/kg, BafA1) was administered 22 hours after one dose of doxorubicin (5 mg/kg) to assess acute autophagic changes, as well as 22 hours and 7 days after 4 serial doxorubicin injections to assess autophagic changes in a chronic doxorubicin model. Immunoblotting of LC3 is shown. N = 4–5 per group. Asterisks on the schematics point to time points of assessment of autophagic flux. Two-way ANOVA analysis followed by Tukey post hoc test was used to compare multiple groups. (D) Autophagic flux was increased in mouse hearts 4 weeks after the fourth injection of DOX. N = 6 per group. Two-way ANOVA analysis followed by Tukey post hoc test was used to compare multiple groups. *, p < 0.05; **, p < 0.01; ns, not significant.
Increases in steady-state LC3-II levels may derive from activation of autophagic flux or from downstream block of autophagic vacuole processing. To distinguish between these two possibilities, we treated mice by IP injection of Bafilomycin A1 (BafA1), an inhibitor of late-stage autophagy. We first examined autophagic flux in heart 24 hours after doxorubicin injection (5 mg/kg), which likely reflects a direct effect of doxorubicin. Treatment of control animals with BafA1 for 2 hours resulted in a significant increase in LC3-II levels, reflecting cardiac autophagic flux under basal conditions (Figure 1C). However, doxorubicin-treated animals manifested no increase in LC3-II levels with BafA1 treatment. (Figure 1C). These data suggest that the accumulation of LC3-II in doxorubicin-treated animals stems from inhibition of LC3-II turnover, implicating a block in autophagic flux.
Examination of autophagic flux both at day 22 (24 hours after the final injection of doxorubicin) and day 28 (7 days after the final injection of doxorubicin) demonstrated that the inhibition of autophagic flux persisted throughout the treatment period and at least 1 week after treatment was suspended (Figure 1C). Analysis of longer-term changes in autophagic flux (4 weeks after the last doxorubicin injection) revealed a recovery and even a stimulation of autophagic flux in the doxorubicin treated hearts (Figure 1D). We believe this change, long after cessation of drug administration, likely derives secondary to the remodeling phenotype. In summary, our data suggest that doxorubicin treatment results in a significant block of autophagic flux in heart that occurs within 24 hours of exposure and persists for at least one week after exposure. For subsequent mechanistic studies, we chose to focus on 24 hours after one single dose of doxorubicin.
We tested whether starvation, a robust trigger of autophagic flux, could rescue the block in autophagy caused by doxorubicin. Dynamic changes in LC3-II suggested that starvation triggered a strong increase in autophagic flux in the control group, and yet the flux remained suppressed in doxorubicin-treated mice (Supplemental Figure 2A). We also found that starvation induced increases in cardiac p62 transcript abundance (data not shown). Therefore, it was not surprising that p62 protein levels also increased upon starvation. However, while BafA1 treatment increased p62 levels in NS-starvation group, no such effect was seen in the doxorubicin-starvation group (Supplemental Figure 2A), again consistent with a model in which doxorubicin suppresses starvation-induced autophagic flux.
Doxorubicin-induced accumulation of cardiomyocyte autolysosomes in vivo
Autophagy is a multi-step, dynamic process. To identify the specific point within the autophagic cascade inhibited by doxorubicin, we employed an autophagic flux reporter mouse model which harbors an RFP-GFP-LC3 transgene driven by the universally expressed promoter CAG. RFP (pKa 4.5) fluorescence is stable in an acidic environment, but EGFP (pKa 5.9) fluorescence is quenched in the acidic lysosomal compartment26. As a consequence, autophagosomes (yellow) can be distinguished from autolysosomes (red), and flux can be tested directly.
Using this reporter, we examined hearts after doxorubicin treatment. Doxorubicin elicited an increase in cardiomyocyte autolysosomes with no significant change in autophagosome numbers (Figure 2A). Furthermore, BafA1, which inhibits autophagosome-lysosome fusion27, induced comparable increases in autophagosomes in both normal saline- and doxorubicin-treated groups; however, there remained a trend toward increased autolysosomes in the doxorubicin-treated group relative to controls (Figure 2A).
Figure 2.

Doxorubicin induces autolysosome accumulation in mouse heart. (A) Representative fluorescence images of heart tissue sections from CAG-RFP-GFP-LC3 transgenic mice 24 hours after one-dose DOX injection. Bafilomycin A1 (1.5 mg/kg, BafA1) was injected intraperitoneally 2 hours before sacrifice. Autophagosome (yellow puncta) and autolysosome (red puncta) numbers in heart after DOX/NS treatment were calculated. N = 4–5 hearts per group with 6 microscopic fields (14,000 μm2) per heart section analyzed. Scale bar, 20 μm. NS, normal saline. DOX, doxorubicin. HPF, high-power field. One-way ANOVA and subsequent Tukey tests were performed for analyzing autophagosome numbers and autolysosome numbers respectively, among different groups. *, p < 0.05.
From these data, we can infer two immediate conclusions. First, the comparable increase in autophagosomes after BafA1 treatment in both groups excludes the possibility that autolysosome accumulation derives from increased efficiency of autophagosome formation and autophagosome-lysosome fusion, i.e. increased autophagy. Second, doxorubicin-elicited accumulation of autolysosomes rather than autophagosomes suggests that the defect in LC3-II turnover induced by doxorubicin occurs at a point downstream of autophagosome-lysosome fusion. Consistent with this notion, transmission electron microscopic studies revealed an accumulation of vesicles containing electron-dense content in doxorubicin-treated hearts (Supplemental Figure 2B), again consistent with increased numbers of lysosomes/autolysosomes. Together, these data suggest a model in which doxorubicin blocks autophagic flux by inhibiting autolysosome turnover.
Doxorubicin inhibits autophagic flux in cultured cardiomyocytes
To test the effects of doxorubicin directly on cardiomyocytes, we treated NRVM with doxorubicin. Suppression of autophagic flux by doxorubicin was dose-dependent (Supplemental Figure 3A). It has been suggested that doxorubicin concentrations greater than 2 μM do not reflect the clinically relevant context28, so we employed doxorubicin at 1 μM. Treatment of NRVM with doxorubicin resulted in a decrease in autophagic flux within 6 hours as measured by LC3-II levels, with the maximum effect observed at 18 hours (Figure 3A). Doxorubicin decreased both p62/Sqstm1 transcript and protein levels (data not shown); despite this, lysosome inhibition with BafA1 or E46D/PepA failed to restore p62 protein levels in doxorubicin-treated NRVM (Figure 3A, Supplemental Figure 2A), lending additional credence to a model of downstream blockage of autophagic flux. Autophagy is an ATP-dependent process; however, we detected no change in cellular ATP levels within 18 hours of doxorubicin exposure, ruling out a lack of ATP as a mechanism underlying autophagy inhibition (Supplemental Figure 3B).
Figure 3.

Doxorubicin inhibits autophagic flux in cultured neonatal rat ventricular myocytes (NRVM). (A) Time-dependent blockage of autophagic flux by doxorubicin. Quantification of LC3-II/GAPDH and p62/GAPDH were analyzed in 3 independent experiments. (B) Long-lived protein degradation assay revealed that doxorubicin decreased autophagic protein degradation in NRVM. N = 3 independent experiments in duplicates. (C) Representative fluorescence images of NRVM expressing RFP-GFP-LC3 and treated with DOX for 8 hours. Nuclei were stained with DAPI. Numbers of autophagosomes and autolysosomes in each cell were quantified. N = 40–50 cells per group. Scale bar, 10 μm. (D) Representative transmission electron microscopy images of cardiomyocytes treated overnight with doxorubicin. Arrows, lysosomes/autolysosomes containing electron-dense contents; Arrowhead, autophagosome. Scale bars, 1 μm in left- and 0.5 μm right-side images, respectively. Two-way ANOVA and subsequent Tukey tests were performed for statistical analysis. *, p < 0.05; **, p < 0.01; ns, not significant.
As a second, independent assessment of autophagy, we measured long-lived protein degradation by pulse-chase analysis. Stimulation of autophagy by starvation increased long-lived protein turnover in NRVM, and this increase was inhibited in doxorubicin-treated cells (Figure 3B). Interestingly, unlike the complete suppression of BafA1-inhibitable LC3-II turnover that we observed by Western blot analysis, doxorubicin only partially blocked wholesale turnover of long-lived proteins. This suggests that doxorubicin-induced inhibition of lysosomal degradation may be partial and not complete. Regardless, these data are consistent with an effect of doxorubicin to inhibit autophagic flux in vitro.
To test for generalizability beyond NRVM, we evaluated autophagic flux in other cell types commonly employed in studying cardiomyocyte biology. We found that doxorubicin inhibited autophagic flux in adult rat cardiomyocytes, cardiomyocyte-like cells differentiated from human embryonic stem cells, and in H9c2 cells (Supplemental Figures 3C–E). By contrast, doxorubicin did not alter autophagic flux in the skeletal myoblast cell line C2C12 (Supplemental Figure 3E). In contrast with our in vivo studies, accumulation of steady-state LC3-II was not observed in doxorubicin-treated neonatal cardiomyocytes. However, despite this apparent discrepancy between the in vivo and in vitro results, suppression of autophagic flux was a common finding.
We next employed a tandem fluorescence RFP-GFP-LC3 reporter system, introduced by lentivirus infection, as an additional monitor of autophagic flux in NRVM. Consistent with our in vivo data, a significant increase in autolysosome numbers, without changes in autophagosome numbers, was observed after doxorubicin exposure (Figure 3C). Transmission electron microscopy revealed accumulation of autolysosomes in doxorubicin-treated cardiomyocytes (Figure 3D). In aggregate, our findings lend strong credence to a model in which doxorubicin inhibits autophagic flux in cultured cardiomyocytes at a point downstream of autolysosomal fusion.
mTORC1 activation is not required for doxorubicin-triggered block of autophagic flux
It is well established that mTORC1 inhibits autophagy initiation by phosphorylating ULK129. Furthermore, it has been reported that mTORC1 activity affects lysosomal biogenesis and lysosomal function30. For these reasons, we examined whether doxorubicin alters mTORC1 activity in cardiomyocytes. Western analysis of known mTORC1 targets in hearts from doxorubicin-treated mice (Supplemental Figure 4A) and in doxorubicin-treated cardiomyocytes (Supplemental Figure 4B) suggested significant stimulation of mTORC1 activity with doxorubicin treatment. We further found that doxorubicin increased mTORC1 activity even upon starvation (Supplemental Figure 4C).
As glutamine and leucine are the two major amino acids that regulate mTORC1 activity31, we measured free amino levels after doxorubicin treatment. Intracellular glutamine levels were not altered by doxorubicin (Supplemental Figure 4D), whereas free leucine levels were decreased (Supplemental Figure 4E). These findings do not, then, explain the up-regulation of mTORC1 activity elicited by doxorubicin.
We next examined whether mTOR activity per se was required for the inhibition of autophagic flux that we observed. To test this, we treated NRVM with Torin 1, a robust and specific inhibitor of mTORC1. As expected, Torin 1 blunted mTORC1 activity (Supplemental Figure 4F) and increased LC3-II/LC3-I ratios (Supplemental Figures 4G–H), suggesting an increase in autophagy. However, Torin 1 failed to rescue the inhibition of autophagic flux elicited by doxorubicin (Supplemental Figures 4G–H). This suggests that even though doxorubicin activates mTORC1, doxorubicin-elicited inhibition of autophagy is not dependent on up-regulation of mTORC1 activity. It is also worth noting that mTORC2 is an inhibitor of autophagy (both macroautophagy32 and chaperone-mediated autophagy33). Therefore, it is likely that doxorubicin’s inhibition of autophagy in cardiomyocytes is not dependent on mTORC2 activity either.
Doxorubicin inhibits lysosome function by alkalinizing lysosomal pH
Our data demonstrate that doxorubicin blocks cardiomyocyte autophagic flux and promotes accumulation of autolysosomes, suggesting that doxorubicin impairs lysosomal degradation at a point downstream of fusion. This observation, coupled with the decrease in long-lived protein turnover in doxorubicin-treated cells, led us to examine lysosomal proteolysis in these cells. To pursue this, we measured the activities of cathepsin B and cathepsin L, two important lysosomal enzymes, using substrate-based assays. Cresyl Violet (CV) fluorogenic substrates CV-(Arg-Arg)2 and CV-(Phe-Arg)2 harbor dipeptides targeted by cathepsin B and cathepsin L, respectively. Non-fluorescent themselves, both substrates are converted to red fluorescent forms after hydrolysis of the two-peptide sequences. Using flow cytometry of NRVM treated with vehicle or doxorubicin, we were able to separate the red fluorescence signal elicited by doxorubicin from red fluorescence resulting from substrate cleavage (Supplemental Figure 5A). By quantifying the signal from substrate cleavage, we found that doxorubicin triggered decreased activities of both enzymes (Figure 4A). By contrast, when we measured cathepsin B/L activities in pre-made reaction buffer (50 mM sodium acetate, 8 mM EDTA, 8 mM dithiothreitol, pH 5.0), we detected no significant decrease in enzymatic activities after doxorubicin treatment (Supplemental Figure 5B). This suggests that decreased enzymatic activity observed in doxorubicin-exposed cells was not due to declines in protein abundance or enzyme dysfunction, but rather due to changes within the lysosomal environment.
Figure 4.

Doxorubicin inhibits lysosomal acidification in NRVM. (A) Doxorubicin inhibited activities of lysosomal enzymes cathepsin B and cathepsin L in live cardiomyocytes examined by FACS. Quantifications were based on 4 independent experiments. (B) Lysotracker Red (DND-99, 100nM for 30 minutes) positive puncta in cytosol was significantly reduced after 8-hour doxorubicin treatment (the nuclear fluorescence in doxorubicin-treated NRVM derives from doxorubicin). Bafilomycin A1 treatment (50 nM for 2 hours) served as a positive control. (C) Doxorubicin decreased Lysosensor DND-189 fluorescence, determined by FACS. Bafilomycin A1 (50 nM for 2 hours) and NH4Cl (10 mM for 0.5 hour) are positive controls. N = 3 independent experiments in duplicates. (D) Doxorubicin (overnight treatment) increased lysosomal pH. Lysosomal pH was examined using Dextran, Oregon Green 514. Bafilomycin A1 and NH4Cl are positive controls. Three independent experiments with a total of 100–120 cells were examined. CtsB, cathepsin B. CtsL, cathespsin L. Scale bar, 10 μm. T-test between NS group and other treatment groups was performed for statistical analysis. *, p < 0.05; **, p < 0.01.
Next, we evaluated lysosome abundance by immunostaining for LAMP-1 and LAMP-2, two lysosome-specific markers. We observed that doxorubicin did not alter the intensity of LAMP-1 or LAMP-2 staining (Supplemental Figure 5C), suggesting that doxorubicin did not alter lysosome numbers in NRVM. However, by tracking lysosomes with LysoTracker Red, a fluorescent dye that labels acidic organelles in live cells, we observed that doxorubicin treatment significantly decreased Lysotracker Red puncta (Figure 4B). Of note, the fluorescent signals observed in doxorubicin-treated cells were mainly in the nucleus, representing fluorescence from doxorubicin itself (Figure 4B). Similar results were seen using Acridine Orange (Supplemental Figure 5D). Together, these data suggest that doxorubicin does not alter lysosome abundance, but rather lysosome acidification.
To test this further, we measured lysosomal pH qualitatively using lysosensor DND-189 and flow cytometry. DND-189 emits green fluorescence, the intensity of which increases within an acidic environment. Doxorubicin decreased DND-189 fluorescence in a time-dependent manner, suggesting that doxorubicin decreases lysosome acidity in NRVM (Figure 4C). Comparable results were noted with BafA1 and NH4Cl (Figure 4C), which are well established to decrease acidity with the lysosome compartment34, 35.
Next, we measured lysosome pH in cardiomyocytes directly using Dextran, Oregon Green 514, a pH-sensitive fluorescent dye conjugated to dextran. This reagent provides a reliable standard curve of pH within the range of 4.0 to 6.5 (Supplemental Figure 5E). As positive controls, brief treatment with BafA1 or NH4Cl increased lysosomal pH, as expected (Figure 4D). Next, we quantified lysosome pH following doxorubicin exposure, observing that doxorubicin increased lysosomal pH in NRVM from 4.6 to 5.2 (Figure 4D). Together, these data reveal that doxorubicin impairs lysosome acidification.
To test whether changes in lysosome function are specific to doxorubicin or derive nonspecifically from cytotoxicity, we first examined two other chemotherapeutic agents known to cause cardiotoxicity: sunitinib and paclitaxel. In NRVM exposed to either drug overnight, we noted either no change, or slight increases in, autophagic flux, depending on the drug concentrations applied (Supplemental Figure 5F). With drug concentrations that are more clinically relevant36, 37, we tested effects on lysosomal pH using both DND-189 and Dextran, Oregon Green 514. Although some differences were noted between the two assays, sunitinib did not increase lysosome pH. Paclitaxel marginally increased lysosomal pH from 4.6 to 4.7, a change which is unlikely to have biological significance (Supplemental Figures 5G, 5H).
Doxorubicin inhibits V-ATPase-driven lysosome acidification
The activities of most lysosomal enzymes are tightly regulated by pH38. The acidic luminal environment of the lysosome is mainly attributed to the activity of the vacuolar H+-ATPase (V-ATPase)39. To test possible effects of doxorubicin on V-ATPase-mediated lysosome acidification, lysosomes were loaded with pH-sensitive dextran and treated with doxorubicin or normal saline (NS) overnight. First, lysosomes were transiently alkalinized by NH4Cl-containing buffer, generating intracellular NH3 which rapidly diffuses across the cytoplasmic membrane and into lysosomes, where it is protonated and trapped as ammonium ion35. Next, re-acidification was initiated by removal of NH4Cl and concomitant provision of magnesium-containing buffer.
Upon withdrawal of NH4Cl, early recovery of lysosome pH was observed due to the release of hydrogen ions by NH4+ within the lysosome (Figure 5A). However, additional recovery of lysosomal pH depends on V-ATPase activity. We observed that lysosomes rapidly re-acidified to baseline in NS-treated cardiomyocytes, while cells treated with concanamycin A (CcA), a specific V-ATPase inhibitor, displayed an initial decrease in lysosomal pH, followed by a failure to re-acidify due to inhibition of V-ATPase activity (Figures 4A, 4B). Consistent with our previous pH measurements, doxorubicin-treated NRVM displayed increased lysosome pH under baseline conditions (Figures 4A, 4B). Further, failure of lysosomes to re-acidify after NH4Cl washout was observed (Figures 4A, 4B).
Figure 5.

Doxorubicin impairs V-ATPase function in NRVM. (A) Lysosome re-acidification in live cardiomyocytes after NH4Cl-induced alkalinization. Dextran, Oregon Green 514 was used to monitor relative change of lysosomal pH. Representative recordings of the fluorescence ratio of different treatment groups are illustrated. (B) Fluorescence ratios of different treatment groups were compared at different time points (t = 0 s, 1000 s, 2000 s) under basal conditions, during lysosomal alkanization, and during re-acidification. N = 22–25 cells in 5 independent experiments. Repeated measures ANOVA and subsequent Tukey post hoc tests were performed for statistical analysis. *, p < 0.05; **, p < 0.01. (C) Doxorubicin does not affect localization of V1 and V0 subunit proteins on lysosomes. Lysosome-enriched compartments were isolated from NRVM treated overnight with DOX. Immunoblotting of multiple subunits of V1V0 domains revealed no difference between NS and DOX groups. (D) Assembled V-ATPase is required for doxorubicin-induced mTORC1 activation. Knocking down of V-ATPase subunit ATP6V0D1 or ATP6V1B2, abolished doxorubicin-induced mTORC1 activation. (E) Impaired lysosomal acidification triggers oxidative injuries in NRVM. Knocking down of V-ATPase subunit ATP6V0D1 or ATP6V1B2 in NRVM increased cellular ROS as tracked by DHE staining.
These observations suggest that doxorubicin inhibits lysosome acidification through suppression of V-ATPase activity. The V-ATPase complex comprises fourteen subunits, assembled into an ATP-hydrolytic domain (V1) and a proton-translocation domain (V0). Energy from ATP hydrolysis within the V1 sector is used to transport protons into the lysosomal lumen through the V0 sector. The association/dissociation of V1 and V0 domains on lysosomes is an important regulatory mechanism of V-ATPase activity39. However, we detected no apparent changes in the assembly of V1V0 domains in doxorubicin-treated NRVM (Figure 5C).
Doxorubicin continued to induce mTORC1 activation, even in the setting of starvation (Supplemental Figure 4C, Figure 5D). Of note, published work suggests that ATP hydrolysis at the V1 domain of the V-ATPase is essential for amino acid activation of mTORC140. We observed that silencing specific V-ATPase subunits using siRNA abolished the activation of mTORC1 by doxorubicin (Figure 5D). This suggests that ATPase hydrolysis is likely intact and argues that uncoupling of V1V0 domains or dysfunction of the V0 domain may underlie suppression of V-ATPase activity in doxorubicin-treated cells.
Importantly, impaired lysosomal acidification elicited by knocking down V-ATPase components increased oxidative stress in NRVM (Figure 5E). This suggests that doxorubicin-induced V-ATPase dysfunction and lysosome relative alkalinization could lead to ROS accumulation, a common finding in doxorubicin cardiotoxicity.
Attenuated autophagy initiation protects from doxorubicin-induced cardiotoxicity
Our findings suggest that doxorubicin impairs autophagic flux by perturbing lysosomal acidification and autolysosomal processing. With no known, effective in vivo approaches to rescue late processing events in the autophagic cascade, we investigated whether autophagic initiation could alter the cardiac response to doxorubicin. Phagophore formation is governed by the class III phosphatidylinositol 3-kinase (PI3K) complex containing Beclin 1, Atg14L and VPS3441; protein levels and protein-protein binding of Beclin 1 regulate autophagy initiation42. Mice with heterozygous deletion of the gene coding for Beclin 1 (Beclin 1+/−) display decreased autophagy in multiple tissues including heart22. We capitalized on this model to examine autophagic flux in doxorubicin-treated Beclin 1+/− mice. Mice were treated with NS or doxorubicin (5 mg/kg) and sacrificed 24 hours post-injection (±2-hour BafA1 exposure). In contrast with WT mice, which displayed suppression of cardiomyocyte autophagic flux, flux was maintained in Beclin 1+/− mice after doxorubicin treatment (Figure 6A).
Figure 6. Beclin 1+/− mice.


are protected from doxorubicin cardiotoxicity. (A) Autophagic flux inhibition by doxorubicin was rescued in Beclin 1+/− mouse hearts. LC3 and p62 levels were evaluated by Western blotting in hearts 24 hours after doxorubicin (5 mg/kg) injection, with or without BafA1 treatment. N = 4 per group. Two-way ANOVA and subsequent Tukey tests were performed for statistical analysis. *, p < 0.05; ns, not significant. (B) Representative fluorescence imaging of heart tissue sections from CAG-RFP-GFP-LC3 transgenic mice or Beclin 1+/−/CAG-RFP-GFP-LC3 24 hours after DOX injection. Autophagosome (yellow puncta) and autolysosome numbers (red puncta) were quantified with 6 microscopic fields (14,000 μm2) per heart section. N = 4 mice per group. Scale bar, 20 μm. One-way ANOVA and subsequent Tukey tests were performed for analyzing autophagosome numbers and autolysosome numbers respectively, among different groups. *, p < 0.05. (C) Cardiac function was preserved in doxorubicin-treated Beclin 1+/− mice compared to WT mice. Representative echocardiograms from WT and Beclin 1+/− mice treated with NS and DOX, taken 1 day before sacrifice, are shown. N = 7–8 mice per group. Repeated measures ANOVA analysis followed by Tukey post hoc test was used to compare multiple groups at each time point. * p < 0.05, DOX-treated WT mice compared to NS-treated WT mice. # p < 0.05, DOX-treated Beclin 1+/− mice compared with DOX-treated WT mice. Scale bar, 0.1 s, 5 mm. (D) Beclin 1+/− mice showed less pathological cardiac remodeling after chronic doxorubicin treatment, examined by relative mRNA levels of fetal genes and fibrotic genes. N = 6–7 per group. One-way ANOVA analysis followed by Tukey post hoc test was used to compare multiple groups for each gene. *, p < 0.05; **, p < 0.01. (E) Doxorubicin-induced ROS formation (by DHE staining) was decreased in Beclin 1+/− mice. N = 3 mice per group. Scale bar, 100 μm. HPF, high-power field. Two-way ANOVA analysis followed by Tukey post hoc test was used to compare multiple groups. *, p < 0.05.
We tested whether Beclin 1 impacts lysosomal pH by knocking down Beclin 1 in NRVM and measuring lysosomal pH. Beclin 1 knockdown did not rescue the relative alkalinization of the lysosome triggered by doxorubicin exposure, suggesting that Beclin 1’s protective effects do not occur by means of correcting lysosomal acidifcation (Supplemental Figures 6A, 6B). Similar results were observed with Atg7 knockdown (Supplemental Figures 6A, 6B).
This, along with our other data, suggests that doxorubicin suppresses autolysosomal processing but does not completely abolish it. Thus, we posited that the intact autophagic flux in doxorubicin-treated Beclin 1+/− mice results from diminished demand on the lysosomal system after doxorubicin treatment due to decreased autophagic initiation in the heterozygous animals. To test this, we crossed Beclin 1+/− with the autophagy flux reporter mouse line CAG-RFP-GFP-LC3 and quantified the autophagic vacuoles induced by doxorubicin administration. We found that in comparison with CAG-RFP-GFP-LC3 mice subjected to doxorubicin, Beclin 1+/−/CAG-RFP-GFP-LC3 mice harbored significantly fewer autolysosomes in heart tissue (Figure 6B). These findings are consistent with a model in which Beclin 1+/− mice maintain normal autophagic flux by decreasing the demand on lysosomal processing.
Our findings suggest a model in which a downstream block in autophagic flux induced by doxorubicin contributes to cardiotoxicity. To determine whether preserved autophagic flux after doxorubicin treatment in Beclin 1 haploinsufficient mice alters doxorubicin-induced cardiac injury, we examined ventricular function in Beclin 1+/− mice exposed chronically to doxorubicin. In contrast to their WT littermates, Beclin 1+/− mice manifested preserved systolic performance after long-term doxorubicin administration (Figure 6C). In addition, Beclin 1+/− mice manifested less ventricular dilatation provoked by doxorubicin (Supplemental Table 2). Doxorubicin-elicited induction of both fetal and fibrotic genes was significantly reduced in Beclin 1+/− mice (Figure 6D). Diminished interstitial and perivascular fibrosis in Beclin 1+/− mice after doxorubicin treatment was also noted (Supplemental Figure 7A). Doxorubicin-induced ROS production was significantly reduced in Beclin 1+/− mice as assessed by dihydroethidium (DHE) staining (Figure 6E). In summary, Beclin 1+/− mice are protected from doxorubicin-induced cardiotoxicity.
Enhanced initiation of autophagy exacerbates doxorubicin cardiotoxicity
Finally, we examined the cardiac response to doxorubicin in mice with amplified stress-induced cardiomyocyte autophagy from cardiomyocyte-specific over-expression of Beclin 1 (Beclin 1 Tg mice)22. These mice manifest normal cardiac structure and function under baseline conditions but an amplified autophagic response to disease-related stress22. We first test for changes in autophagic flux in doxorubicin-treated Beclin 1 Tg mice. Beclin 1 Tg mice manifested increased autophagic initiation and flux in heart under baseline conditions, assayed as LC3-II levels by immunoblot. However, upon doxorubicin exposure, autophagic flux remained inhibited, even though no further accumulation of LC3-II was observed in Beclin 1 Tg mice in comparison to WT mice (Figure 7A).
Figure 7.


Doxorubicin cardiotoxicity is exacerbated in αMHC-Beclin 1 transgenic mice. (A) Autophagic flux in WT and αMHC-Beclin 1 transgenic (Beclin 1 Tg) mouse hearts examined by immunoblotting LC3 and p62 24 hours after doxorubicin (5 mg/kg) injection, with or without Bafilomycin A1 treatment. N = 4 per group. One-way ANOVA analysis followed by Tukey post hoc test was used to compare multiple groups. Two-way ANOVA analysis followed by Tukey post hoc test was used to compare multiple groups. *, p < 0.05; ns, not significant. (B) Representative fluorescence images of heart tissue sections from CAG-RFP-GFP-LC3 transgenic mice or αMHC-Beclin 1/CAG-RFP-GFP-LC3 mice. Quantification of autophagosome (yellow puncta) and autolysosome numbers (red puncta) was based on 6 microscopic fields (14,000 μm2) per heart section. Scale bar, 20 μm. N = 4 mice per group. One-way ANOVA analysis followed by Tukey post hoc test was used to compare multiple groups for autophagosome numbers and autolysosome numbers respectively. *, p < 0.05. (C) Cardiac function was exacerbated in doxorubicin-treated Beclin 1 Tg mice compared to WT mice. Representative echocardiograms from WT and Beclin 1 Tg mice treated with NS and DOX at week 7 were shown. Scale bar, 0.1 s, 5 mm. N = 8 mice per group. One-way ANOVA analysis followed by Tukey post hoc test was used to compare multiple groups. *, p < 0.05, DOX-treated WT mice compared to NS-treated WT mice; #, p < 0.05, DOX-treated Beclin 1 Tg mice compared with DOX-treated WT mice. *, p < 0.05; ns, not significant. (D) Beclin 1 Tg mice showed exacerbated pathological cardiac remodeling after chronic doxorubicin treatment, examined by relative mRNA levels of fetal genes and fibrotic genes. N = 6 per group. Repeated measures ANOVA analysis followed by Tukey post hoc test was used to compare multiple groups at each time point. *, p < 0.05; **, p < 0.01. (E) Doxorubicin-induced ROS formation (determined by DHE staining of hearts treated with DOX for 20 hours) was decreased in Beclin 1 Tg mice. N = 4 mice per group. Two-way ANOVA analysis followed by Tukey post hoc test was used to compare multiple groups. Scale bar, 100 μm. HPF, high-power field. *, p < 0.05.
In order to quantify autophagic flux in doxorubicin-treated heart, we crossed the Beclin 1 Tg mouse line with our autophagy flux reporter line. Here, we observed that reporter mice on the Beclin 1 Tg background harbored higher numbers of autolysosomes relative to WT, after doxorubicin treatment (Figure 7B), suggesting that Beclin 1 Tg mice have exacerbated accumulation of autolysosomes. We also noted an increase in autophagosomes in doxorubicin-treated Beclin 1 Tg mouse hearts compared with WT mice (Figure 7B).
To determine whether increased demand on lysosomal processing in Beclin 1 Tg mice resulted in increased susceptibility to doxorubicin-induced cardiomyopathy, we subjected these animals to long-term doxorubicin treatment. Serial echocardiographic analysis revealed that ventricular systolic function declined faster in Beclin 1 Tg mice after doxorubicin treatment when compared with WT mice (Figure 7C). Cardiac function remained significantly lower in these animals weeks after completion of serial doxorubicin administration (Figure 7C). Doxorubicin-treated Beclin 1 Tg mice also manifested exacerbated ventricular dilatation, more robust induction of both fetal genes and fibrotic genes (Supplemental Table 3, Figure 7D) and increased cardiac fibrosis (Supplemental Figure 7B). Beclin 1 Tg mice also harbored higher levels of ROS (Figure 7E). Together, these findings support a model in which enhanced autophagic initiation, absent amelioration of dysfunctional autolysosomal processing, exacerbates doxorubicin cardiomyopathy.
Discussion
Despite extensive studies of doxorubicin cardiomyopathy3, underlying molecular mechanisms remain elusive. Autophagy’s role in doxorubicin cardiomyopathy has been probed in recent years, but has remained a question of debate. Here, we show that doxorubicin compromises lysosomal acidification and function, thereby inhibiting autophagic flux in cardiomyocytes. This, in turn, is associated with ROS accumulation and pathological cardiac remodeling. We also provide evidence that diminishing autophagic initiation to limit the accumulation of unprocessed autolysosomes ameliorates doxorubicin cardiotoxicity. Conversely, increasing autophagosome formation without correcting the downstream block exacerbates cardiotoxicity (Figure 8).
Figure 8.
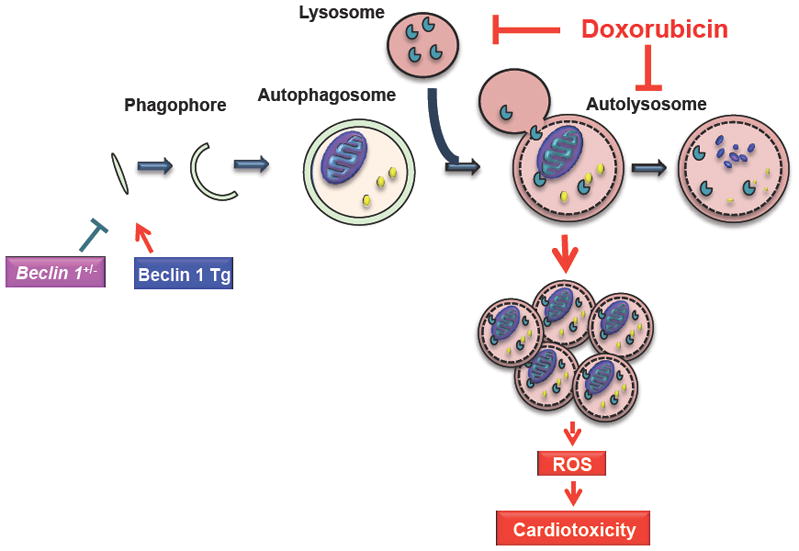
Working model. Doxorubicin, by inhibiting lysosomal acidification and lysosomal function, blocks cardiomyocyte autophagic flux. Accumulation of autolysosomes leads to increased ROS production and cardiac injury. Slowing autophagy initiation by decreasing Beclin 1 partially rescues the autophagic flux blockage and protects heart from cardiotoxicity; conversely, increasing autophagosome formation exacerbates autophagic flux inhibition and increases doxorubicin cardiotoxicity.
Doxorubicin’s impact on cardiomyocyte autophagic flux
Previous studies have addressed the possible contribution of changes in autophagic flux to doxorubicin cardiotoxicity; their findings, however, are conflicting43, 44. Autophagy has been reported to be either increased8–12 or decreased10, 13, 14, based on in vivo and/or in vitro analyses. We suggest that the discrepancies result from several factors. First, a large proportion of the literature is based on acute, high-dose doxorubicin exposure. These models do not accurately reflect the clinical scenario of chronic doxorubicin cardiomyopathy. Further, intraperitoneal administration, used in the majority of studies, causes local peritoneal injury, which contributes to malaise, anorexia, and cachexia. To address this, we developed a model which involves multiple injections of doxorubicin delivered intravenously at doses employed clinically. This, we believe, is a more faithful recapitulation of events seen clinically and avoids the numerous confounding comorbidities which plague other studies.
A second reason for discrepancies in the literature is the lack of evaluation of autophagy as a process of flux. Since autophagy is a dynamic process, a comprehensive evaluation of flux through the cascade is required, as opposed to analyzing a “snapshot in time.” Further, evidence reported here and elsewhere45 indicates that p62, a bona fide autophagic target, is affected transcriptionally by stress (including doxorubicin) and has decreased solubility in some contexts46. Indeed, a recent study highlighted the facts that increased levels of p62 could accompany the activation of autophagy, and the presence of p62 is required for autophagic activation in cardiac desminopathy47. In our hands, p62 has been less reliable than LC3 as a reflection of autophagic flux in heart. Therefore, sole reliance on the abundance of this protein is likely inadequate to query autophagic flux. Additionally, the use of the tandem fluorescence reporter RFP-GFP-LC3 as a measurement of flux alone could have led to misinterpretation of the accumulation of RFP puncta as increased flux. Our findings highlight the need to examine autophagy and flux using a number of approaches.
Finally, the time point at which autophagic flux is studied varies across studies. Our data uncovered dynamic changes in autophagic flux at different stages of chronic doxorubicin cardiomyopathy. Autophagic flux was blocked 24 hours after a single dose of doxorubicin, and remained impaired for days after serial doxorubicin administration, suggesting inhibition of autophagic flux persists well beyond doxorubicin exposure. However, four weeks after the completion of doxorubicin treatments, autophagic flux had recovered and even increased modestly. Thus, whereas inhibition of autophagic flux triggered by doxorubicin is transient, our evidence points strongly to this event as contributing to doxorubicin cardiotoxicity. In our model, progressive declines in cardiac function emerged early while autophagic flux was significantly suppressed.
Interestingly, a lack of pronounced LC3-II accumulation was observed in mice in several scenarios, viz. chronic doxorubicin treatment, food deprivation, and in Beclin 1 Tg mice treated with doxorubicin; yet, autolysosome accumulation was present. This observation raises the possibility that doxorubicin might also affect autophagic vacuole size, resulting in accumulation of smaller autolysosomes without affecting total LC3-II protein levels48. In yeast, Atg8 levels affect autophagosome size but not number. We propose that doxorubicin might affect LC3 recycling and function at the phagophore assembly site (PAS). As a consequence, when autophagic initiation is enhanced, by starvation or Beclin 1 over-expression, LC3 levels at the PAS fail to keep up, resulting in smaller autophagic vacuoles. However, despite the differences in steady-state LC3-II levels at different times (acutely after one or after 4 doses of doxorubicin) or in different conditions (starvation or Beclin 1 over-expression), suppression of autophagic flux was a uniform finding.
Defect in lysosomal digestion due to impaired lysosome acidification
An early clue to localize the locus of impairment in the autophagic cascade derived from our imaging studies, which revealed robust accumulation of autolysosomes. We went on to reveal that doxorubicin inhibits lysosomal acidification and suppresses lysosome function. In fact, an early literature reported lysosome changes in cardiomyocytes, in terms of both numbers and morphology, induced by doxorubicin1, 49. It has been reported that doxorubicin also increases lysosomal membrane leakage50, although the changes seemed to be modest. Our data, for the first time, show that doxorubicin perturbs lysosomal function via inhibition of its luminal acidity. Lysosomes are subcellular compartments that harbor a plethora of hydrolases for degradation of proteins, lipids, nucleic acids, and polysaccharides within a low pH environment. The acidic lysosomal lumen (pH 4–5) is of critical importance for the activities of most hydrolytic enzymes38, as well as movement and maturation of lysosomes51. We found that doxorubicin increases lysosomal pH from a basal level of pH 4.6 to pH 5.2. Given the sensitivity of lysosomal hydrolases to luminal pH, this relative neutralization within the lysosome is likely sufficient to interrupt downstream events in the autophagic cascade.
It has been reported in some cell types that an increase in lysosomal pH can impair the fusion of lysosomes with autophagosomes52, 53. By contrast, we observed an increase in autolysosome number triggered by doxorubicin. However, it remains controversial whether inhibition of autophagosome-lysosome fusion is solely dependent on increases in lysosomal pH. Events such as calcium release from the lysosome have been suggested to be required for autophagosome-lysosome fusion54. It is also possible that autophagosome-lysosome fusion is inhibited only when lysosomal pH elevates to a certain level. Lastly, when examining autophagic flux by tandem fluorescent LC3, green fluorescence from EGFP is not quenched when lysosome pH exceeds 6. Therefore, in some instances, the accumulation of “autophagosomes” observed might actually be autolysosomes without an optimal luminal pH. In comparison, we found that doxorubicin raises lysosomal pH to 5.2, a level of acidity sufficient to quench GFP fluorescence26, and hence only RFP fluorescence was detected.
Lysosome V-ATPase
Lysosomal acidification is dependent on the activity of the V-ATPase proton pump. To analyze V-ATPase-induced lysosomal acidification, lysosomes can be transiently alkalinized by NH4Cl or FCCP21, 55. However, lysosomes in NRVM are relatively resistant to the protonophore FCCP (1μM); protons dissipate more slowly than that reported in other cell lines (data not shown). In contrast, NH4Cl induces rapid alkalization in NRVM. Therefore, we used NH4Cl for evaluating the lysosomal re-acidification process. Our data strongly suggest that doxorubicin acts by inhibiting V-ATPase activity. However, we cannot exclude contributions from other possibilities, such as altered activities of counter ion exchangers, increased lysosomal membrane permeability to protons, and inhibition of lysosomal recycling56.
Mechanisms underlying doxorubicin-dependent inhibition of lysosome V-ATPase activity are presently unknown. We found that proton translocation via the V0 domain of V-ATPase was compromised by doxorubicin; however on the other hand doxorubicin induced mTORC1 activity that was dependent on the intact V-ATPase, suggesting V1 domain was hyperactivated by doxorubicin. Evidence collected to date suggests that doxorubicin affects V-ATPase activity through inhibiting the coupling of its two domains, V0 and V1. A mutation in vma6, Atp6v0d’s homologue in yeast, was shown to uncouple V0 and V1 activities, with compromised proton transport but intact ATPase activity57. We did not detect a change in protein levels of the V0d subunit in doxorubicin treatment. However, of note, the V0d subunit is the only protein in the V0 domain localized to the membrane periphery and hence prone to possible modification by doxorubicin, either directly or secondarily by ROS. Interestingly, it has been shown that oxidative stress can impair V-ATPase function. The proton-pumping function of V-ATPase isolated from calf brain is impaired by hydrogen peroxide58. In yeast, a commonly used model for studying V-ATPase activity, a mutant strain exists with normal V-ATPase function in a reductive environment but with impaired V-ATPase function and acidification in an oxidative environment59.
We believe it is unlikely that doxorubicin targets the V-ATPase specifically in cardiomyocytes, as opposed to lysosome proton pumps in other cells. Rather, as the cardiomyocyte is among the most highly dependent on high throughput autophagic flux60, we suggest these cells are uniquely susceptible to perturbations in downstream lysosomal processing events. For example, lack of autophagic flux might compromise the ability of cardiomyocytes to eliminate organelles injured by doxorubicin, such as mitochondria.
Impaired autophagy in doxorubicin cardiomyopathy
Blockage of autophagic flux in heart has been suggested to play an important role in chloroquine-induced cardiomyopathy61. Here, we report that doxorubicin inhibits cardiomyocyte autophagic flux by altering lysosomal function. As there is no effective means presently available to restore lysosomal function in order to rescue doxorubicin cardiotoxicity, we modified autophagic flux at the stage of cascade initiation. We employed both gain- and loss-of-function models of Beclin 1 activity to alter the rate at which autophagosomes are delivered to the lysosome.
Previous studies reported disparate conclusions regarding whether autophagy is beneficial or detrimental in doxorubicin cardiotoxicity. Lu et al8 reported that 3-methyladenine (3-MA) treatment preserved cardiac function after exposure to high-dose doxorubicin. On the other hand, several studies13, 14 reported that increasing autophagy in mice by either rapamycin or pre-fasting blunts doxorubicin-induced cardiac dysfunction. However, both starvation and pharmaceuticals, such as 3-MA and rapamycin, have a wide range of other targets62. By contrast, modulating Beclin 1 expression in cardiomyocytes is a more specific means of manipulating autophagy. Although some studies have linked Beclin 1 to apoptotic pathways63, 64, we observed minimal apoptotic activity in mouse hearts acutely after doxorubicin injection (data not shown). We further confirmed that Beclin 1 could not rescue lysosomal acidification impaired by doxorubicin in vitro (data not shown). The most plausible explanation for the cardioprotective effects of Beclin 1 haploinsufficiency remains decreased autophagic initiation. We propose a model that by slowing autophagy initiation, the demand on doxorubicin-crippled lysosomes is reduced, allowing more time for the autolysosome to process its cargo. An observation similar to ours was reported in a murine model of Pompe disease: suppressing autophagic initiation in muscle cells reduced glycogen accumulation and restored lysosomal function65. Increased cargo load within autolysosomes might further compromise lysosomal function, as seen in lysosomal storage diseases and in ageing65, 66.
While lysosomal proteolytic function is blunted by doxorubicin, it is not completely abolished. One possibility is that a decrease in demand allows for the proper processing of lysosomal content. In addition, the extent of autophagic flux perturbation correlated with the level of doxorubicin-induced ROS production and cardiac dysfunction, lending further support to the notion that restoration of autophagic flux by reducing autophagic initiation protects against doxorubicin cardiotoxicity. Interestingly, another study also pointed to potential benefit of reducing autophagic initiation and decreasing lysosomal input in attenuating cellular stress in Alzheimer disease67. In our study, whereas doxorubicin-induced inhibition of autophagic flux was short term and reversible, we suggest that the cardiomyocyte injury occurring during this period leads not only to acute cardiac dysfunction but sustained pathological remodeling.
ROS and doxorubicin cardiomyopathy
Despite controversies in this field, accumulation of excess ROS remains widely accepted as a key factor contributing to doxorubicin cardiotoxicity7. The potential sites of ROS generation by doxorubicin include mitochondria, sarcoplasmic reticulum, and cytoplasmic compartments68. On the other hand, the abundance and activity of the anti-oxidant enzymes SOD and catalase in heart are lower than in other organs69. Therefore, high levels of autophagic flux in heart might serve as an important defense mechanism against doxorubicin-induced ROS60, 70. Our findings suggest that doxorubicin impairs cardiomyocyte autophagy, therefore compromising cellular defense against ROS-induced cell injury.
At this time, mechanisms linking autolysosomal accumulation and ROS accumulation remain unclear. The source of ROS might be the defective autolysosomes themselves or dysfunctional mitochondria not effectively degraded by autophagy. Damaged mitochondria are a major source for ROS production in cardiomyocytes71. At the same time, it has been suggested that lysosomal dysfunction and substrate accumulation also promote ROS production72, 73. Intriguingly, whereas persistently high levels of intracellular ROS trigger cellular damage, it can also induce autophagosome formation70, potentially initiating a vicious cycle that promotes cell injury.
Conclusions and perspective
Findings reported here are based on a model that recapitulates the clinical reality of doxorubicin cardiomyopathy. They point to a novel mechanism of doxorubicin cardiotoxicity, viz. relative lysosome alkalinization and consequent inhibition of downstream autophagic flux. By titrating down the initiation of autophagosome initiation, doxorubicin cardiotoxicity is blunted. Together, these data uncover a novel mechanism of disease pathogenesis and point to a unique strategy of limiting myocardial injury.
Supplementary Material
Clinical Perspectives.
Doxorubicin is an efficacious and commonly used chemotherapeutic agent whose clinical utility is limited by dose-dependent cardiotoxicity. Numerous studies have probed molecular mechanisms of doxorubicin cardiomyopathy, but a single, unifying model of pathogenesis remains elusive. Autophagy is a highly conserved mechanism of intracellular protein and organelle recycling. In many contexts, autophagy participates in the cellular response to the same events triggered by doxorubicin, such as redox injury and mitochondrial damage. In fact, previous studies addressing a possible role of cardiomyocyte autophagy in doxorubicin cardiotoxicity have emerged with conflicting interpretations, with doxorubicin-induced autophagy reported to be either increased or decreased. In this report, we addressed the role of cardiomyocyte autophagy in doxorubicin cardiotoxicity based on a novel model of low-dose doxorubicin treatment that results in modest but progressive cardiomyopathy which mimics events occurring in patients. We uncover a doxorubicin-induced defect in autophagic flux that may explain the earlier conflicting interpretations of autophagic flux. Further, our findings point to a novel means of mitigating doxorubicin-elicited pathological remodeling.
Acknowledgments
We thank the Bezprozvanny lab at UT Southwestern, John Shelton, UT Southwestern Histology Core facility, UT Southwestern Imaging Core facility for assistance with the studies.
Funding Sources: This work was supported by grants from the NIH (HL-120732; HL-100401), AHA (14SFRN20510023), CPRIT (RP110486P3), and the Leducq Foundation (11CVD04), all to JAH. DL was supported by an AHA pre-postdoctoral fellowship (14PRE19770000). ZVW was supported by an AHA Scientist Development grant (14SDG18440002).
Footnotes
Disclosures: None.
References
- 1.Singal PK, Deally CM, Weinberg LE. Subcellular effects of adriamycin in the heart: A concise review. J Mol Cell Cardiol. 1987;19:817–828. doi: 10.1016/s0022-2828(87)80392-9. [DOI] [PubMed] [Google Scholar]
- 2.Lipshultz SE, Colan SD, Gelber RD, Perez-Atayde AR, Sallan SE, Sanders SP. Late cardiac effects of doxorubicin therapy for acute lymphoblastic leukemia in childhood. N Engl J Med. 1991;324:808–815. doi: 10.1056/NEJM199103213241205. [DOI] [PubMed] [Google Scholar]
- 3.Octavia Y, Tocchetti CG, Gabrielson KL, Janssens S, Crijns HJ, Moens AL. Doxorubicin-induced cardiomyopathy: From molecular mechanisms to therapeutic strategies. J Mol Cell Cardiol. 2012;52:1213–1225. doi: 10.1016/j.yjmcc.2012.03.006. [DOI] [PubMed] [Google Scholar]
- 4.Zhang S, Liu X, Bawa-Khalfe T, Lu LS, Lyu YL, Liu LF, Yeh ET. Identification of the molecular basis of doxorubicin-induced cardiotoxicity. Nat Med. 2012;18:1639–1642. doi: 10.1038/nm.2919. [DOI] [PubMed] [Google Scholar]
- 5.Ichikawa Y, Ghanefar M, Bayeva M, Wu R, Khechaduri A, Naga Prasad SV, Mutharasan RK, Naik TJ, Ardehali H. Cardiotoxicity of doxorubicin is mediated through mitochondrial iron accumulation. J Clin Invest. 2014;124:617–630. doi: 10.1172/JCI72931. [DOI] [PMC free article] [PubMed] [Google Scholar]
- 6.Suliman HB, Carraway MS, Ali AS, Reynolds CM, Welty-Wolf KE, Piantadosi CA. The co/ho system reverses inhibition of mitochondrial biogenesis and prevents murine doxorubicin cardiomyopathy. J Clin Invest. 2007;117:3730–3741. doi: 10.1172/JCI32967. [DOI] [PMC free article] [PubMed] [Google Scholar]
- 7.Singal PK, Iliskovic N. Doxorubicin-induced cardiomyopathy. N Engl J Med. 1998;339:900–905. doi: 10.1056/NEJM199809243391307. [DOI] [PubMed] [Google Scholar]
- 8.Lu L, Wu W, Yan J, Li X, Yu H, Yu X. Adriamycin-induced autophagic cardiomyocyte death plays a pathogenic role in a rat model of heart failure. Int J Cardiol. 2009;134:82–90. doi: 10.1016/j.ijcard.2008.01.043. [DOI] [PubMed] [Google Scholar]
- 9.Kobayashi S, Volden P, Timm D, Mao K, Xu X, Liang Q. Transcription factor gata4 inhibits doxorubicin-induced autophagy and cardiomyocyte death. J Biol Chem. 2010;285:793–804. doi: 10.1074/jbc.M109.070037. [DOI] [PMC free article] [PubMed] [Google Scholar]
- 10.Ding Y, Sun X, Huang W, Hoage T, Redfield M, Kushwaha S, Sivasubbu S, Lin X, Ekker S, Xu X. Haploinsufficiency of target of rapamycin attenuates cardiomyopathies in adult zebrafish. Circ Res. 2011;109:658–669. doi: 10.1161/CIRCRESAHA.111.248260. [DOI] [PMC free article] [PubMed] [Google Scholar]
- 11.Zhang Y, Kang YM, Tian C, Zeng Y, Jia LX, Ma X, Du J, Li HH. Overexpression of nrdp1 in the heart exacerbates doxorubicin-induced cardiac dysfunction in mice. PloS one. 2011;6:e21104. doi: 10.1371/journal.pone.0021104. [DOI] [PMC free article] [PubMed] [Google Scholar]
- 12.Dimitrakis P, Romay-Ogando MI, Timolati F, Suter TM, Zuppinger C. Effects of doxorubicin cancer therapy on autophagy and the ubiquitin-proteasome system in long-term cultured adult rat cardiomyocytes. Cell Tissue Res. 2012;350:361–372. doi: 10.1007/s00441-012-1475-8. [DOI] [PubMed] [Google Scholar]
- 13.Kawaguchi T, Takemura G, Kanamori H, Takeyama T, Watanabe T, Morishita K, Ogino A, Tsujimoto A, Goto K, Maruyama R, Kawasaki M, Mikami A, Fujiwara T, Fujiwara H, Minatoguchi S. Prior starvation mitigates acute doxorubicin cardiotoxicity through restoration of autophagy in affected cardiomyocytes. Cardiovasc Res. 2012;96:456–465. doi: 10.1093/cvr/cvs282. [DOI] [PubMed] [Google Scholar]
- 14.Sishi BJ, Loos B, van Rooyen J, Engelbrecht AM. Autophagy upregulation promotes survival and attenuates doxorubicin-induced cardiotoxicity. Biochem Pharmacol. 2013;85:124–134. doi: 10.1016/j.bcp.2012.10.005. [DOI] [PubMed] [Google Scholar]
- 15.Wang ZV, Deng Y, Gao N, Pedrozo Z, Li DL, Morales CR, Criollo A, Luo X, Tan W, Jiang N, Lehrman MA, Rothermel BA, Lee AH, Lavandero S, Mammen PP, Ferdous A, Gillette TG, Scherer PE, Hill JA. Spliced x-box binding protein 1 couples the unfolded protein response to hexosamine biosynthetic pathway. Cell. 2014;156:1179–1192. doi: 10.1016/j.cell.2014.01.014. [DOI] [PMC free article] [PubMed] [Google Scholar]
- 16.Xie M, Kong Y, Tan W, May H, Battiprolu PK, Pedrozo Z, Wang ZV, Morales C, Luo X, Cho G, Jiang N, Jessen ME, Warner JJ, Lavandero S, Gillette TG, Turer AT, Hill JA. Histone deacetylase inhibition blunts ischemia/reperfusion injury by inducing cardiomyocyte autophagy. Circulation. 2014;129:1139–1151. doi: 10.1161/CIRCULATIONAHA.113.002416. [DOI] [PMC free article] [PubMed] [Google Scholar]
- 17.Lian X, Zhang J, Azarin SM, Zhu K, Hazeltine LB, Bao X, Hsiao C, Kamp TJ, Palecek SP. Directed cardiomyocyte differentiation from human pluripotent stem cells by modulating wnt/beta-catenin signaling under fully defined conditions. Nat Protoc. 2013;8:162–175. doi: 10.1038/nprot.2012.150. [DOI] [PMC free article] [PubMed] [Google Scholar]
- 18.Boheler KR, Bhattacharya S, Kropp EM, Chuppa S, Riordon DR, Bausch-Fluck D, Burridge PW, Wu JC, Wersto RP, Chan GC, Rao S, Wollscheid B, Gundry RL. A human pluripotent stem cell surface n-glycoproteome resource reveals markers, extracellular epitopes, and drug targets. Stem Cell Reports. 2014;3:185–203. doi: 10.1016/j.stemcr.2014.05.002. [DOI] [PMC free article] [PubMed] [Google Scholar]
- 19.Shang L, Chen S, Du F, Li S, Zhao L, Wang X. Nutrient starvation elicits an acute autophagic response mediated by ulk1 dephosphorylation and its subsequent dissociation from ampk. Proc Natl Acad Sci U S A. 2011;108:4788–4793. doi: 10.1073/pnas.1100844108. [DOI] [PMC free article] [PubMed] [Google Scholar]
- 20.Kreuzaler PA, Staniszewska AD, Li W, Omidvar N, Kedjouar B, Turkson J, Poli V, Flavell RA, Clarkson RW, Watson CJ. Stat3 controls lysosomal-mediated cell death in vivo. Nat Cell Biol. 2011;13:303–309. doi: 10.1038/ncb2171. [DOI] [PubMed] [Google Scholar]
- 21.Steinberg BE, Huynh KK, Brodovitch A, Jabs S, Stauber T, Jentsch TJ, Grinstein S. A cation counterflux supports lysosomal acidification. J Cell Biol. 2010;189:1171–1186. doi: 10.1083/jcb.200911083. [DOI] [PMC free article] [PubMed] [Google Scholar]
- 22.Zhu H, Tannous P, Johnstone JL, Kong Y, Shelton JM, Richardson JA, Le V, Levine B, Rothermel BA, Hill JA. Cardiac autophagy is a maladaptive response to hemodynamic stress. J Clin Invest. 2007;117:1782–1793. doi: 10.1172/JCI27523. [DOI] [PMC free article] [PubMed] [Google Scholar]
- 23.Gianni L, Vigano L, Locatelli A, Capri G, Giani A, Tarenzi E, Bonadonna G. Human pharmacokinetic characterization and in vitro study of the interaction between doxorubicin and paclitaxel in patients with breast cancer. J Clin Oncol. 1997;15:1906–1915. doi: 10.1200/JCO.1997.15.5.1906. [DOI] [PubMed] [Google Scholar]
- 24.van Asperen J, van Tellingen O, Tijssen F, Schinkel AH, Beijnen JH. Increased accumulation of doxorubicin and doxorubicinol in cardiac tissue of mice lacking mdr1a p-glycoprotein. Br J Cancer. 1999;79:108–113. doi: 10.1038/sj.bjc.6690019. [DOI] [PMC free article] [PubMed] [Google Scholar]
- 25.Gustafson DL, Rastatter JC, Colombo T, Long ME. Doxorubicin pharmacokinetics: Macromolecule binding, metabolism, and excretion in the context of a physiologic model. J Pharm Sci. 2002;91:1488–1501. doi: 10.1002/jps.10161. [DOI] [PubMed] [Google Scholar]
- 26.Llopis J, McCaffery JM, Miyawaki A, Farquhar MG, Tsien RY. Measurement of cytosolic, mitochondrial, and golgi ph in single living cells with green fluorescent proteins. Proc Natl Acad Sci U S A. 1998;95:6803–6808. doi: 10.1073/pnas.95.12.6803. [DOI] [PMC free article] [PubMed] [Google Scholar]
- 27.Klionsky DJ, Elazar Z, Seglen PO, Rubinsztein DC. Does bafilomycin a1 block the fusion of autophagosomes with lysosomes? Autophagy. 2008;4:849–850. doi: 10.4161/auto.6845. [DOI] [PubMed] [Google Scholar]
- 28.Minotti G, Menna P, Salvatorelli E, Cairo G, Gianni L. Anthracyclines: Molecular advances and pharmacologic developments in antitumor activity and cardiotoxicity. Pharmacol Rev. 2004;56:185–229. doi: 10.1124/pr.56.2.6. [DOI] [PubMed] [Google Scholar]
- 29.Kim J, Kundu M, Viollet B, Guan KL. Ampk and mtor regulate autophagy through direct phosphorylation of ulk1. Nat Cell Biol. 2011;13:132–141. doi: 10.1038/ncb2152. [DOI] [PMC free article] [PubMed] [Google Scholar]
- 30.Settembre C, Zoncu R, Medina DL, Vetrini F, Erdin S, Erdin S, Huynh T, Ferron M, Karsenty G, Vellard MC, Facchinetti V, Sabatini DM, Ballabio A. A lysosome-to-nucleus signalling mechanism senses and regulates the lysosome via mtor and tfeb. EMBO J. 2012;31:1095–1108. doi: 10.1038/emboj.2012.32. [DOI] [PMC free article] [PubMed] [Google Scholar]
- 31.Jewell JL, Kim YC, Russell RC, Yu FX, Park HW, Plouffe SW, Tagliabracci VS, Guan KL. Metabolism. Differential regulation of mtorc1 by leucine and glutamine. Science. 2015;347:194–198. doi: 10.1126/science.1259472. [DOI] [PMC free article] [PubMed] [Google Scholar]
- 32.Chen S, Han Q, Wang X, Yang M, Zhang Z, Li P, Chen A, Hu C, Li S. Ibp-mediated suppression of autophagy promotes growth and metastasis of breast cancer cells via activating mtorc2/akt/foxo3a signaling pathway. Cell Death Dis. 2013;4:e842. doi: 10.1038/cddis.2013.380. [DOI] [PMC free article] [PubMed] [Google Scholar]
- 33.Arias E, Koga H, Diaz A, Mocholi E, Patel B, Cuervo AM. Lysosomal mtorc2/phlpp1/akt regulate chaperone-mediated autophagy. Mol Cell. 2015;59:270–284. doi: 10.1016/j.molcel.2015.05.030. [DOI] [PMC free article] [PubMed] [Google Scholar]
- 34.Yoshimori T, Yamamoto A, Moriyama Y, Futai M, Tashiro Y. Bafilomycin a1, a specific inhibitor of vacuolar-type h(+)-atpase, inhibits acidification and protein degradation in lysosomes of cultured cells. J Biol Chem. 1991;266:17707–17712. [PubMed] [Google Scholar]
- 35.O’Reilly DS. Increased ammoniagenesis and the renal tubular effects of potassium depletion. J Clin Pathol. 1984;37:1358–1362. doi: 10.1136/jcp.37.12.1358. [DOI] [PMC free article] [PubMed] [Google Scholar]
- 36.Rowinsky EK, Jiroutek M, Bonomi P, Johnson D, Baker SD. Paclitaxel steady-state plasma concentration as a determinant of disease outcome and toxicity in lung cancer patients treated with paclitaxel and cisplatin. Clin Cancer Res. 1999;5:767–774. [PubMed] [Google Scholar]
- 37.Kim A, Balis FM, Widemann BC. Sorafenib and sunitinib. Oncologist. 2009;14:800–805. doi: 10.1634/theoncologist.2009-0088. [DOI] [PMC free article] [PubMed] [Google Scholar]
- 38.Pillay CS, Elliott E, Dennison C. Endolysosomal proteolysis and its regulation. Biochem J. 2002;363:417–429. doi: 10.1042/0264-6021:3630417. [DOI] [PMC free article] [PubMed] [Google Scholar]
- 39.Forgac M. Vacuolar atpases: Rotary proton pumps in physiology and pathophysiology. Nat Rev Mol Cell Biol. 2007;8:917–929. doi: 10.1038/nrm2272. [DOI] [PubMed] [Google Scholar]
- 40.Zoncu R, Bar-Peled L, Efeyan A, Wang S, Sancak Y, Sabatini DM. Mtorc1 senses lysosomal amino acids through an inside-out mechanism that requires the vacuolar h(+)-atpase. Science. 2011;334:678–683. doi: 10.1126/science.1207056. [DOI] [PMC free article] [PubMed] [Google Scholar]
- 41.Choi AM, Ryter SW, Levine B. Autophagy in human health and disease. N Engl J Med. 2013;368:651–662. doi: 10.1056/NEJMra1205406. [DOI] [PubMed] [Google Scholar]
- 42.He C, Levine B. The beclin 1 interactome. Curr Opin Cell Biol. 2010;22:140–149. doi: 10.1016/j.ceb.2010.01.001. [DOI] [PMC free article] [PubMed] [Google Scholar]
- 43.Li DL, Hill JA. Cardiomyocyte autophagy and cancer chemotherapy. J Mol Cell Cardiol. 2014;71:54–61. doi: 10.1016/j.yjmcc.2013.11.007. [DOI] [PMC free article] [PubMed] [Google Scholar]
- 44.Dirks-Naylor AJ. The role of autophagy in doxorubicin-induced cardiotoxicity. Life Sci. 2013;93:913–916. [PubMed] [Google Scholar]
- 45.Jain A, Lamark T, Sjottem E, Larsen KB, Awuh JA, Overvatn A, McMahon M, Hayes JD, Johansen T. P62/sqstm1 is a target gene for transcription factor nrf2 and creates a positive feedback loop by inducing antioxidant response element-driven gene transcription. J Biol Chem. 2010;285:22576–22591. doi: 10.1074/jbc.M110.118976. [DOI] [PMC free article] [PubMed] [Google Scholar]
- 46.Klionsky DJ, Abdalla FC, Abeliovich H, Abraham RT, Acevedo-Arozena A, Adeli K, Agholme L, Agnello M, Agostinis P, Aguirre-Ghiso JA, Ahn HJ, Ait-Mohamed O, Ait-Si-Ali S, Akematsu T, Akira S, Al-Younes HM, Al-Zeer MA, Albert ML, Albin RL, Alegre-Abarrategui J, Aleo MF, Alirezaei M, Almasan A, Almonte-Becerril M, Amano A, Amaravadi R, Amarnath S, Amer AO, Andrieu-Abadie N, Anantharam V, Ann DK, Anoopkumar-Dukie S, Aoki H, Apostolova N, Arancia G, Aris JP, Asanuma K, Asare NY, Ashida H, Askanas V, Askew DS, Auberger P, Baba M, Backues SK, Baehrecke EH, Bahr BA, Bai XY, Bailly Y, Baiocchi R, Baldini G, Balduini W, Ballabio A, Bamber BA, Bampton ET, Banhegyi G, Bartholomew CR, Bassham DC, Bast RC, Jr, Batoko H, Bay BH, Beau I, Bechet DM, Begley TJ, Behl C, Behrends C, Bekri S, Bellaire B, Bendall LJ, Benetti L, Berliocchi L, Bernardi H, Bernassola F, Besteiro S, Bhatia-Kissova I, Bi X, Biard-Piechaczyk M, Blum JS, Boise LH, Bonaldo P, Boone DL, Bornhauser BC, Bortoluci KR, Bossis I, Bost F, Bourquin JP, Boya P, Boyer-Guittaut M, Bozhkov PV, Brady NR, Brancolini C, Brech A, Brenman JE, Brennand A, Bresnick EH, Brest P, Bridges D, Bristol ML, Brookes PS, Brown EJ, Brumell JH, Brunetti-Pierri N, Brunk UT, Bulman DE, Bultman SJ, Bultynck G, Burbulla LF, Bursch W, Butchar JP, Buzgariu W, Bydlowski SP, Cadwell K, Cahova M, Cai D, Cai J, Cai Q, Calabretta B, Calvo-Garrido J, Camougrand N, Campanella M, Campos-Salinas J, Candi E, Cao L, Caplan AB, Carding SR, Cardoso SM, Carew JS, Carlin CR, Carmignac V, Carneiro LA, Carra S, Caruso RA, Casari G, Casas C, Castino R, Cebollero E, Cecconi F, Celli J, Chaachouay H, Chae HJ, Chai CY, Chan DC, Chan EY, Chang RC, Che CM, Chen CC, Chen GC, Chen GQ, Chen M, Chen Q, Chen SS, Chen W, Chen X, Chen X, Chen X, Chen YG, Chen Y, Chen Y, Chen YJ, Chen Z, Cheng A, Cheng CH, Cheng Y, Cheong H, Cheong JH, Cherry S, Chess-Williams R, Cheung ZH, Chevet E, Chiang HL, Chiarelli R, Chiba T, Chin LS, Chiou SH, Chisari FV, Cho CH, Cho DH, Choi AM, Choi D, Choi KS, Choi ME, Chouaib S, Choubey D, Choubey V, Chu CT, Chuang TH, Chueh SH, Chun T, Chwae YJ, Chye ML, Ciarcia R, Ciriolo MR, Clague MJ, Clark RS, Clarke PG, Clarke R, Codogno P, Coller HA, Colombo MI, Comincini S, Condello M, Condorelli F, Cookson MR, Coombs GH, Coppens I, Corbalan R, Cossart P, Costelli P, Costes S, Coto-Montes A, Couve E, Coxon FP, Cregg JM, Crespo JL, Cronje MJ, Cuervo AM, Cullen JJ, Czaja MJ, D’Amelio M, Darfeuille-Michaud A, Davids LM, Davies FE, De Felici M, de Groot JF, de Haan CA, De Martino L, De Milito A, De Tata V, Debnath J, Degterev A, Dehay B, Delbridge LM, Demarchi F, Deng YZ, Dengjel J, Dent P, Denton D, Deretic V, Desai SD, Devenish RJ, Di Gioacchino M, Di Paolo G, Di Pietro C, Diaz-Araya G, Diaz-Laviada I, Diaz-Meco MT, Diaz-Nido J, Dikic I, Dinesh-Kumar SP, Ding WX, Distelhorst CW, Diwan A, Djavaheri-Mergny M, Dokudovskaya S, Dong Z, Dorsey FC, Dosenko V, Dowling JJ, Doxsey S, Dreux M, Drew ME, Duan Q, Duchosal MA, Duff K, Dugail I, Durbeej M, Duszenko M, Edelstein CL, Edinger AL, Egea G, Eichinger L, Eissa NT, Ekmekcioglu S, El-Deiry WS, Elazar Z, Elgendy M, Ellerby LM, Eng KE, Engelbrecht AM, Engelender S, Erenpreisa J, Escalante R, Esclatine A, Eskelinen EL, Espert L, Espina V, Fan H, Fan J, Fan QW, Fan Z, Fang S, Fang Y, Fanto M, Fanzani A, Farkas T, Farre JC, Faure M, Fechheimer M, Feng CG, Feng J, Feng Q, Feng Y, Fesus L, Feuer R, Figueiredo-Pereira ME, Fimia GM, Fingar DC, Finkbeiner S, Finkel T, Finley KD, Fiorito F, Fisher EA, Fisher PB, Flajolet M, Florez-McClure ML, Florio S, Fon EA, Fornai F, Fortunato F, Fotedar R, Fowler DH, Fox HS, Franco R, Frankel LB, Fransen M, Fuentes JM, Fueyo J, Fujii J, Fujisaki K, Fujita E, Fukuda M, Furukawa RH, Gaestel M, Gailly P, Gajewska M, Galliot B, Galy V, Ganesh S, Ganetzky B, Ganley IG, Gao FB, Gao GF, Gao J, Garcia L, Garcia-Manero G, Garcia-Marcos M, Garmyn M, Gartel AL, Gatti E, Gautel M, Gawriluk TR, Gegg ME, Geng J, Germain M, Gestwicki JE, Gewirtz DA, Ghavami S, Ghosh P, Giammarioli AM, Giatromanolaki AN, Gibson SB, Gilkerson RW, Ginger ML, Ginsberg HN, Golab J, Goligorsky MS, Golstein P, Gomez-Manzano C, Goncu E, Gongora C, Gonzalez CD, Gonzalez R, Gonzalez-Estevez C, Gonzalez-Polo RA, Gonzalez-Rey E, Gorbunov NV, Gorski S, Goruppi S, Gottlieb RA, Gozuacik D, Granato GE, Grant GD, Green KN, Gregorc A, Gros F, Grose C, Grunt TW, Gual P, Guan JL, Guan KL, Guichard SM, Gukovskaya AS, Gukovsky I, Gunst J, Gustafsson AB, Halayko AJ, Hale AN, Halonen SK, Hamasaki M, Han F, Han T, Hancock MK, Hansen M, Harada H, Harada M, Hardt SE, Harper JW, Harris AL, Harris J, Harris SD, Hashimoto M, Haspel JA, Hayashi S, Hazelhurst LA, He C, He YW, Hebert MJ, Heidenreich KA, Helfrich MH, Helgason GV, Henske EP, Herman B, Herman PK, Hetz C, Hilfiker S, Hill JA, Hocking LJ, Hofman P, Hofmann TG, Hohfeld J, Holyoake TL, Hong MH, Hood DA, Hotamisligil GS, Houwerzijl EJ, Hoyer-Hansen M, Hu B, Hu CA, Hu HM, Hua Y, Huang C, Huang J, Huang S, Huang WP, Huber TB, Huh WK, Hung TH, Hupp TR, Hur GM, Hurley JB, Hussain SN, Hussey PJ, Hwang JJ, Hwang S, Ichihara A, Ilkhanizadeh S, Inoki K, Into T, Iovane V, Iovanna JL, Ip NY, Isaka Y, Ishida H, Isidoro C, Isobe K, Iwasaki A, Izquierdo M, Izumi Y, Jaakkola PM, Jaattela M, Jackson GR, Jackson WT, Janji B, Jendrach M, Jeon JH, Jeung EB, Jiang H, Jiang H, Jiang JX, Jiang M, Jiang Q, Jiang X, Jiang X, Jimenez A, Jin M, Jin S, Joe CO, Johansen T, Johnson DE, Johnson GV, Jones NL, Joseph B, Joseph SK, Joubert AM, Juhasz G, Juillerat-Jeanneret L, Jung CH, Jung YK, Kaarniranta K, Kaasik A, Kabuta T, Kadowaki M, Kagedal K, Kamada Y, Kaminskyy VO, Kampinga HH, Kanamori H, Kang C, Kang KB, Kang KI, Kang R, Kang YA, Kanki T, Kanneganti TD, Kanno H, Kanthasamy AG, Kanthasamy A, Karantza V, Kaushal GP, Kaushik S, Kawazoe Y, Ke PY, Kehrl JH, Kelekar A, Kerkhoff C, Kessel DH, Khalil H, Kiel JA, Kiger AA, Kihara A, Kim DR, Kim DH, Kim DH, Kim EK, Kim HR, Kim JS, Kim JH, Kim JC, Kim JK, Kim PK, Kim SW, Kim YS, Kim Y, Kimchi A, Kimmelman AC, King JS, Kinsella TJ, Kirkin V, Kirshenbaum LA, Kitamoto K, Kitazato K, Klein L, Klimecki WT, Klucken J, Knecht E, Ko BC, Koch JC, Koga H, Koh JY, Koh YH, Koike M, Komatsu M, Kominami E, Kong HJ, Kong WJ, Korolchuk VI, Kotake Y, Koukourakis MI, Kouri Flores JB, Kovacs AL, Kraft C, Krainc D, Kramer H, Kretz-Remy C, Krichevsky AM, Kroemer G, Kruger R, Krut O, Ktistakis NT, Kuan CY, Kucharczyk R, Kumar A, Kumar R, Kumar S, Kundu M, Kung HJ, Kurz T, Kwon HJ, La Spada AR, Lafont F, Lamark T, Landry J, Lane JD, Lapaquette P, Laporte JF, Laszlo L, Lavandero S, Lavoie JN, Layfield R, Lazo PA, Le W, Le Cam L, Ledbetter DJ, Lee AJ, Lee BW, Lee GM, Lee J, Lee JH, Lee M, Lee MS, Lee SH, Leeuwenburgh C, Legembre P, Legouis R, Lehmann M, Lei HY, Lei QY, Leib DA, Leiro J, Lemasters JJ, Lemoine A, Lesniak MS, Lev D, Levenson VV, Levine B, Levy E, Li F, Li JL, Li L, Li S, Li W, Li XJ, Li YB, Li YP, Liang C, Liang Q, Liao YF, Liberski PP, Lieberman A, Lim HJ, Lim KL, Lim K, Lin CF, Lin FC, Lin J, Lin JD, Lin K, Lin WW, Lin WC, Lin YL, Linden R, Lingor P, Lippincott-Schwartz J, Lisanti MP, Liton PB, Liu B, Liu CF, Liu K, Liu L, Liu QA, Liu W, Liu YC, Liu Y, Lockshin RA, Lok CN, Lonial S, Loos B, Lopez-Berestein G, Lopez-Otin C, Lossi L, Lotze MT, Low P, Lu B, Lu B, Lu B, Lu Z, Luciano F, Lukacs NW, Lund AH, Lynch-Day MA, Ma Y, Macian F, MacKeigan JP, Macleod KF, Madeo F, Maiuri L, Maiuri MC, Malagoli D, Malicdan MC, Malorni W, Man N, Mandelkow EM, Manon S, Manov I, Mao K, Mao X, Mao Z, Marambaud P, Marazziti D, Marcel YL, Marchbank K, Marchetti P, Marciniak SJ, Marcondes M, Mardi M, Marfe G, Marino G, Markaki M, Marten MR, Martin SJ, Martinand-Mari C, Martinet W, Martinez-Vicente M, Masini M, Matarrese P, Matsuo S, Matteoni R, Mayer A, Mazure NM, McConkey DJ, McConnell MJ, McDermott C, McDonald C, McInerney GM, McKenna SL, McLaughlin B, McLean PJ, McMaster CR, McQuibban GA, Meijer AJ, Meisler MH, Melendez A, Melia TJ, Melino G, Mena MA, Menendez JA, Menna-Barreto RF, Menon MB, Menzies FM, Mercer CA, Merighi A, Merry DE, Meschini S, Meyer CG, Meyer TF, Miao CY, Miao JY, Michels PA, Michiels C, Mijaljica D, Milojkovic A, Minucci S, Miracco C, Miranti CK, Mitroulis I, Miyazawa K, Mizushima N, Mograbi B, Mohseni S, Molero X, Mollereau B, Mollinedo F, Momoi T, Monastyrska I, Monick MM, Monteiro MJ, Moore MN, Mora R, Moreau K, Moreira PI, Moriyasu Y, Moscat J, Mostowy S, Mottram JC, Motyl T, Moussa CE, Muller S, Muller S, Munger K, Munz C, Murphy LO, Murphy ME, Musaro A, Mysorekar I, Nagata E, Nagata K, Nahimana A, Nair U, Nakagawa T, Nakahira K, Nakano H, Nakatogawa H, Nanjundan M, Naqvi NI, Narendra DP, Narita M, Navarro M, Nawrocki ST, Nazarko TY, Nemchenko A, Netea MG, Neufeld TP, Ney PA, Nezis IP, Nguyen HP, Nie D, Nishino I, Nislow C, Nixon RA, Noda T, Noegel AA, Nogalska A, Noguchi S, Notterpek L, Novak I, Nozaki T, Nukina N, Nurnberger T, Nyfeler B, Obara K, Oberley TD, Oddo S, Ogawa M, Ohashi T, Okamoto K, Oleinick NL, Oliver FJ, Olsen LJ, Olsson S, Opota O, Osborne TF, Ostrander GK, Otsu K, Ou JH, Ouimet M, Overholtzer M, Ozpolat B, Paganetti P, Pagnini U, Pallet N, Palmer GE, Palumbo C, Pan T, Panaretakis T, Pandey UB, Papackova Z, Papassideri I, Paris I, Park J, Park OK, Parys JB, Parzych KR, Patschan S, Patterson C, Pattingre S, Pawelek JM, Peng J, Perlmutter DH, Perrotta I, Perry G, Pervaiz S, Peter M, Peters GJ, Petersen M, Petrovski G, Phang JM, Piacentini M, Pierre P, Pierrefite-Carle V, Pierron G, Pinkas-Kramarski R, Piras A, Piri N, Platanias LC, Poggeler S, Poirot M, Poletti A, Pous C, Pozuelo-Rubio M, Praetorius-Ibba M, Prasad A, Prescott M, Priault M, Produit-Zengaffinen N, Progulske-Fox A, Proikas-Cezanne T, Przedborski S, Przyklenk K, Puertollano R, Puyal J, Qian SB, Qin L, Qin ZH, Quaggin SE, Raben N, Rabinowich H, Rabkin SW, Rahman I, Rami A, Ramm G, Randall G, Randow F, Rao VA, Rathmell JC, Ravikumar B, Ray SK, Reed BH, Reed JC, Reggiori F, Regnier-Vigouroux A, Reichert AS, Reiners JJ, Jr, Reiter RJ, Ren J, Revuelta JL, Rhodes CJ, Ritis K, Rizzo E, Robbins J, Roberge M, Roca H, Roccheri MC, Rocchi S, Rodemann HP, Rodriguez de Cordoba S, Rohrer B, Roninson IB, Rosen K, Rost-Roszkowska MM, Rouis M, Rouschop KM, Rovetta F, Rubin BP, Rubinsztein DC, Ruckdeschel K, Rucker EB, 3rd, Rudich A, Rudolf E, Ruiz-Opazo N, Russo R, Rusten TE, Ryan KM, Ryter SW, Sabatini DM, Sadoshima J, Saha T, Saitoh T, Sakagami H, Sakai Y, Salekdeh GH, Salomoni P, Salvaterra PM, Salvesen G, Salvioli R, Sanchez AM, Sanchez-Alcazar JA, Sanchez-Prieto R, Sandri M, Sankar U, Sansanwal P, Santambrogio L, Saran S, Sarkar S, Sarwal M, Sasakawa C, Sasnauskiene A, Sass M, Sato K, Sato M, Schapira AH, Scharl M, Schatzl HM, Scheper W, Schiaffino S, Schneider C, Schneider ME, Schneider-Stock R, Schoenlein PV, Schorderet DF, Schuller C, Schwartz GK, Scorrano L, Sealy L, Seglen PO, Segura-Aguilar J, Seiliez I, Seleverstov O, Sell C, Seo JB, Separovic D, Setaluri V, Setoguchi T, Settembre C, Shacka JJ, Shanmugam M, Shapiro IM, Shaulian E, Shaw RJ, Shelhamer JH, Shen HM, Shen WC, Sheng ZH, Shi Y, Shibuya K, Shidoji Y, Shieh JJ, Shih CM, Shimada Y, Shimizu S, Shintani T, Shirihai OS, Shore GC, Sibirny AA, Sidhu SB, Sikorska B, Silva-Zacarin EC, Simmons A, Simon AK, Simon HU, Simone C, Simonsen A, Sinclair DA, Singh R, Sinha D, Sinicrope FA, Sirko A, Siu PM, Sivridis E, Skop V, Skulachev VP, Slack RS, Smaili SS, Smith DR, Soengas MS, Soldati T, Song X, Sood AK, Soong TW, Sotgia F, Spector SA, Spies CD, Springer W, Srinivasula SM, Stefanis L, Steffan JS, Stendel R, Stenmark H, Stephanou A, Stern ST, Sternberg C, Stork B, Stralfors P, Subauste CS, Sui X, Sulzer D, Sun J, Sun SY, Sun ZJ, Sung JJ, Suzuki K, Suzuki T, Swanson MS, Swanton C, Sweeney ST, Sy LK, Szabadkai G, Tabas I, Taegtmeyer H, Tafani M, Takacs-Vellai K, Takano Y, Takegawa K, Takemura G, Takeshita F, Talbot NJ, Tan KS, Tanaka K, Tanaka K, Tang D, Tang D, Tanida I, Tannous BA, Tavernarakis N, Taylor GS, Taylor GA, Taylor JP, Terada LS, Terman A, Tettamanti G, Thevissen K, Thompson CB, Thorburn A, Thumm M, Tian F, Tian Y, Tocchini-Valentini G, Tolkovsky AM, Tomino Y, Tonges L, Tooze SA, Tournier C, Tower J, Towns R, Trajkovic V, Travassos LH, Tsai TF, Tschan MP, Tsubata T, Tsung A, Turk B, Turner LS, Tyagi SC, Uchiyama Y, Ueno T, Umekawa M, Umemiya-Shirafuji R, Unni VK, Vaccaro MI, Valente EM, Van den Berghe G, van der Klei IJ, van Doorn W, van Dyk LF, van Egmond M, van Grunsven LA, Vandenabeele P, Vandenberghe WP, Vanhorebeek I, Vaquero EC, Velasco G, Vellai T, Vicencio JM, Vierstra RD, Vila M, Vindis C, Viola G, Viscomi MT, Voitsekhovskaja OV, von Haefen C, Votruba M, Wada K, Wade-Martins R, Walker CL, Walsh CM, Walter J, Wan XB, Wang A, Wang C, Wang D, Wang F, Wang F, Wang G, Wang H, Wang HG, Wang HD, Wang J, Wang K, Wang M, Wang RC, Wang X, Wang X, Wang YJ, Wang Y, Wang Z, Wang ZC, Wang Z, Wansink DG, Ward DM, Watada H, Waters SL, Webster P, Wei L, Weihl CC, Weiss WA, Welford SM, Wen LP, Whitehouse CA, Whitton JL, Whitworth AJ, Wileman T, Wiley JW, Wilkinson S, Willbold D, Williams RL, Williamson PR, Wouters BG, Wu C, Wu DC, Wu WK, Wyttenbach A, Xavier RJ, Xi Z, Xia P, Xiao G, Xie Z, Xie Z, Xu DZ, Xu J, Xu L, Xu X, Yamamoto A, Yamamoto A, Yamashina S, Yamashita M, Yan X, Yanagida M, Yang DS, Yang E, Yang JM, Yang SY, Yang W, Yang WY, Yang Z, Yao MC, Yao TP, Yeganeh B, Yen WL, Yin JJ, Yin XM, Yoo OJ, Yoon G, Yoon SY, Yorimitsu T, Yoshikawa Y, Yoshimori T, Yoshimoto K, You HJ, Youle RJ, Younes A, Yu L, Yu L, Yu SW, Yu WH, Yuan ZM, Yue Z, Yun CH, Yuzaki M, Zabirnyk O, Silva-Zacarin E, Zacks D, Zacksenhaus E, Zaffaroni N, Zakeri Z, Zeh HJ, 3rd, Zeitlin SO, Zhang H, Zhang HL, Zhang J, Zhang JP, Zhang L, Zhang L, Zhang MY, Zhang XD, Zhao M, Zhao YF, Zhao Y, Zhao ZJ, Zheng X, Zhivotovsky B, Zhong Q, Zhou CZ, Zhu C, Zhu WG, Zhu XF, Zhu X, Zhu Y, Zoladek T, Zong WX, Zorzano A, Zschocke J, Zuckerbraun B. Guidelines for the use and interpretation of assays for monitoring autophagy. Autophagy. 2012;8:445–544. doi: 10.4161/auto.19496. [DOI] [PMC free article] [PubMed] [Google Scholar]
- 47.Zheng Q, Su H, Ranek MJ, Wang X. Autophagy and p62 in cardiac proteinopathy. Circ Res. 2011;109:296–308. doi: 10.1161/CIRCRESAHA.111.244707. [DOI] [PMC free article] [PubMed] [Google Scholar]
- 48.Jin M, Klionsky DJ. Regulation of autophagy: Modulation of the size and number of autophagosomes. FEBS Lett. 2014;588:2457–2463. doi: 10.1016/j.febslet.2014.06.015. [DOI] [PMC free article] [PubMed] [Google Scholar]
- 49.Solcia E, Ballerini L, Bellini O, Magrini U, Bertazzoli C, Tosana G, Sala L, Balconi F, Rallo F. Cardiomyopathy of doxorubicin in experimental animals, factors affecting the severity, distribution and evolution of myocardial lesions. Tumori. 1981;67:461–472. doi: 10.1177/030089168106700512. [DOI] [PubMed] [Google Scholar]
- 50.Gebbia N, Leto G, Gagliano M, Tumminello FM, Rausa L. Lysosomal alterations in heart and liver of mice treated with doxorubicin. Cancer Chemother Pharmacol. 1985;15:26–30. doi: 10.1007/BF00257289. [DOI] [PubMed] [Google Scholar]
- 51.Sun-Wada GH, Wada Y, Futai M. Lysosome and lysosome-related organelles responsible for specialized functions in higher organisms, with special emphasis on vacuolar-type proton atpase. Cell Struct Funct. 2003;28:455–463. doi: 10.1247/csf.28.455. [DOI] [PubMed] [Google Scholar]
- 52.Yamamoto A, Tagawa Y, Yoshimori T, Moriyama Y, Masaki R, Tashiro Y. Bafilomycin a1 prevents maturation of autophagic vacuoles by inhibiting fusion between autophagosomes and lysosomes in rat hepatoma cell line, h-4-ii-e cells. Cell Struct Funct. 1998;23:33–42. doi: 10.1247/csf.23.33. [DOI] [PubMed] [Google Scholar]
- 53.Kawai A, Uchiyama H, Takano S, Nakamura N, Ohkuma S. Autophagosome-lysosome fusion depends on the ph in acidic compartments in cho cells. Autophagy. 2007;3:154–157. doi: 10.4161/auto.3634. [DOI] [PubMed] [Google Scholar]
- 54.Coen K, Flannagan RS, Baron S, Carraro-Lacroix LR, Wang D, Vermeire W, Michiels C, Munck S, Baert V, Sugita S, Wuytack F, Hiesinger PR, Grinstein S, Annaert W. Lysosomal calcium homeostasis defects, not proton pump defects, cause endo-lysosomal dysfunction in psen-deficient cells. J Cell Biol. 2012;198:23–35. doi: 10.1083/jcb.201201076. [DOI] [PMC free article] [PubMed] [Google Scholar]
- 55.Lu Y, Hao BX, Graeff R, Wong CW, Wu WT, Yue J. Two pore channel 2 (tpc2) inhibits autophagosomal-lysosomal fusion by alkalinizing lysosomal ph. J Biol Chem. 2013;288:24247–24263. doi: 10.1074/jbc.M113.484253. [DOI] [PMC free article] [PubMed] [Google Scholar] [Retracted]
- 56.King JS, Gueho A, Hagedorn M, Gopaldass N, Leuba F, Soldati T, Insall RH. Wash is required for lysosomal recycling and efficient autophagic and phagocytic digestion. Mol Biol Cell. 2013;24:2714–2726. doi: 10.1091/mbc.E13-02-0092. [DOI] [PMC free article] [PubMed] [Google Scholar]
- 57.Owegi MA, Pappas DL, Finch MW, Jr, Bilbo SA, Resendiz CA, Jacquemin LJ, Warrier A, Trombley JD, McCulloch KM, Margalef KL, Mertz MJ, Storms JM, Damin CA, Parra KJ. Identification of a domain in the v0 subunit d that is critical for coupling of the yeast vacuolar proton-translocating atpase. J Biol Chem. 2006;281:30001–30014. doi: 10.1074/jbc.M605006200. [DOI] [PubMed] [Google Scholar]
- 58.Wang Y, Floor E. Hydrogen peroxide inhibits the vacuolar h+-atpase in brain synaptic vesicles at micromolar concentrations. J Neurochem. 1998;70:646–652. doi: 10.1046/j.1471-4159.1998.70020646.x. [DOI] [PubMed] [Google Scholar]
- 59.Oluwatosin YE, Kane PM. Mutations in the cys4 gene provide evidence for regulation of the yeast vacuolar h+-atpase by oxidation and reduction in vivo. J Biol Chem. 1997;272:28149–28157. doi: 10.1074/jbc.272.44.28149. [DOI] [PubMed] [Google Scholar]
- 60.Kuma A, Hatano M, Matsui M, Yamamoto A, Nakaya H, Yoshimori T, Ohsumi Y, Tokuhisa T, Mizushima N. The role of autophagy during the early neonatal starvation period. Nature. 2004;432:1032–1036. doi: 10.1038/nature03029. [DOI] [PubMed] [Google Scholar]
- 61.Soong TR, Barouch LA, Champion HC, Wigley FM, Halushka MK. New clinical and ultrastructural findings in hydroxychloroquine-induced cardiomyopathy--a report of 2 cases. Hum Pathol. 2007;38:1858–1863. doi: 10.1016/j.humpath.2007.06.013. [DOI] [PubMed] [Google Scholar]
- 62.Kroemer G, Levine B. Autophagic cell death: The story of a misnomer. Nat Rev Mol Cell Biol. 2008;9:1004–1010. doi: 10.1038/nrm2527. [DOI] [PMC free article] [PubMed] [Google Scholar]
- 63.Maejima Y, Kyoi S, Zhai P, Liu T, Li H, Ivessa A, Sciarretta S, Del Re DP, Zablocki DK, Hsu CP, Lim DS, Isobe M, Sadoshima J. Mst1 inhibits autophagy by promoting the interaction between beclin1 and bcl-2. Nat Med. 2013;19:1478–1488. doi: 10.1038/nm.3322. [DOI] [PMC free article] [PubMed] [Google Scholar]
- 64.Liu J, Xia H, Kim M, Xu L, Li Y, Zhang L, Cai Y, Norberg HV, Zhang T, Furuya T, Jin M, Zhu Z, Wang H, Yu J, Li Y, Hao Y, Choi A, Ke H, Ma D, Yuan J. Beclin1 controls the levels of p53 by regulating the deubiquitination activity of usp10 and usp13. Cell. 2011;147:223–234. doi: 10.1016/j.cell.2011.08.037. [DOI] [PMC free article] [PubMed] [Google Scholar]
- 65.Raben N, Baum R, Schreiner C, Takikita S, Mizushima N, Ralston E, Plotz P. When more is less: Excess and deficiency of autophagy coexist in skeletal muscle in pompe disease. Autophagy. 2009;5:111–113. doi: 10.4161/auto.5.1.7293. [DOI] [PMC free article] [PubMed] [Google Scholar]
- 66.De Kimpe L, van Haastert ES, Kaminari A, Zwart R, Rutjes H, Hoozemans JJ, Scheper W. Intracellular accumulation of aggregated pyroglutamate amyloid beta: Convergence of aging and abeta pathology at the lysosome. Age. 2013;35:673–687. doi: 10.1007/s11357-012-9403-0. [DOI] [PMC free article] [PubMed] [Google Scholar]
- 67.Lipinski MM, Zheng B, Lu T, Yan Z, Py BF, Ng A, Xavier RJ, Li C, Yankner BA, Scherzer CR, Yuan J. Genome-wide analysis reveals mechanisms modulating autophagy in normal brain aging and in alzheimer’s disease. Proc Natl Acad Sci U S A. 2010;107:14164–14169. doi: 10.1073/pnas.1009485107. [DOI] [PMC free article] [PubMed] [Google Scholar]
- 68.Sterba M, Popelova O, Vavrova A, Jirkovsky E, Kovarikova P, Gersl V, Simunek T. Oxidative stress, redox signaling, and metal chelation in anthracycline cardiotoxicity and pharmacological cardioprotection. Antioxid Redox Signal. 2013;18:899–929. doi: 10.1089/ars.2012.4795. [DOI] [PMC free article] [PubMed] [Google Scholar]
- 69.Doroshow JH, Locker GY, Myers CE. Enzymatic defenses of the mouse heart against reactive oxygen metabolites: Alterations produced by doxorubicin. J Clin Invest. 1980;65:128–135. doi: 10.1172/JCI109642. [DOI] [PMC free article] [PubMed] [Google Scholar]
- 70.Wen X, Wu J, Wang F, Liu B, Huang C, Wei Y. Deconvoluting the role of reactive oxygen species and autophagy in human diseases. Free Radic Biol Med. 2013;65:402–410. doi: 10.1016/j.freeradbiomed.2013.07.013. [DOI] [PubMed] [Google Scholar]
- 71.Chen YR, Zweier JL. Cardiac mitochondria and reactive oxygen species generation. Circ Res. 2014;114:524–537. doi: 10.1161/CIRCRESAHA.114.300559. [DOI] [PMC free article] [PubMed] [Google Scholar]
- 72.Nakanishi H, Wu Z. Microglia-aging: Roles of microglial lysosome- and mitochondria-derived reactive oxygen species in brain aging. Behavioural brain research. 2009;201:1–7. doi: 10.1016/j.bbr.2009.02.001. [DOI] [PubMed] [Google Scholar]
- 73.Kubota C, Torii S, Hou N, Saito N, Yoshimoto Y, Imai H, Takeuchi T. Constitutive reactive oxygen species generation from autophagosome/lysosome in neuronal oxidative toxicity. J Biol Chem. 2010;285:667–674. doi: 10.1074/jbc.M109.053058. [DOI] [PMC free article] [PubMed] [Google Scholar]
Associated Data
This section collects any data citations, data availability statements, or supplementary materials included in this article.