Abstract
CD98 plays an important role in the development and progression of inflammation. Here, CD98 siRNA (siCD98) was complexed with urocanic acid-modified chitosan (UAC) to form nanoparticles (NPs), which were transfected into Raw 264.7 macrophages in an effort to convey anti-inflammatory effects. Characterization showed that the generated NPs had a desirable particle size (156.0–247.1 nm), a slightly positive zeta potential (15.8–17.5 mV), and no apparent cytotoxicity against Raw 264.7 macrophages and colon-26 cells compared to control NPs fabricated by Oligofectamine (OF) and siRNA. Cellular uptake experiments demonstrated that macrophages exhibited a time-dependent accumulation profile of UAC/siRNA NPs. Further in vitro gene silencing experiments revealed that UAC/siCD98 NPs with a weight ratio of 60:1 yielded the most efficient knockdowns of CD98 and the pro-inflammatory cytokine, TNF-α. Indeed, the RNAi efficiency obtained with our NPs was even higher than that of the positive control OF/siCD98 NPs. These results suggest that UAC/siCD98 NPs might be a safe, efficient and promising candidate for the treatment of inflammatory disease.
Keywords: Urocanic acid, chitosan, nanoparticle, anti-inflammation, CD98 siRNA, macrophage
Graphical abstract
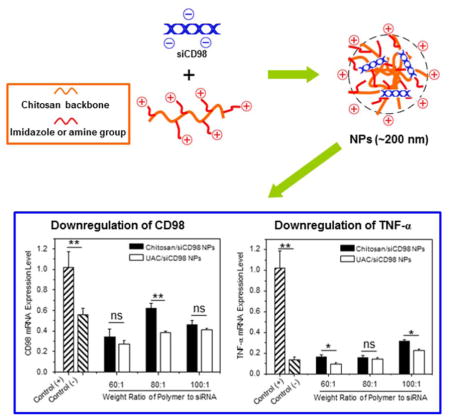
Downregulation of CD98 by urocanic acid-modified chitosan nanoparticles exhibited anti-inflammatory effect.
1. Introduction
CD98 is a cell-surface amino acid transporter formed by covalent linkage of the CD98 heavy chain with several different light chains [1, 2]. Its cytoplasmic domain can interact with β1 integrin to regulate integrin signalling mediated functions, such as cell homeostasis, epithelial adhesion/[polarity, and immune responses [3, 4]. Our group recently reported that CD98 is highly over-expressed in activated macrophages and plays an important role in the development and progression of inflammation [5, 6]. Thus, blockade of its expression might offer an effective approach to relieve inflammation.
RNAi interference (RNAi) mediated by small interfering RNA (siRNA) is a powerful tool for post-transcriptional silencing of gene expression, and was previously shown to inhibit CD98 expression in macrophages [7, 8]. However, the therapeutic efficacy of naked siRNA is limited by their rapid enzymatic degradation and poor cellular uptake efficiency, owing to issues with their low stability, high molecular weight, high hydrophilicity, and negative charges [9, 10]. To overcome these obstacles, two types of carrier have been used to transfer siRNA into cells: viral and non-viral carriers [11]. Viral carriers yield high transfection efficiency but have been associated with immunogenicity and oncogenic effects [12, 13]. A wide range of non-viral delivery systems (e.g., liposomes, dendrimers, and siRNA bioconjugates) have been proposed as alternatives for viral carriers, due to their minimal host immune responses, ease of synthesis/chemical modification and their relative stability in storage [7, 14, 15].
Chitosan and its derivatives are liable to form nanoparticles (NPs) with siRNA through interpolyelectrolyte complexation, and thus have been widely exploited as siRNA carriers in recent years [16–18]. It was reported that the release of chitosan-based siRNA-loaded NPs from enzyme-rich acidic endosomes/lysosomes into cytoplasm is believed to be the limiting step for efficient RNAi [19]. To circumvent this issue, exogenous agents (e.g., chloroquine) have been introduced into NPs to facilitate their escape from endosomes/lysosomes [20]. However, their accompanying cytotoxicity and immunogenicity have made these exogenous agent-containing NPs impractical for siRNA delivery. Imidazole, which is a building block of amino acids and is thus highly biocompatible, displays a pKa around 6.0 [21]. It can interact with negatively charged endosomal membranes, inducing the influx of ions and water, and eventually destabilizing the endosome and triggering NPs release [22]. Thus, it is often conjugated with polymers in order to promote siRNA transfection activity [23, 24]. Recently, imidazole group-containing urocanic acid-modified chitosan (UAC) was developed and shown to enhance (via the proton-sponge mechanism) the release of UAC/DNA NPs into the cytoplasm following endosome/lysosome rupture [25–27]. However, to the best of our knowledge, no previous study has investigated the efficiency of UAC-mediated delivery of siRNA.
Here, we describe the fabrication of UAC/siRNA NPs, and characterize their physicochemical properties, including their CD98 siRNA (siCD98) complexation capability, hydrodynamic particle size, zeta potential, and morphology. We also investigate their cytotoxicity and ability to combat inflammation via RNAi.
2. Materials and Methods
2.1 Materials
Chitosan, urocanic acid, sodium nitrite, 2-(N-morpholino) ethanesulfonic acid sodium salt (MES), 1-ethyl-3-(diethylaminopropyl)carbodiimide (EDC), N-hydroxysuccinimide (NHS), lipopolysaccharides (LPS) from Salmonella enteric serotype typhimurium were purchased from Sigma-Aldrich (St. Louis, USA). Molecular weight of chitosan was tailored by depolymerization using sodium nitrite following a reported method [28]. Viscosity-average molecular weight of the resultant chitosan was measured as 1.8×10⁴ using a 0.5 M CH3COOH/0.2 M CH3COONa solvent system [29]. Oligofectamine™ (OF), 4′,6-diamidino-2-phenyl-indole dihydrochloride (DAPI), FITC fluorescently tagged siRNA (FITC-siRNA) and Vybrant® MTT cell proliferation assay kit (MTT) were obtained from Invitrogen (Eugene, USA). GelRed was from Biotium (Hayward, USA). siCD98 was purchased from Santa Cruz Biotechnology (Santa Cruz, USA). All commercial products were used without further purification.
2.2 Synthesis of UAC
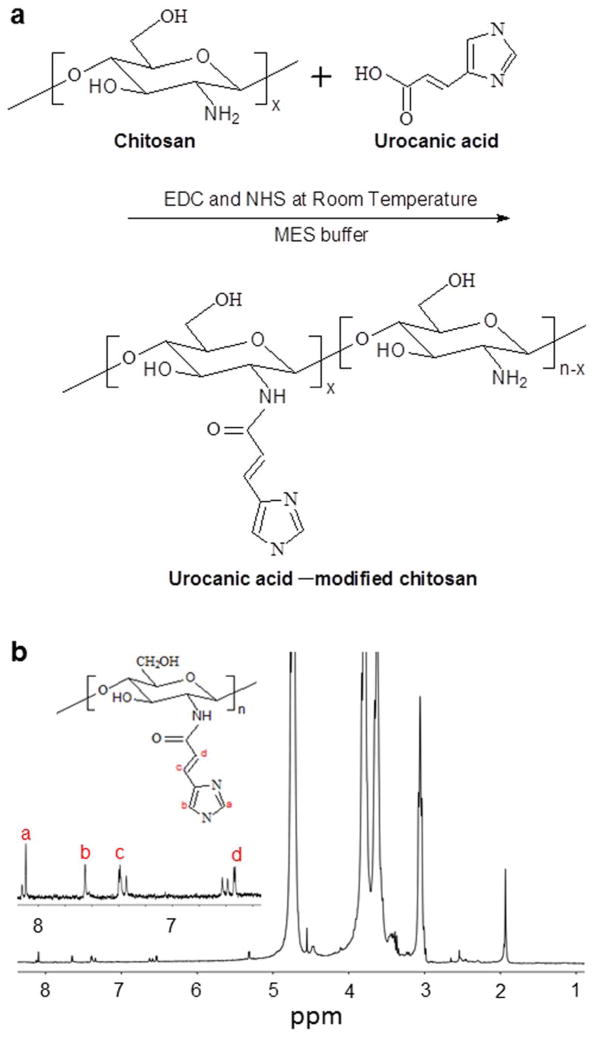
Chitosan was coupled with urocanic acid using EDC and NHS as coupling agents in MES buffer by an active ester intermediate. The synthetic scheme is given in Fig. 1a. In brief, chitosan was dissolved in MES buffer (25 mM, pH 5.0) and the carboxyl group of urocanic acid was activated for 2 h by NHS/EDC in MES buffer. The molar ratio of NHS to EDC was 1:1 and EDC was 4-fold molar over urocanic acid. Subsequently, the activated urocanic acid solution was added to the chitosan solution and the resulting mixture was allowed to react for 48 h. The reaction was quenched by adding hydroxylamine, and adjusting the pH of the reaction system to 8.0 with addition of a NaOH solution. The collected product was dialyzed (MWCO = 3500) against distilled water for 6 days and lyophilized.
Fig. 1.
Preparation and characterization of UAC. (a) Synthetic scheme of UAC using EDC and NHS as catalysts in MES buffer at room temperature. (b) 1H NMR spectrum of UAC (2 wt%) dissolved in diluted DCl solution.
2.3 Characterization of UAC
The composition of UAC was determined by NMR spectrum (Bruker, 400 MHz, Germany). Briefly, UAC were dissolved in DCl (1%, v/v) solutions to prepare a 2 wt% solution for 1H NMR measurement.
XRD patterns of chitosan and UAC were recorded on an X-ray diffractometer (X’Pert PRO, PANalytical B.V., Holland) at a voltage of 40 kV and a current of 40 mA using CuKα radiation. The scanning scope of 2θ was ranged from 5 to 40° at ambient temperature.
The buffering capacity of the polymers was determined by acid-base titration method. Briefly, polymers (10 mg) were dissolved in 0.15 M NaCl (aq., 10 mL) and the starting pH of solutions was set to around 9.3 with NaOH solution. The polymer solutions were titrated with 0.1 N HCl and the changes in the pH of the polymers solutions were monitored by a pH meter. Titration of 0.15 M NaCl and bPEI (25 kDa) solutions were also performed in the same manner as controls. The buffering capacities of the polymers were compared at a pH of 5.1–7.4 to determine the behaviour of the polymers at the endolysosomal pH. The buffering capacity can be calculated from the equation in our previous report [7].
2.4 Fabrication of NPs
Initially, chitosan and UAC were dissolved in 0.1 M sodium acetate/0.1 M acetic acid buffers (pH 5.5) with a concentration of 4 mg/mL and filtered with 0.22-μm filters. The siCD98 and FITC-siRNA solutions were prepared in ribonuclease-free water at a concentration of 0.1 mg/mL. Subsequently, NPs were prepared by a complex coacervation technique. Equivalent volumes of siRNA solutions were added to an appropriate amount of polymer solutions at various weight ratios and vortexed for 10 seconds. The resulting NPs were allowed to incubate for 30 min at room temperature for complete NPs formation. NPs were prepared immediately before the experiments.
2.5 Agarose gel retardation assay
The siRNA condensing capacities of chitosan and UAC were evaluated by agarose gel electrophoresis. The NPs were fabricated at various weight ratios ranging from 5:1 to 60:1. Agarose gel (4%, W/V) containing GelRed solution (0.5 μg/mL) was prepared in Tris-Acetate-EDTA buffer. After 30 min of incubation at room temperature, the samples were electrophoresed at 100 V for 20 min. The resulting siRNA migration patterns were viewed under UV transilluminator.
2.6 Particle size, zeta-potential and morphology measurement
Particle sizes (nm) and zeta potential (mV) of NPs were measured by dynamic light scattering (DLS) using 90 Plus/BI-MAS (Multi-angle particle sizing) or DLS after applying an electric field using a ZetaPlus (Zeta potential analyzer, Brookhaven Instruments Corporation). The average of the diameters or zeta potential was calculated using 3 runs.
For morphology test, a drop of suspension of UAC/siRNA NPs with a weight ratio of 60:1 was mounted onto 400-mesh carbon-coated copper grids and dried before analysis. The image was measured by a transmission electron microscope (TEM, LEO 906E, Zeiss, Germany).
2.7 Cytotoxicity assay
For MTT assay, Raw 264.7 macrophages and colon-26 cells were seeded at a respective density of 8×10³ and 2×10⁴ cells/well in 96-well plates and incubated overnight. The cells were subsequently incubated with freshly prepared NPs suspensions for 24 h, and the siCD98 concentration in the medium is set as 100 nM. Cells were then incubated with MTT (0.5 mg/mL in supplemented 100 μL of serum free DMEM) at 37 °C for 4 h. Thereafter, the media were discarded and 50 μL dimethyl sulfoxide (DMSO) was added to each well prior to spectrophotometric measurements at 570 nm. Triton X-100 (0.5%) was used as a positive control to produce a maximum cell death rate (100%), whereas the cell culture medium was used as a negative control (death rate defined as 0%). NPs fabricated by OF (the most frequently used siRNA carrier) and siCD98 were also selected as control.
2.8 Intracellular NPs uptake visualization
Raw 264.7 macrophages were seeded in four-chamber tissue culture glass slide (BD Falcon, Bedford, MA, USA) at a density of 1.0×10⁴ cells/well and incubated overnight. The culture medium was exchanged to serum-free DMEM containing UAC/FITC-siRNA NPs (weight ratio, 60:1). The FITC-siRNA concentration in the medium is set as 100 nM. After co-culture for various time points (1, 3 and 5 h), the cells were fixed in 4% paraformaldehyde for 20 min. To observe cellular uptake of NPs, DAPI was diluted 10,000 times and added to the wells for staining cells for 5 min. Images were acquired using an Olympus equipped with a Hamamatsu Digital Camera ORCA-03G.
2.9 Quantification of intracellular uptake
Raw 264.7 macrophages were seeded in 6-well plates at a density of 1×10⁵ cells/well. After incubation overnight, medium was replaced with serum- and antibiotics-free medium and cells were treated with different NPs, at a final concentration of 100 nM FITC-siRNA. After co-culture for various time points (1, 3, 5, 24 and 48 h), the cells were thoroughly rinsed with cold PBS to eliminate excess of NPs, which were not taken up by cells. Subsequently, the cells were harvested using trypsin, transferred to centrifuge tubes, and centrifuged at 1,500 rpm for 5 min. Upon removal of the supernatant, the cells were re-suspended in 0.5 mL of flow cytometry (FCM) buffer, transferred to round-bottom polystyrene test tubes (BD Falcon, 12 × 75 mm), and kept at 4 °C until analysis. Analytical FCM was performed using the FITC channel on the FCM CantoTM (BD Biosciences, San Jose, CA, USA). A total of 5,000 ungated cells were analyzed.
2.10 In vitro gene silencing efficiency test
Raw 264.7 macrophages were seeded in 6-well plates at a density of 1×10⁵ cells/well and incubated overnight. Subsequently, various NPs were added into wells. The siCD98 concentration in the medium is set as 100 nM. As controls, cells were transfected with OF/siCD98 complexes. After co-culture for 5 h, the wells will supplemented with DMEM medium containing 10% FBS and further incubated for 19 h or 43 h. Cells were then stimulated with LPS (5 μg/mL) for 3 h. Total RNA was extracted using RNeasy Plus Mini Kit (Qiagen). The cDNA was generated from the total RNAs isolated above using the Maxima first strand cDNA synthesis kit (Fermentas) according to the manufacturer’s instruction. CD98 and TNF-α mRNA expression levels were quantified by RT-PCR using Maxima® SYBR Green/ROX qPCR Master Mix (Fermentas). The data were normalized to the internal control: 36B4. Relative gene expression levels were calculated using the delta delta Ct (2−ΔΔCt) method. Sequences of all the primers used for RT-PCR are given in Supplementary Table 1.
2.11 Statistical analysis
Statistical analysis was performed using Student’s t-test. Data were expressed as mean ± standard error of mean (S.E.M.). Statistical significance was represented by *P<0.05 and **P<0.01.
3. Results and discussion
3.1 Preparation and characterization of UAC
During the process of imidazolylation, EDC is reacted with the carboxyl groups of urocanic acid to form the amine-reactive intermediate, O-acylisourea. This intermediate is susceptible to hydrolysis, making it short-lived in aqueous solution. The subsequent addition of NHS stabilizes O-acylisourea by converting it to a semistable amine-reactive NHS ester, thus increasing the efficiency of the EDC-mediated coupling reaction. Finally, the activated carboxylic groups of urocanic acid form stable amido links with the amino groups of chitosan. The FT-IR spectra of chitosan and UAC are shown in Supplementary Fig. 1. In chitosan, the broad band at around 3403 cm−1 is attributed to –NH, the –OH stretching vibration, and the molecular hydrogen bond. The weak band at 2872 cm−1 is ascribed to the –CH stretch of chitosan. The characteristic peaks at 1648 and 1598 cm−1 correspond to the C=O stretch of the amide I and –NH2 bands of chitosan, respectively. The peaks matching the saccharide backbone are clearly visible at 1158 cm−1 (reflecting the anti-symmetric stretching of C–O–C), and 1080–1023 cm−1 (skeletal vibrations involving C–O stretching). Compared with the spectrum of chitosan, that of UAC shows an obvious weakened –NH2 peak and a new band at around 1513 cm−1. This is likely to reflect the presence of an amide bond linking chitosan and urocanic acid.
Fig. 1b presents the 1H NMR spectrum of UAC. The peaks between 6.4 ppm and 8.0 ppm reflect the presence of imidazole groups on the chitosan backbone of UAC. The peaks assigned to protons in the chitosan chains and urocanic acid groups are in good agreement with published reports [13]. The amino-substitution degree of the imidazole groups is estimated to be 24.7%, based on the 1H NMR spectrum. Together, our FT-IR and 1H NMR results show that urocanic acid groups have been successfully grafted onto the chitosan backbone.
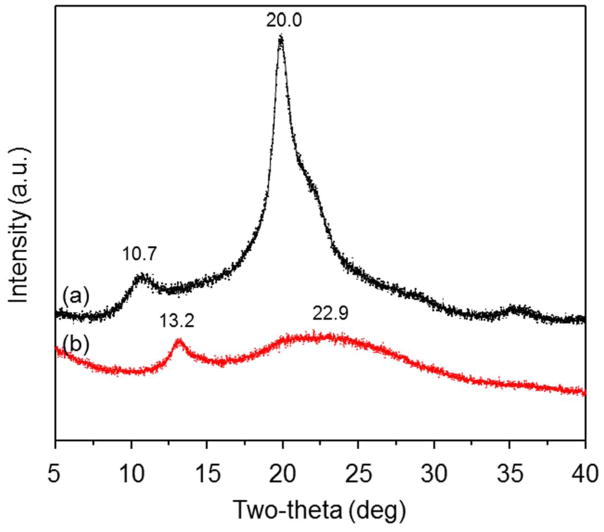
To compare the crystalline properties of chitosan and UAC, we examined their representative X-ray patterns (Fig. 2). The diffractogram of unmodified chitosan shows two characteristic diffractive peaks at around 10.7° and 20.0°; this is consistent with our previous report [30] and indicates that chitosan has a high degree of crystallinity. The X-ray patterns of UAC differ from those of chitosan in terms of the diffraction angles and peak intensity. In the spectrum of UAC, the 10.7° peak of chitosan is shifted to a higher 2θ value of around 13.2°, and the 22.9° peak of chitosan is nearly absent. This indicates that UAC has a lower crystallinity than chitosan, likely reflecting that the urocanic acid side chains hinder the formation of inter- and extra- molecular hydrogen bonds.
Fig. 2.
XRD patterns of (a) chitosan and (b) UAC.
A strong buffering capacity of polymers is frequently related to high transfection efficiency due to the fast endosomal escape of polymer/nucleic acid NPs [31]. Accordingly, the buffering capacity of UAC was assessed by acid-base titration. As shown in Supplementary Fig. 2, the pH of NaCl solution (negative control) changes rapidly with the addition of HCl solution, while UAC exhibits an excellent acid-buffering capacity. Furthermore, we find that the buffering capacity of UAC is approximately 102.7% of that of bPEI (25 kDa). This result indicates that UAC could mediate efficiently lysosome escape.
3.2 Agarose gel retardation assay
A fundamental requirement for a siRNA carrier is the ability to efficiently condense siRNA. Here, the siRNA-condensation abilities of chitosan and UAC were evaluated using an agarose gel retardation assay. As shown in Fig. 3, siRNA complexed with chitosan or UAC remains in the loading wells, whereas uncomplexed siRNA migrates out of the wells. Some siRNAs are released from chitosan/siRNA NPs up to a weight ratio of 40:1, indicating that chitosan has only a weak retardation effect and, thus, limited condensation of siRNA (Fig. 3a). In contrast, UAC condenses siRNA completely at a weight ratio of 20:1. This suggests that the introduction of urocanic acid groups to the chitosan backbone improves the capacity for siRNA binding. Based on these results, we use weight ratios of polymer/siRNA over 60:1 in the following experiments.
Fig. 3.
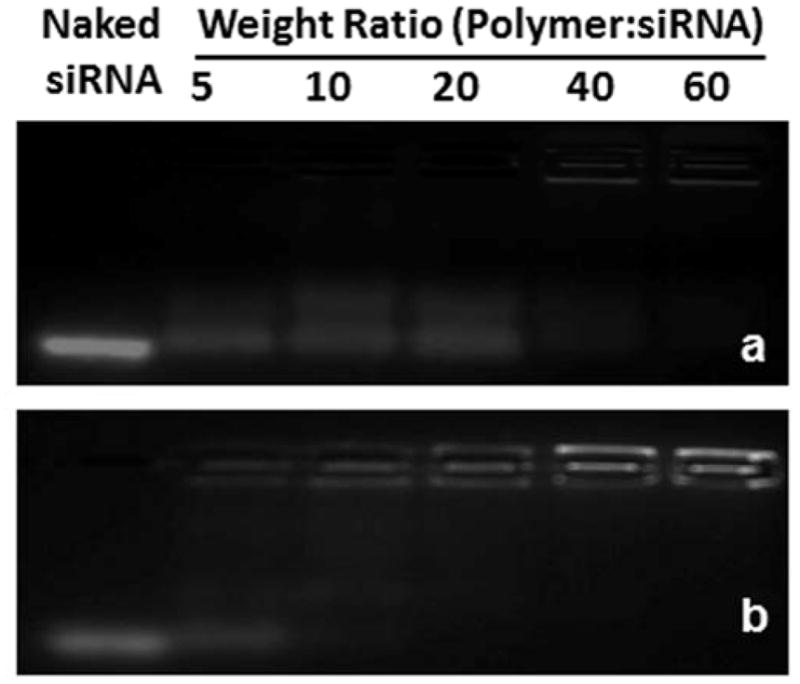
Agarose gel electrophoresis of (a) chitosan/siRNA NPs and (b) UAC/siRNA NPs with different weight ratios (5:1, 10:1, 20:1, 40:1 and 60:1).
3.3 Particle size, zeta potential and morphology of NPs
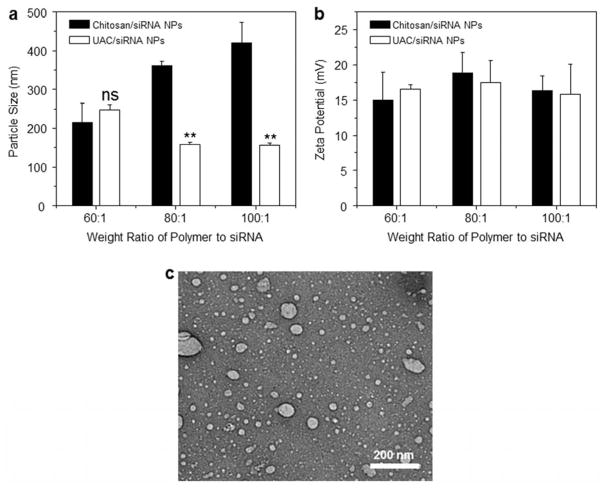
Particle size plays a key role in the cellular uptake of NPs, and is thus one of the most important parameters for cationic polymers intended for use as siRNA vectors. Several previous studies reported that cells typically take up NPs that range in diameter from 50 to several hundred nanometers [32, 33]. Fig. 4a shows the hydrodynamic diameters of NPs generated with different weight ratios of polymer and siRNA. For the chitosan/siRNA NPs, the particle sizes increase sharply as the weight ratios increase, reaching a maximum value around 420.9 nm. The diameters of the UAC/siRNA NPs are ranging from 150.0 to 247.1 nm. There is no noticeable difference in the diameters of chitosan/siRNA NPs and UAC/siRNA NPs at the weight ratio of 60:1, but at weight ratios of 80:1 and above, the NPs formed with UAC are markedly smaller than those formed with chitosan.
Fig. 4.
Particle sizes (nm), zeta potentials (mV) and morphological characterization of NPs. (a) Particle sizes and (b) zeta potentials of chitosan/siRNA NPs and UAC/siRNA NPs with different weight ratios (60:1, 80:1 and 100:1). (c) Transmission electron microscopy (TEM) of a suspension of UAC/siRNA NPs (weight ratio, 60:1). Each point represents the mean ± S.E.M. (n=3). Statistical significance was assessed using the Student’s t-test (*P<0.05 and **P<0.01).
The zeta potential of NPs determines their colloidal stability and influences the effectiveness of their interactions with negative-charged cell membranes. Thus, the zeta potential of NPs can significantly impact their transfection efficiency. As seen in Fig. 4b, the zeta potentials of the generated NPs are all in the range of 14.9–18.8 mV and are found to be independent of the weight ratios. It has been reported that a slightly positive zeta potential yields the best transfection efficiency [13]. Thus, the generated NPs appear to be appropriate for delivering siRNA into cells.
Fig. 4c shows a representative TEM image of UAC/siRNA NPs (60:1). They are found to be largely spherical, with mean diameters smaller than 80 nm. The particle size measured by TEM is smaller than that determined by DLS, which is consistent with a previous finding [7]. This may reflect that DLS measures fully hydrated (swollen) particles, whereas TEM measurements are performed in a dry state.
3.4 Cytotoxicity of UAC
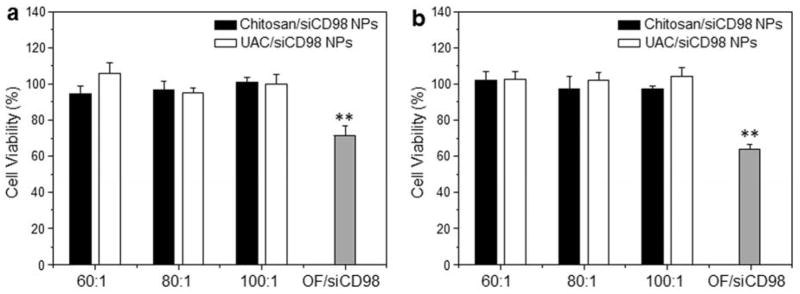
Cytotoxicity is a primary concern in the development of gene transfection reagents. To evaluate the cytotoxicity of various NPs, we treated Raw 264.7 macrophages (Fig. 5a) and colon-26 cells (Fig. 5b) with various weight ratios of polymer to siRNA (siRNA, 100 nM), and subsequently examined cell viability using MTT assays. As shown in Fig. 5, none of the chitosan/siRNA NPs and UAC/siRNA NPs causes any obvious cytotoxicity against either cell line. In contrast, OF/siRNA NPs applied using the recommended transfection conditions show significantly higher cytotoxicity than chitosan-based NPs. This might explain why OF is recommended for the transfection of highly confluent cells, as sufficient cells would survive to enable subsequent experiments.
Fig. 5.
Cytotoxicity of chitosan/siRNA NPs and UAC/siRNA NPs with different weight ratios (60:1, 80:1 and 100:1) against (a) Raw 264.7 macrophages and (b) colon-26 cells for 24 h. siRNAs were used at a concentration of 100 nM except for the OF/siRNA NPs, which were generated according to the manufacturer’s standard protocols. Toxicity is given as the percentage of viable cells remaining after treatment. Each point represents the mean ± S.E.M. (n=5). Statistical significance was assessed using the Student’s t-test (*P<0.05 and **P<0.01).
3.5 Cellular uptake of NPs by macrophages
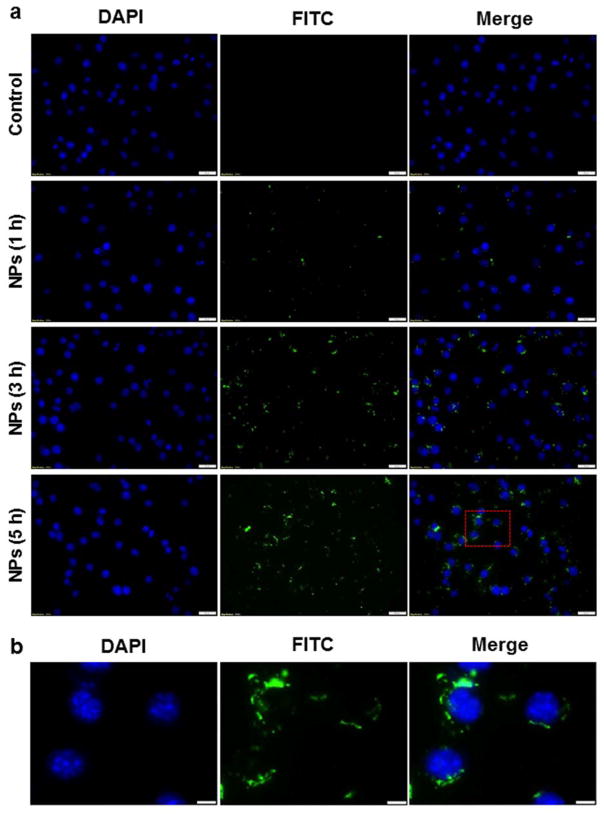
The internalization of NPs by macrophages is a vital concern for efforts to ameliorate inflammatory disease, since a higher macrophage uptake of NPs should yield a better therapeutic efficacy. To investigate the cellular uptake behavior of UAC/FITC-siRNA NPs (weight ratio, 60:1), we used fluorescence microscopy to monitor their time-dependent accumulation in Raw 264.7 macrophages (at 1, 3, and 5 h). As shown in Fig. 6a, we observe time-dependent cellular uptake profiles of NPs. Control cells are negative for green fluorescence, whereas cells treated with FITC-siRNA-loaded NPs exhibit obvious green fluorescence. An examination of cell images reveals weak intracellular fluorescence after 1 h of co-incubation, suggesting that very few NPs are internalized into cells during this short time period. In contrast, cells incubated with NPs for 3 h or 5 h show bright and stable green fluorescence, indicating that NPs accumulate in the cells. Moreover, individual cell images reveal that NPs are internalized into the cell cytoplasm, not the nucleus (Fig. 6b). This likely reflects that nuclear pore complexes are typically between 20 and 50 nm, and therefore become limiting for NPs with diameters greater than 200 nm.
Fig. 6.
(a) Cellular uptake profiles of UAC/siRNA NPs (weight ratio, 60:1) in Raw 264.7 macrophages at different time points (1, 3 and 5 h). Scale bar represents 20 μm. (b) Intracellular distribution of UAC/siRNA NPs (weight ratio, 60:1) in Raw 264.7 macrophages indicated by the red frame in Fig. 6a. Scale bar represents 5 μm. Cells were treated with NPs loaded with FITC-siRNA (green) and processed for fluorescence staining. FITC-siRNA (100 nM) was used for the transfection. Fixed cells were stained with DAPI (purple) for visualization of nuclei.
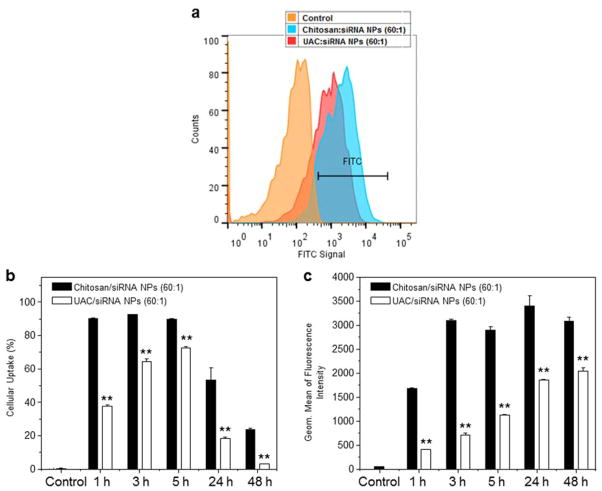
To quantitatively assess the cellular uptakes of siRNA-loaded NPs, we treated Raw 264.7 macrophages with various NPs and used FCM to investigate their cellular uptake profiles at different time points (1, 3, 5, 24 and 48 h). The fluorescence intensity of Raw 264.7 macrophages treated with chitosan/FITC-siRNA NPs (60:1) is obviously higher than that of cells treated with UAC/FITC-siRNA NPs (60:1) after 5 h of co-incubation (Fig. 7a). As presented in Fig. 7b, the cellular uptake efficiencies of chitosan/siRNA NPs are over 90.0%, and are 2.4-, 1.4-, 1.2-, 2.9- and 8.3-fold higher than those of the UAC/siRNA NPs at 1, 3, 5, 24 and 48 h, respectively. In addition, the maximal cellular uptake is observed at the time point of 5 h, and tends to decrease with further incubation, indicating the dilution effect of siRNA due to cell proliferation. The corresponding geometric means of the fluorescence intensities (Fig. 7c) corroborate that chitosan delivers significantly more intracellular siRNA than UAC. These results suggest that the introduction of urocanic acid groups to the chitosan backbone weakens the interaction between NPs and cells, decreasing the cellular uptake efficiency.
Fig. 7.
Quantification of cellular uptake of chitosan/siRNA NPs and UAC/siRNA NPs (weight ratio, 60:1) by Raw 264.7 macrophages. (a) Representative flow cytometric histograms of fluorescence intensity for cells treated with chitosan/siRNA NPs (weight ratio, 60:1) or UAC/siRNA NPs (weight ratio, 60:1) for 5 h. (b) Percentage of FITC fluorescence-positive cells and quantification of FITC fluorescent intensity in cells (c) after treatment with different NPs for 1, 3, 5, 24 and 48 h, respectively. FITC-siRNA (100 nM) was used for the transfection. Each point represents the mean ± S.E.M. (n = 3; *P< 0.05 and **P< 0.01, Student’s t-test).
3.6 NP-mediated anti-inflammation in vitro
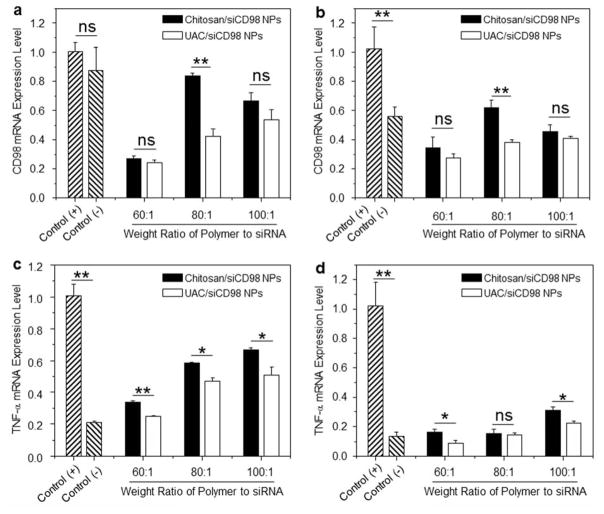
To investigate the RNAi effectiveness of our NPs, we tested the ability of siCD98-loaded NPs to knockdown the expression of CD98 in Raw 264.7 macrophages. Compared to cells treated with LPS, chitosan/siCD98 NPs and UAC/siCD98 NPs with different weight ratios produce marked decreases of CD98 mRNA expression levels after 24 h (Fig. 8a) and 48 h (Fig. 8b) of co-incubation. When the weight ratio of polymer to siRNA is set as 80:1, the CD98 mRNA expression levels are markedly lower in cells treated with UAC/siCD98 NPs in comparison to that of chitosan/siCD98 NPs. Additionally, UAC/siCD98 NPs-treated Raw 264.7 macrophages show lower CD98 mRNA expression levels compared to chitosan/siCD98 NPs, even though there are no statistically significant differences at the weight ratios of 60:1 and 100:1. Thus, although UAC/siCD98 NPs exhibit weaker intracellular internalization profiles within 48 h (Fig. 7), they still show improved gene-silencing effects. This could be attributed to their increased capacities for siRNA condensation and endosome/lysosome escape. The RNAi efficiency of UAC/siCD98 NPs decreases as the weight ratios increase, with a maximum RNAi value at a weight ratio of 60:1 for both time points (24 h and 48 h). The decreases in gene expression conferred by UAC/siCD98 NPs (60:1) are enhanced compared even to those conferred by OF/siRNA NPs (Supplementary Fig. 3). Given that the concentration of siCD98 contained in UAC/siCD98 NPs (60:1) is 2-fold less than that used in OF/siCD98 NPs, our results suggest that UAC has an excellent capacity for delivering siRNA. We further examined whether the NP-mediated down-regulation of CD98 could attenuate the mRNA expression level of a pro-inflammatory cytokine in vitro. Since TNF-α is the major pro-inflammatory cytokine secreted by macrophages during inflammation, we tested its expression level in Raw 264.7 macrophages after the treatment of siCD98-loaded NPs. Interestingly, we find that the significant knockdown of CD98 mRNA levels attenuate the activation of TNF-α after 24 h and 48 h of treatment (Fig. 8c, Fig. 8d and Supplementary Fig. 3). The observed decreasing trend in TNF-α mRNA levels is similar to that observed for the CD98 mRNA levels. These results suggest that CD98 might be a critical factor in inflammation, and that decreasing its expression could potentially alleviate inflammation. As seen in Fig. 8, UAC/siCD98 NPs (60:1)-treated Raw 264.7 macrophages show the lowest CD98 and TNF-α mRNA expression levels in comparison to all the other NPs-treated cells at different time points (24 and 48 h). Therefore, UAC/siCD98 NP (60:1) is the optimized formulation for delivering siCD98 to macrophages.
Fig. 8.
In vitro RNAi ability of various NPs (weight ratio, 60:1) against Raw 267.4 macrophages. CD98 mRNA expression levels of cells exposed to NPs for (a) 24 h and (b) 48 h. TNF-α mRNA expression levels of cells exposed to NPs for (c) 24 h and (d) 48 h. After treatment by NPs, cells were treated with LPS (5 μg/mL) for 3 h. Each point represents the mean ± S.E.M. (n=3). Statistical significance was assessed using the Student’s t-test (*P<0.05, **P<0.01; ns, non-significant).
4. Conclusion
In the present study, urocanic acid-modified chitosan (UAC) was successfully prepared. Its physicochemical properties were evaluated, and it was used to condense CD98 siRNA (siCD98) to form nanoparticles (NPs). UAC showed an enhanced siRNA condensation capacity compared to chitosan. The spherical UAC/siCD98 NPs had a hydrodynamic diameter in the range of 156.0 to 247.1 nm, and a positive surface charge that ranged from 15.8 to 17.5 mV. Importantly, UAC/siCD98 NPs with various weight ratios exhibited negligible cytotoxicity. The in vitro transfection efficiencies of UAC/siCD98 NPs were strongly dependent on their weight ratios. Among the tested UAC/siCD98 NPs, those with a weight ratio of 60:1 showed the highest transfection efficiency and best anti-inflammatory capacity in macrophages. These results collectively suggest that UAC/siCD98 NP could potentially be exploited as an efficient nanotherapeutic for anti-inflammation.
Supplementary Material
Supplementary Fig. 1. FT-IR spectra of (a) chitosan and (b) UAC.
Supplementary Fig. 2. Acid-base titration of NaCl, UAC and bPEI.
Supplementary Fig. 3. CD98 and TNF-α mRNA expression levels of Raw 267.4 macrophages exposed to OF/siCD98 NPs for 24 h and 48 h. After treatment with NPs, cells were treated with LPS (5 μg/mL) for 3 h. Each point represents the mean ± S.E.M. (n=3).
Highlights.
CD98 siRNA (siCD98) was complexed with urocanic acid-modified chitosan (UAC) to form nanoparticles (NPs).
UAC/siCD98 NPs have no apparent cytotoxicity against Raw 264.7 macrophages and colon-26 cells.
UAC/siCD98 NPs exhibited a time-dependent cellular uptake profile in Raw 264.7 macrophages.
UAC/siCD98 NPs with a weight ratio of 60:1 yielded the most efficient knockdowns of CD98 and the pro-inflammatory cytokine (TNF-α).
The RNAi efficiency of UAC/siCD98 NPs (60:1) was even higher than that of the positive control Oligofectamine/siCD98 NPs.
Acknowledgments
This work was supported by grants from the Department of Veterans Affairs (Merit Award to D.M.), the National Institutes of Health of Diabetes and Digestive and Kidney by the grant RO1-DK-071594 (to D.M.), the National Natural Science Foundation of China (grant numbers: 51503172 and 81571807), the Fundamental Research Funds for the Central Universities (SWU114086 and XDJK2015C067) and the Scientific Research Foundation for the Returned Overseas Chinese Scholars (State Education Ministry). E.V. is a recipient of a Research Fellowship award from the Crohn’s & Colitis Foundation of America. D.M. is a recipient of a Career Scientist Award from the Department of Veterans Affairs.
Footnotes
Publisher's Disclaimer: This is a PDF file of an unedited manuscript that has been accepted for publication. As a service to our customers we are providing this early version of the manuscript. The manuscript will undergo copyediting, typesetting, and review of the resulting proof before it is published in its final citable form. Please note that during the production process errors may be discovered which could affect the content, and all legal disclaimers that apply to the journal pertain.
References
- 1.Yan Y, Vasudevan S, Nguyen HT, Merlin D. Biochim Biophys Acta. 2008;1780:1087. doi: 10.1016/j.bbagen.2008.06.007. [DOI] [PMC free article] [PubMed] [Google Scholar]
- 2.Nguyen HT, Merlin D. Cell Mol Life Sci. 2012;69:3015. doi: 10.1007/s00018-012-0963-z. [DOI] [PMC free article] [PubMed] [Google Scholar]
- 3.Féral CC, Nishiya N, Fenczik CA, Stuhlmann H, Slepak M, Ginsberg MH. Proc Natl Acad Sci U S A. 2005;102:355. doi: 10.1073/pnas.0404852102. [DOI] [PMC free article] [PubMed] [Google Scholar]
- 4.Prager GW, Féral CC, Kim C, Han J, Ginsberg MH. J Biol Chem. 2007;282:24477. doi: 10.1074/jbc.M702877200. [DOI] [PubMed] [Google Scholar]
- 5.Nguyen HT, Dalmasso G, Torkvist L, Halfvarson J, Yan Y, Laroui H, Shmerling D, Tallone T, D’Amato M, Sitaraman SV, Merlin D. J Clin Invest. 2011;121:1733. doi: 10.1172/JCI44631. [DOI] [PMC free article] [PubMed] [Google Scholar]
- 6.Xiao B, Laroui H, Viennois E, Ayyadurai S, Charania MA, Zhang Y, Zhang Z, Baker MT, Zhang B, Gewirtz AT, Merlin D. Gastroenterology. 2014;146:1289. doi: 10.1053/j.gastro.2014.01.056. [DOI] [PMC free article] [PubMed] [Google Scholar]
- 7.Xiao B, Laroui H, Ayyadurai S, Viennois E, Charania MA, Zhang Y, Merlin D. Biomaterials. 2013;34:7471. doi: 10.1016/j.biomaterials.2013.06.008. [DOI] [PMC free article] [PubMed] [Google Scholar]
- 8.Hannon GJ. Nature. 2002;418:244. doi: 10.1038/418244a. [DOI] [PubMed] [Google Scholar]
- 9.Whitehead KA, Langer R, Anderson DG. DG Nat Rev Drug Discov. 2009;8:129. doi: 10.1038/nrd2742. [DOI] [PMC free article] [PubMed] [Google Scholar]
- 10.Han L, Tang C, Yin CH. Biomaterials. 2013;34:5317. doi: 10.1016/j.biomaterials.2013.03.060. [DOI] [PubMed] [Google Scholar]
- 11.Lu B, Xu XD, Zhang XZ, Cheng SX, Zhuo RX. Biomacromolecules. 2008;9:2594. doi: 10.1021/bm8004676. [DOI] [PubMed] [Google Scholar]
- 12.Putnam D. Nat Mater. 2006;5:439. doi: 10.1038/nmat1645. [DOI] [PubMed] [Google Scholar]
- 13.Kim TH, Ihm JE, Choi YJ, Nah JW, Cho CS. J Control Release. 2003;93:389. doi: 10.1016/j.jconrel.2003.08.017. [DOI] [PubMed] [Google Scholar]
- 14.Kim TH, Kim SI, Akaike T, Cho CS. J Control Release. 2005;105:354. doi: 10.1016/j.jconrel.2005.03.024. [DOI] [PubMed] [Google Scholar]
- 15.Tseng YC, Mozumdar S, Huang L. Adv Drug Deliv Rev. 2009;61:721. doi: 10.1016/j.addr.2009.03.003. [DOI] [PMC free article] [PubMed] [Google Scholar]
- 16.Yang CX, Gao S, Kjems J. J Mater Chem B Mater Biol Med. 2014;2:8608. doi: 10.1039/c4tb01374c. [DOI] [PubMed] [Google Scholar]
- 17.Song W, Zhao L, Fang K, Chang B, Zhang Y. J Mater Chem B Mater Biol Med. 2015;3:8567. doi: 10.1039/c5tb01062d. [DOI] [PubMed] [Google Scholar]
- 18.Choi B, Cui ZK, Kim S, Fan J, Wu BM, Lee M. J Mater Chem B Mater Biol Med. 2015;3:6448. doi: 10.1039/C5TB00843C. [DOI] [PMC free article] [PubMed] [Google Scholar]
- 19.Xiao B, Merlin D. Expert Opin Drug Deliv. 2012;9:1393. doi: 10.1517/17425247.2012.730517. [DOI] [PubMed] [Google Scholar]
- 20.Wagner E, Control J. Release. 1998;53:155. doi: 10.1016/s0168-3659(97)00249-6. [DOI] [PubMed] [Google Scholar]
- 21.Yang Y, Xu Z, Jiang J, Gao Y, Gu W, Chen L, Tang X, Li Y, Control J. Release. 2008;127:273. doi: 10.1016/j.jconrel.2008.01.012. [DOI] [PubMed] [Google Scholar]
- 22.Park JS, Han TH, Lee KY, Han SS, Hwang JJ, Moon DH, Kim SY, Cho YW, Control J. Release. 2006;115:37. doi: 10.1016/j.jconrel.2006.07.011. [DOI] [PubMed] [Google Scholar]
- 23.Roufai MB, Midoux P. Bioconjug Chem. 2001;12:92. doi: 10.1021/bc0000738. [DOI] [PubMed] [Google Scholar]
- 24.Mishra S, Heidel JD, Webster P, Davis ME. J Control Release. 2006;116:179. doi: 10.1016/j.jconrel.2006.06.018. [DOI] [PubMed] [Google Scholar]
- 25.Wang W, Yao J, Zhou JP, Lu Y, Wang Y, Tao L, Li YP. Biochem Biophys Res Commun. 2008;377:567. doi: 10.1016/j.bbrc.2008.10.023. [DOI] [PubMed] [Google Scholar]
- 26.Jin H, Kim TH, Hwang SK, Chang SH, Kim HW, Anderson HK, Lee HW, Lee KH, Colburn NH, Yang HS, Cho MH, Cho CS. Mol Cancer Ther. 2006;5:1041. doi: 10.1158/1535-7163.MCT-05-0433. [DOI] [PubMed] [Google Scholar]
- 27.Jin H, Xu CX, Kim HW, Chung YS, Shin JY, Chang SH, Park SJ, Lee ES, Hwang SK, Kwon JT, Minai-Tehrani A, Woo M, Noh MS, Youn HJ, Kim DY, Yoon BI, Lee KH, Kim TH, Cho CS, Cho MH. Cancer Gene Ther. 2008;15:275. doi: 10.1038/sj.cgt.7701116. [DOI] [PubMed] [Google Scholar]
- 28.Lavertu M, Méthot S, Tran-Khanh N, Buschmann MD. Biomaterials. 2006;27:4815. doi: 10.1016/j.biomaterials.2006.04.029. [DOI] [PubMed] [Google Scholar]
- 29.Badawy MEI, Rabea EI. Postharvest Biol Technol. 2009;51:110. [Google Scholar]
- 30.Xiao B, Wan Y, Wang X, Zha Q, Liu H, Qiu Z, Zhang SM. Colloids Surf B Biointerfaces. 2012;91:168. doi: 10.1016/j.colsurfb.2011.10.053. [DOI] [PubMed] [Google Scholar]
- 31.Chen M, Wu J, Zhou L, Jin C, Tu C, Zhu B, Wu F, Zhu Q, Zhu X, Yan D. Polym Chem. 2011;2:2674. [Google Scholar]
- 32.Song Y, Sun Y, Zhang X, Zhou J, Zhang L. Biomacromolecules. 2008;9:2259. doi: 10.1021/bm800429a. [DOI] [PubMed] [Google Scholar]
- 33.Liu YM, Reineke TM. J Am Chem Soc. 2005;127:3004. doi: 10.1021/ja0436446. [DOI] [PubMed] [Google Scholar]
Associated Data
This section collects any data citations, data availability statements, or supplementary materials included in this article.
Supplementary Materials
Supplementary Fig. 1. FT-IR spectra of (a) chitosan and (b) UAC.
Supplementary Fig. 2. Acid-base titration of NaCl, UAC and bPEI.
Supplementary Fig. 3. CD98 and TNF-α mRNA expression levels of Raw 267.4 macrophages exposed to OF/siCD98 NPs for 24 h and 48 h. After treatment with NPs, cells were treated with LPS (5 μg/mL) for 3 h. Each point represents the mean ± S.E.M. (n=3).


